| Param | Original file | Final file |
|---|---|---|
| Filename | modeM0/AS1G06_154T02_9000001102_08014cztM0_level2.evt | modeM0/AS1G06_154T02_9000001102_08014cztM0_level2_quad_clean.evt |
| Size (bytes) | 153,028,800 | 20,882,880 |
| Size | 145.9 MB | 19.9 MB |
| Events in quadrant A | 1,089,516 | 120,068 |
| Events in quadrant B | 1,105,914 | 122,800 |
| Events in quadrant C | 1,076,823 | 120,472 |
| Events in quadrant D | 1,218,727 | 117,745 |
| Mode M0 | |||
|---|---|---|---|
| Quadrant | BADHDUFLAG | Total packets | Discarded packets |
| A | 0 | 4510 | 2 |
| B | 0 | 4575 | 1 |
| C | 0 | 4476 | 1 |
| D | 0 | 5036 | 1 |
| Mode SS | |||
|---|---|---|---|
| Quadrant | BADHDUFLAG | Total packets | Discarded packets |
| A | 0 | 42 | 0 |
| B | 0 | 42 | 0 |
| C | 0 | 42 | 0 |
| D | 0 | 42 | 0 |
| Mode M9 | |||
|---|---|---|---|
| Quadrant | BADHDUFLAG | Total packets | Discarded packets |
| A | 0 | 11 | 0 |
| B | 0 | 11 | 0 |
| C | 0 | 11 | 0 |
| D | 0 | 11 | 0 |
| Quadrant | Total seconds | Saturated seconds | Saturation percentage |
|---|---|---|---|
| A | 2081 | 35 | 1.681884% |
| B | 2081 | 31 | 1.489668% |
| C | 2081 | 30 | 1.441615% |
| D | 2081 | 41 | 1.970207% |
Noise dominated data is calculated using 1-second bins in cleaned event files. If a bin has >2000 counts, and if more than 50% of those come from <1% of pixels, then it is considered to be noise-dominated and hence unusable.
| Quadrant | # 1 sec bins | Bins with >0 counts | Bins with >2000 counts | High rate bins dominated by noise | Noise dominated (total time) | Noise dominated (detector-on time) | Marked lightcurve |
|---|---|---|---|---|---|---|---|
| A | 3176 | 2082 | 0 | 0 | 0.00% | 0.00% | 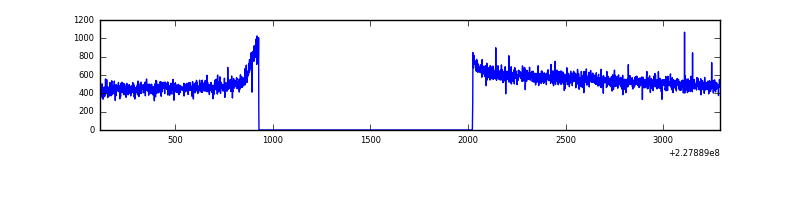 |
| B | 3176 | 2082 | 0 | 0 | 0.00% | 0.00% | 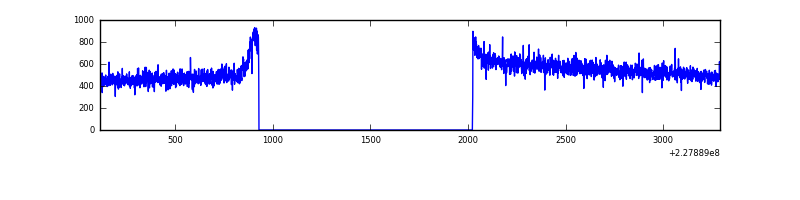 |
| C | 3176 | 2082 | 0 | 0 | 0.00% | 0.00% |  |
| D | 3176 | 2082 | 1 | 1 | 0.03% | 0.05% | 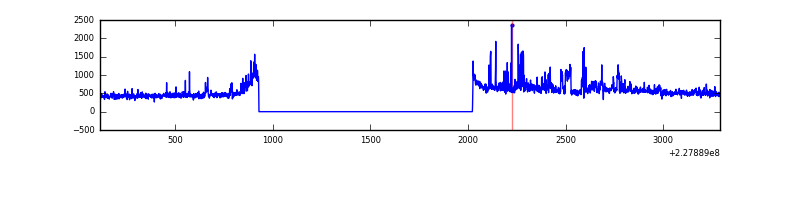 |
Top three noisy pixels from each quadrant. If the there are fewer than three noisy pixels in the level2.evt file, extra rows are filled as -1
| Pixel properties | Quadrant properties | ||||||
|---|---|---|---|---|---|---|---|
| Quadrant | DetID | PixID | Counts | Sigma | Mean | Median | Sigma |
| A | 0 | 226 | 2702 | 40.7 | 283 | 277 | 59.6 |
| A | 12 | 194 | 2381 | 35.32 | 283 | 277 | 59.6 |
| A | 3 | 137 | 1159 | 14.8 | 283 | 277 | 59.6 |
| B | 12 | 111 | 6185 | 105.6 | 284 | 277 | 55.9 |
| B | 11 | 111 | 5131 | 86.76 | 284 | 277 | 55.9 |
| B | 14 | 111 | 3687 | 60.95 | 284 | 277 | 55.9 |
| C | 1 | 16 | 2751 | 37.92 | 274 | 275 | 65.3 |
| C | 13 | 61 | 2129 | 28.39 | 274 | 275 | 65.3 |
| C | 8 | 222 | 990 | 10.95 | 274 | 275 | 65.3 |
| D | 11 | 144 | 135886 | 2010.49 | 274 | 267 | 67.5 |
| D | 1 | 52 | 38206 | 562.43 | 274 | 267 | 67.5 |
| D | 5 | 97 | 5694 | 80.45 | 274 | 267 | 67.5 |
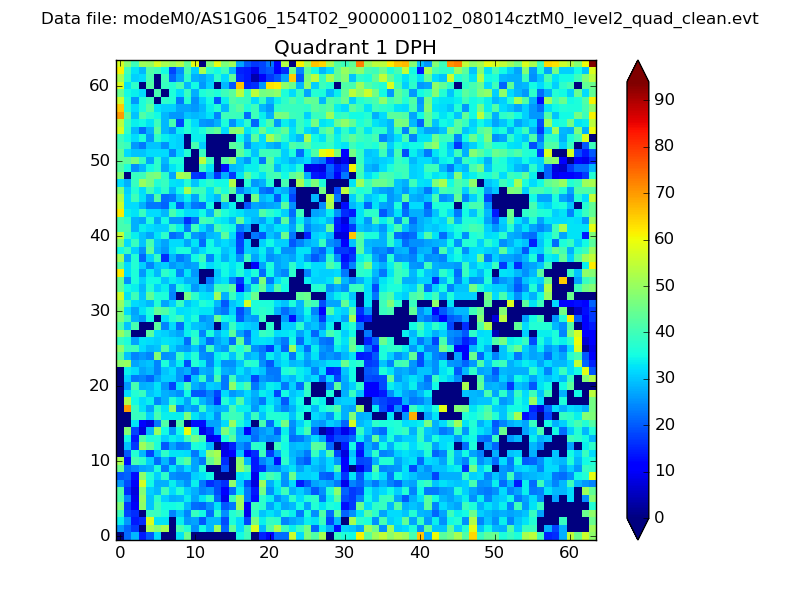
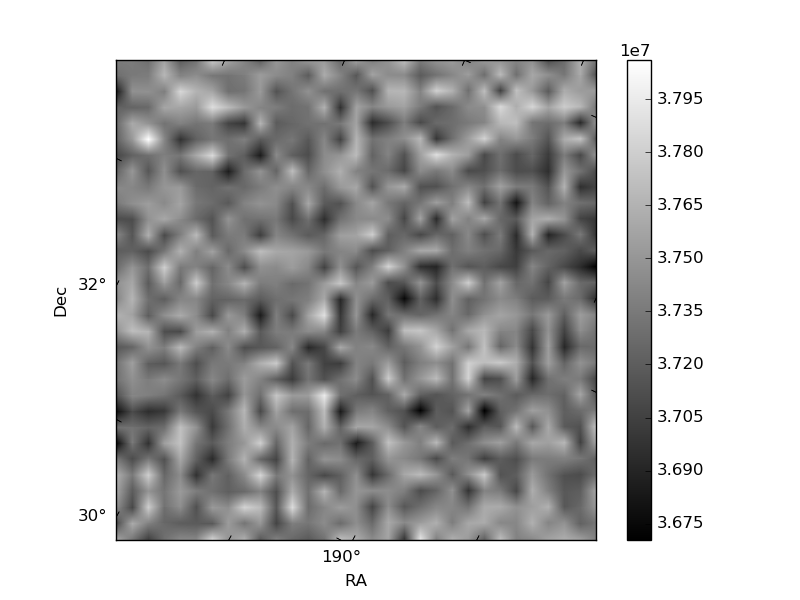
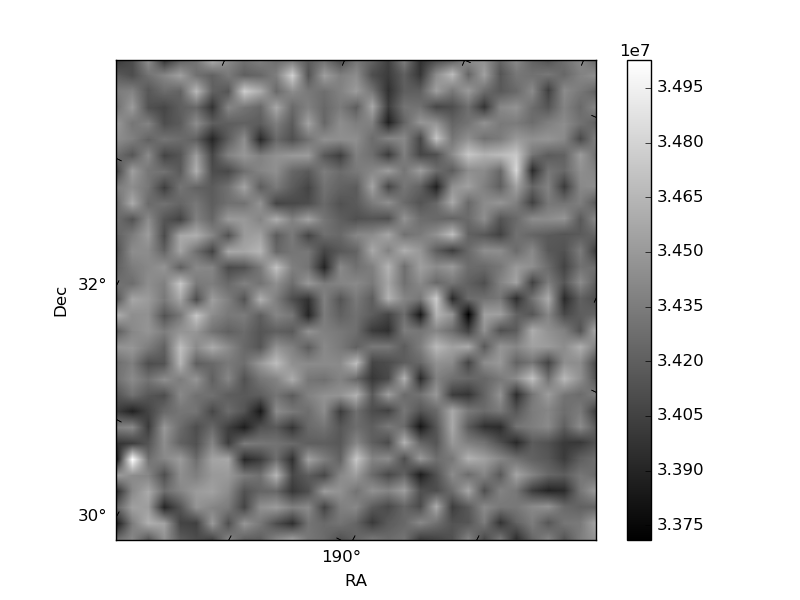
Histogram calculated using DETX and DETY for each event in the final _common_clean file
| Quadrant A | 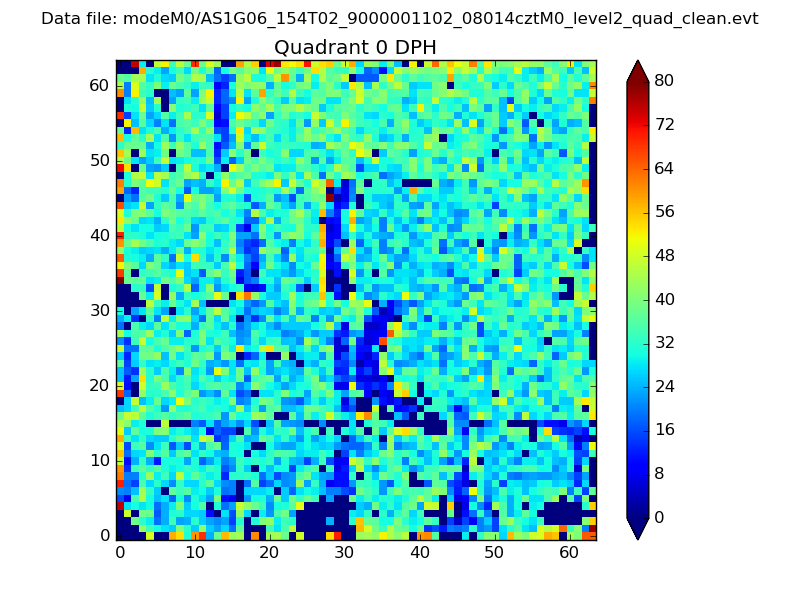 |
 |
Quadrant B |
|---|---|---|---|
| Quadrant D | 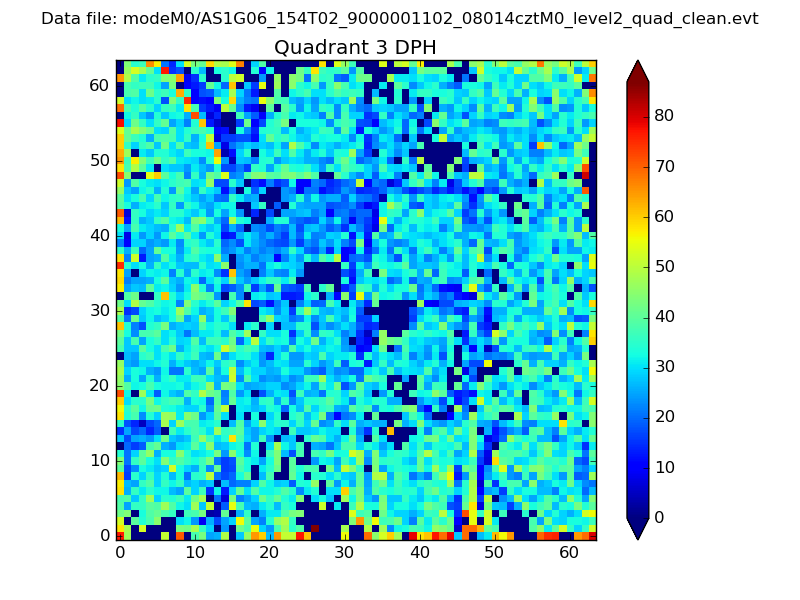 |
 |
Quadrant C |
| Plot type | Count rate plots | Images |
|---|---|---|
| Comparison with Poisson distribution Blue bars denote a histogram of data divided into 1 sec bins. Red curve is a Poisson curve with rate = median count rate of data. |
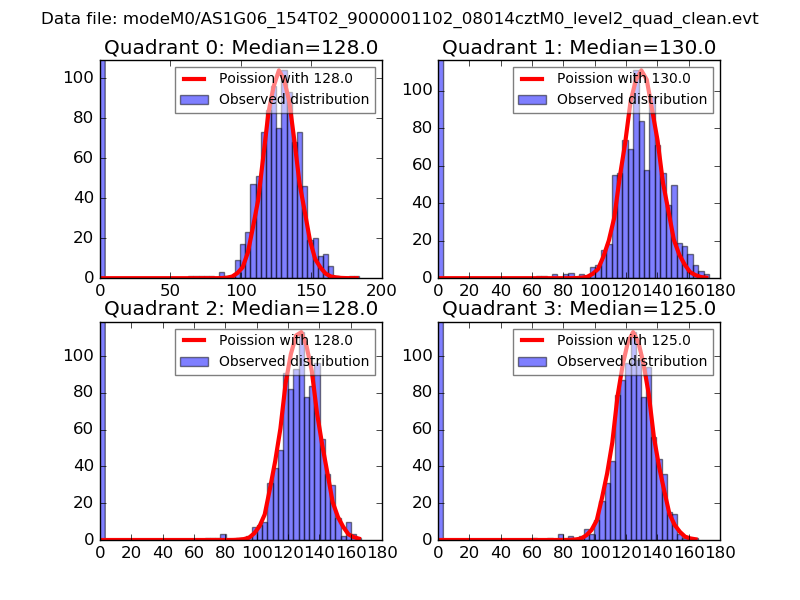 |
 |
| Quadrant-wise count rates Data is divided into 100 sec bins |
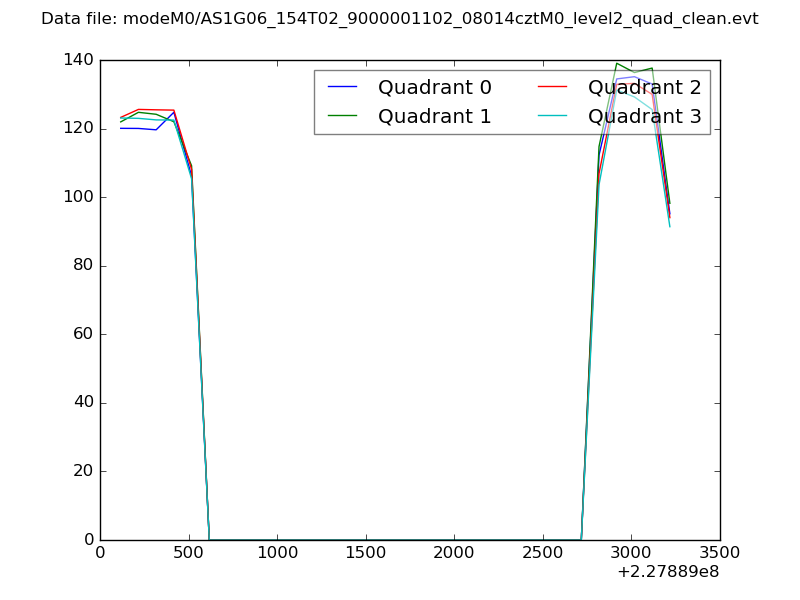 |
|
| Module-wise count rates for Quadrant A Data is divided into 100 sec bins |
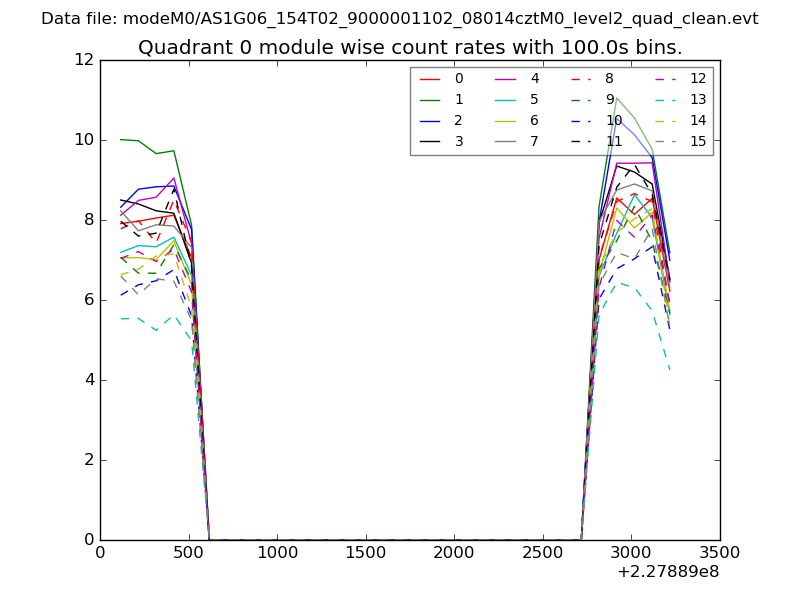 |
 |
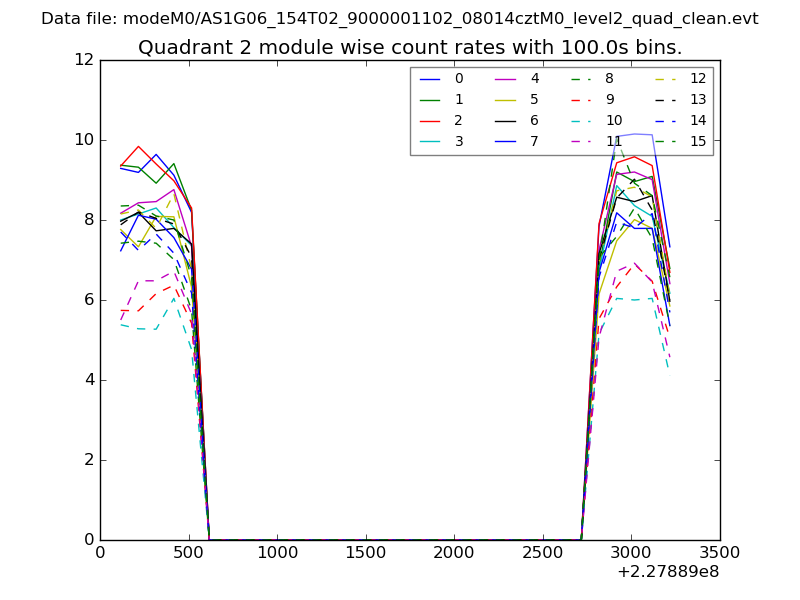
| Module-wise count rates for Quadrant B Data is divided into 100 sec bins |
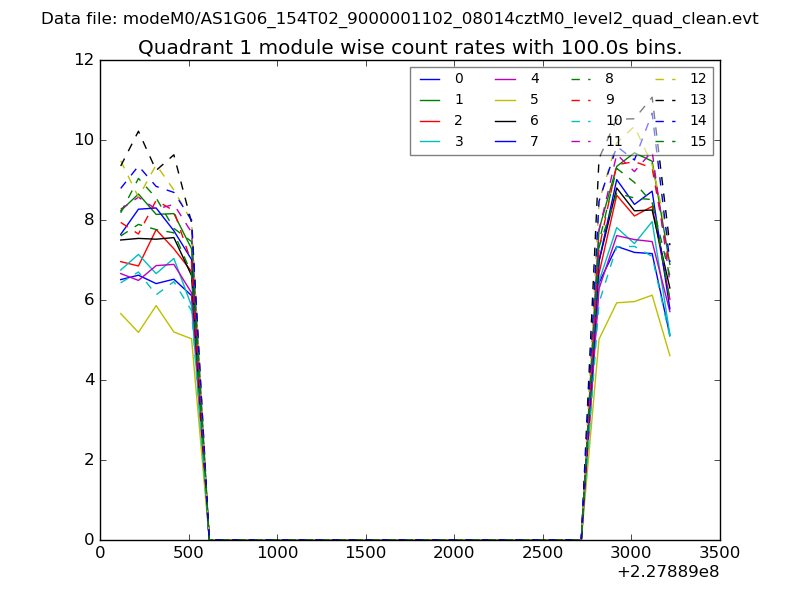 |
 |
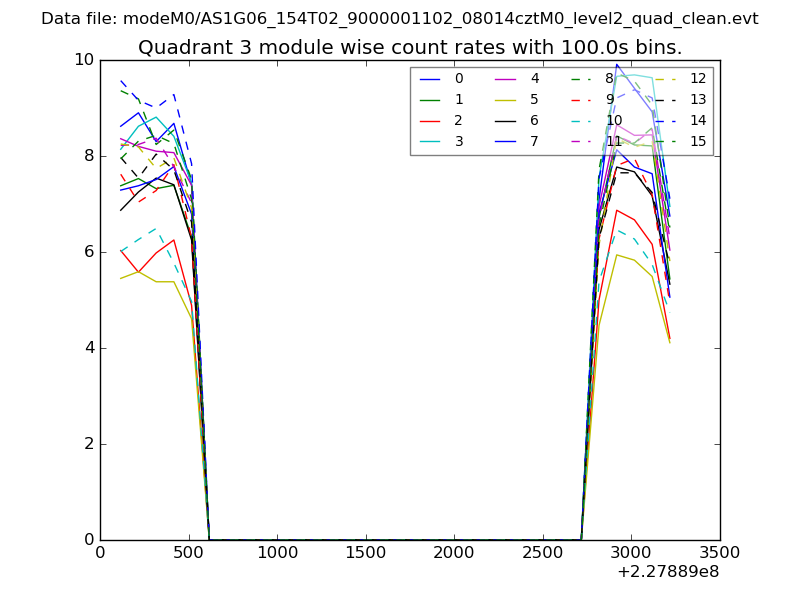
| Module-wise count rates for Quadrant C Data is divided into 100 sec bins |
 |
 |
| Module-wise count rates for Quadrant D Data is divided into 100 sec bins |
 |
 |
| Parameter | Plot |
|---|---|
| CZT HV Monitor | 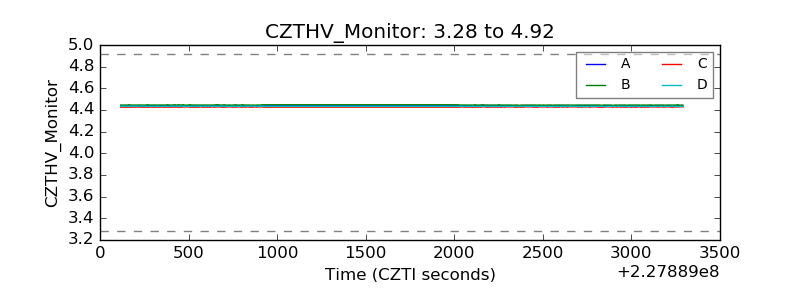 |
| D_VDD | 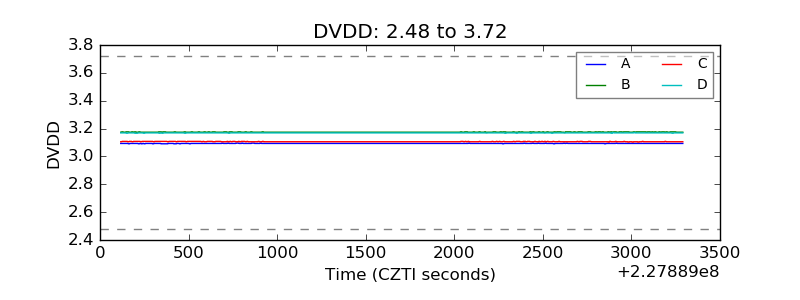 |
| Temperature 1 | 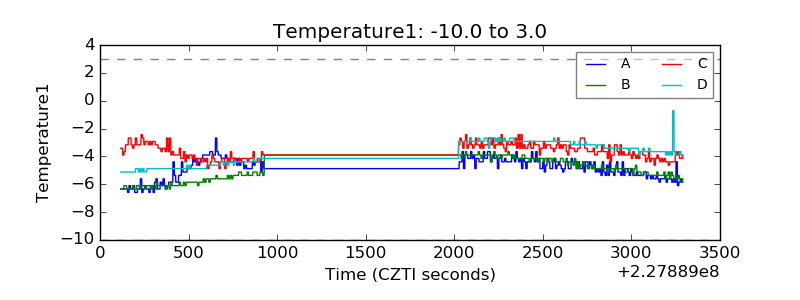 |
| Veto HV Monitor | 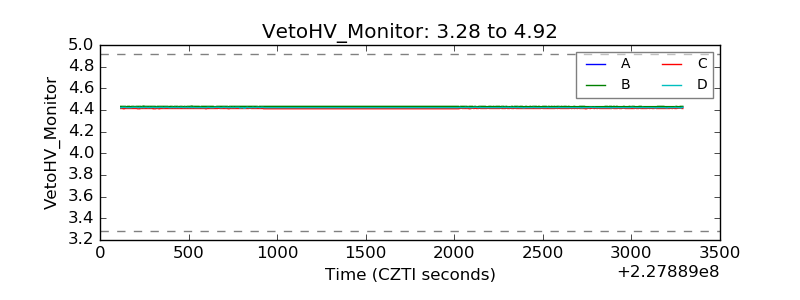 |
| Veto LLD | 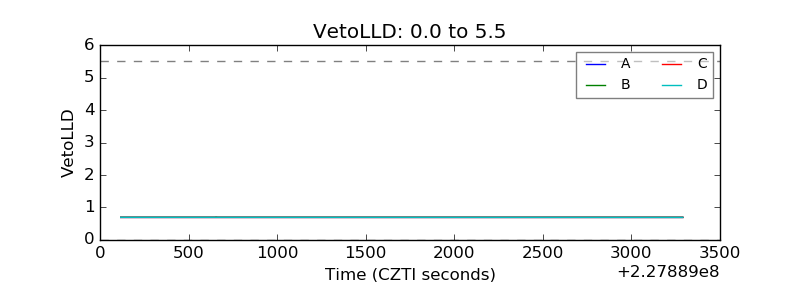 |
| Alpha Counter | 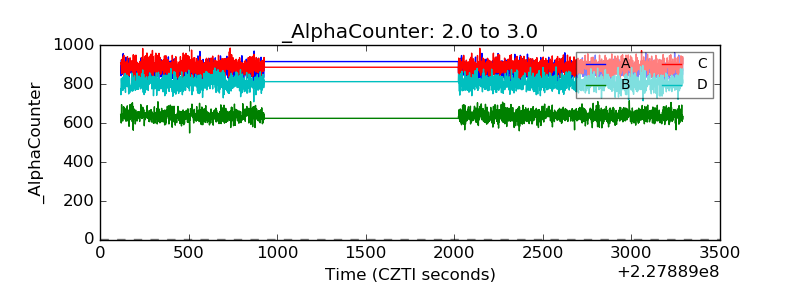 |
| _CPM_Rate | 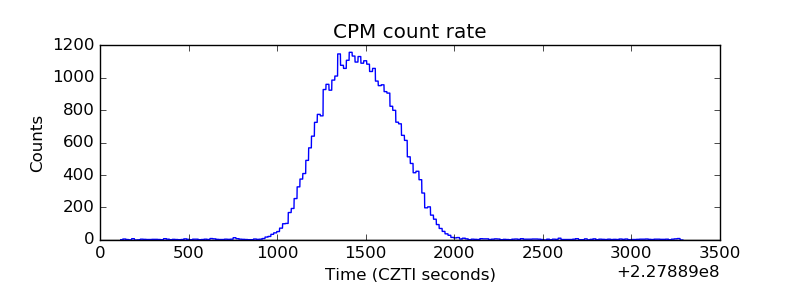 |
| CZT Counter |  |
| +2.5 Volts monitor |  |
| +5 Volts monitor | 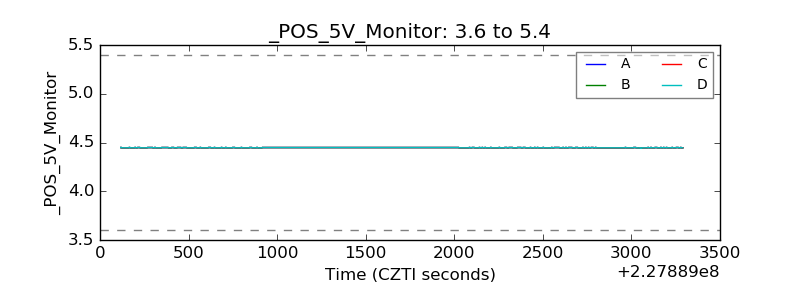 |
| _ROLL_ROT | 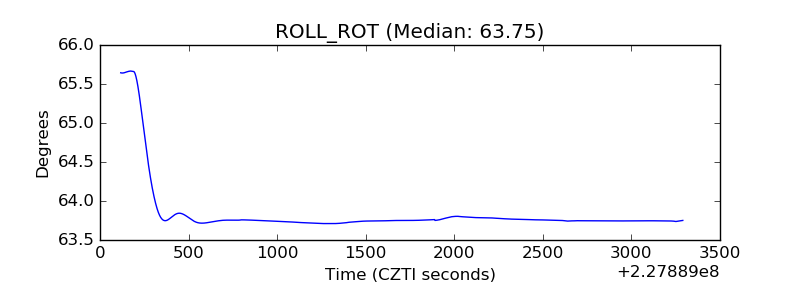 |
| _Roll_DEC | 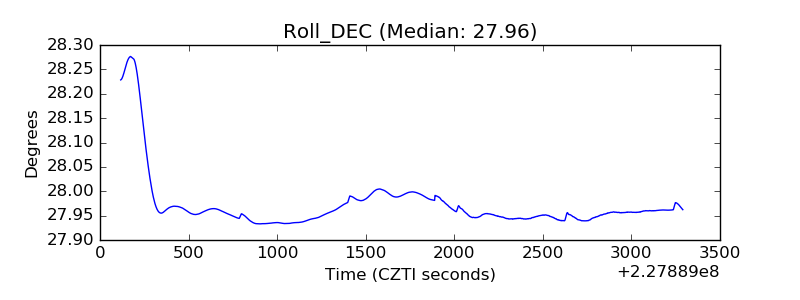 |
| _Roll_RA | 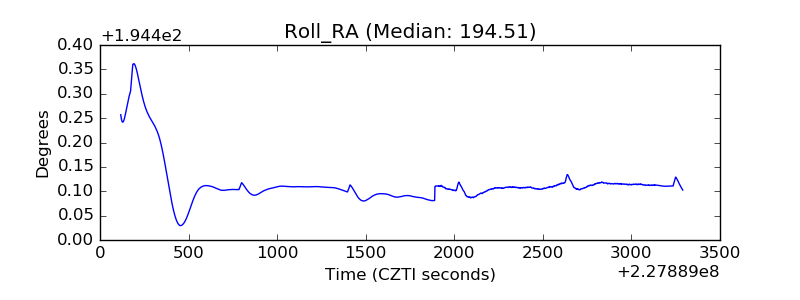 |
| Veto Counter | 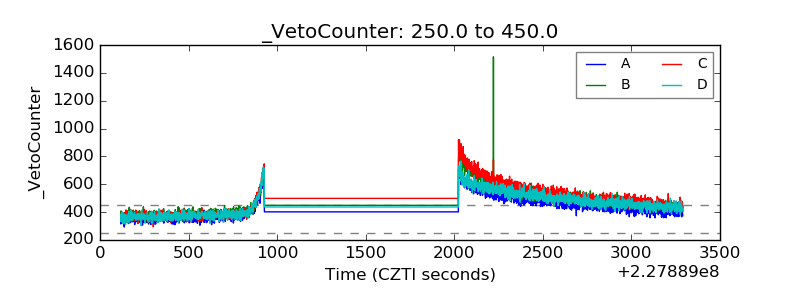 |