| Param | Original file | Final file |
|---|---|---|
| Filename | modeM0/AS1G06_168T15_9000001110_08050cztM0_level2.evt | modeM0/AS1G06_168T15_9000001110_08050cztM0_level2_quad_clean.evt |
| Size (bytes) | 148,464,000 | 36,164,160 |
| Size | 141.6 MB | 34.5 MB |
| Events in quadrant A | 907,394 | 241,981 |
| Events in quadrant B | 982,794 | 247,319 |
| Events in quadrant C | 940,118 | 244,590 |
| Events in quadrant D | 1,531,133 | 219,352 |
| Mode M0 | |||
|---|---|---|---|
| Quadrant | BADHDUFLAG | Total packets | Discarded packets |
| A | 0 | 4065 | 2 |
| B | 0 | 4244 | 1 |
| C | 0 | 4130 | 1 |
| D | 0 | 5889 | 1 |
| Mode M9 | |||
|---|---|---|---|
| Quadrant | BADHDUFLAG | Total packets | Discarded packets |
| A | 0 | 9 | 0 |
| B | 0 | 9 | 0 |
| C | 0 | 9 | 0 |
| D | 0 | 9 | 0 |
| Mode SS | |||
|---|---|---|---|
| Quadrant | BADHDUFLAG | Total packets | Discarded packets |
| A | 0 | 40 | 0 |
| B | 0 | 40 | 0 |
| C | 0 | 40 | 0 |
| D | 0 | 40 | 0 |
| Quadrant | Total seconds | Saturated seconds | Saturation percentage |
|---|---|---|---|
| A | 1945 | 10 | 0.514139% |
| B | 1945 | 15 | 0.771208% |
| C | 1945 | 8 | 0.411311% |
| D | 1945 | 168 | 8.637532% |
Noise dominated data is calculated using 1-second bins in cleaned event files. If a bin has >2000 counts, and if more than 50% of those come from <1% of pixels, then it is considered to be noise-dominated and hence unusable.
| Quadrant | # 1 sec bins | Bins with >0 counts | Bins with >2000 counts | High rate bins dominated by noise | Noise dominated (total time) | Noise dominated (detector-on time) | Marked lightcurve |
|---|---|---|---|---|---|---|---|
| A | 2785 | 1946 | 0 | 0 | 0.00% | 0.00% | 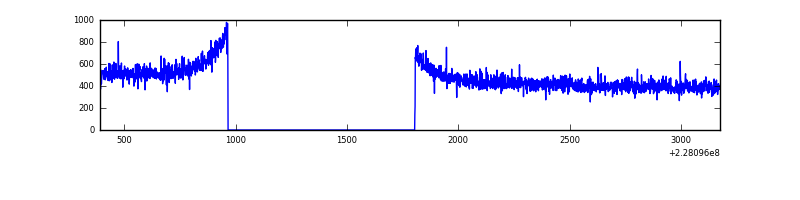 |
| B | 2785 | 1946 | 0 | 0 | 0.00% | 0.00% | 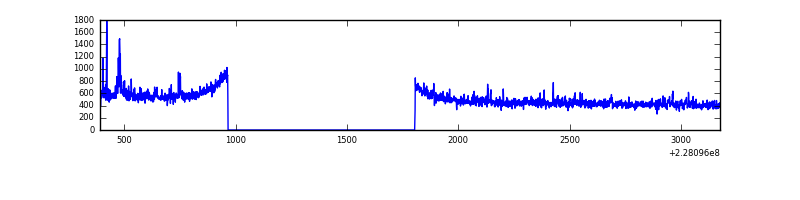 |
| C | 2785 | 1946 | 0 | 0 | 0.00% | 0.00% | 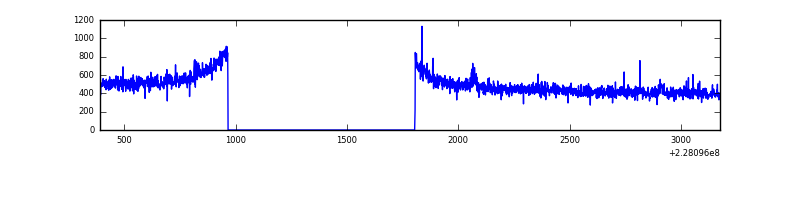 |
| D | 2785 | 1946 | 141 | 141 | 5.06% | 7.25% | 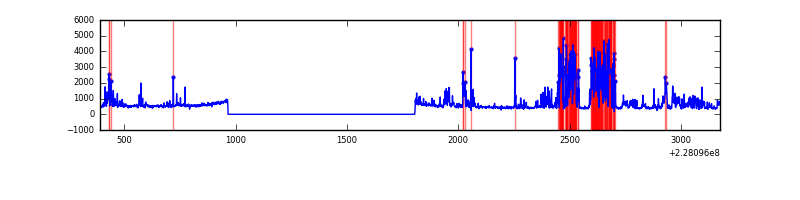 |
Top three noisy pixels from each quadrant. If the there are fewer than three noisy pixels in the level2.evt file, extra rows are filled as -1
| Pixel properties | Quadrant properties | ||||||
|---|---|---|---|---|---|---|---|
| Quadrant | DetID | PixID | Counts | Sigma | Mean | Median | Sigma |
| A | 0 | 226 | 2188 | 39.9 | 235 | 229 | 49.1 |
| A | 12 | 194 | 2073 | 37.56 | 235 | 229 | 49.1 |
| A | 0 | 128 | 1234 | 20.47 | 235 | 229 | 49.1 |
| B | 4 | 81 | 12337 | 250.31 | 240 | 234 | 48.4 |
| B | 11 | 51 | 9175 | 184.91 | 240 | 234 | 48.4 |
| B | 14 | 53 | 7909 | 158.73 | 240 | 234 | 48.4 |
| C | 1 | 16 | 17334 | 301.66 | 236 | 237 | 56.7 |
| C | 13 | 61 | 1785 | 27.31 | 236 | 237 | 56.7 |
| C | 14 | 67 | 1462 | 21.61 | 236 | 237 | 56.7 |
| D | 1 | 52 | 535822 | 9455.21 | 222 | 215 | 56.6 |
| D | 4 | 95 | 94811 | 1669.93 | 222 | 215 | 56.6 |
| D | 2 | 14 | 23126 | 404.45 | 222 | 215 | 56.6 |
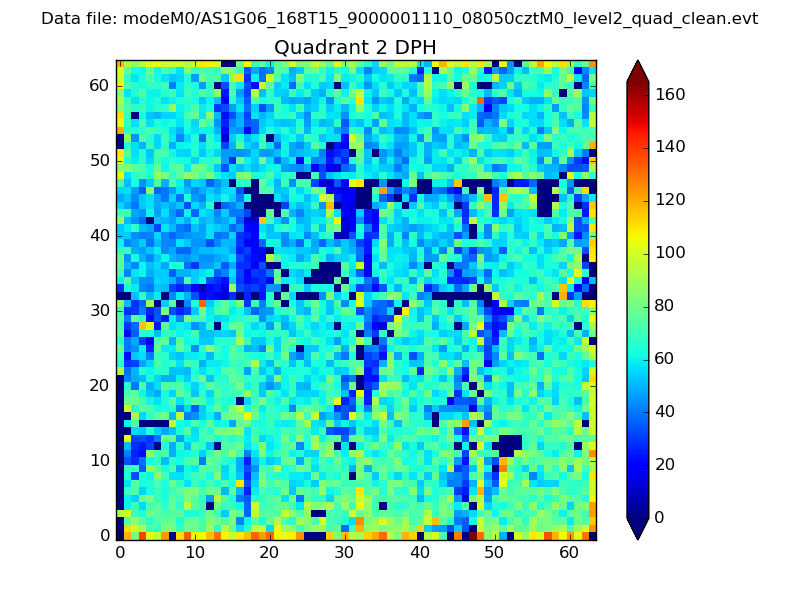
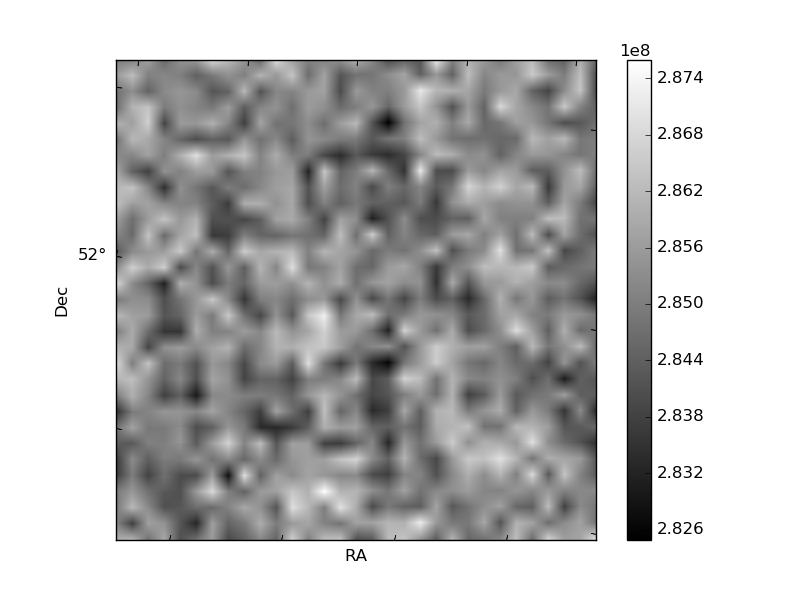
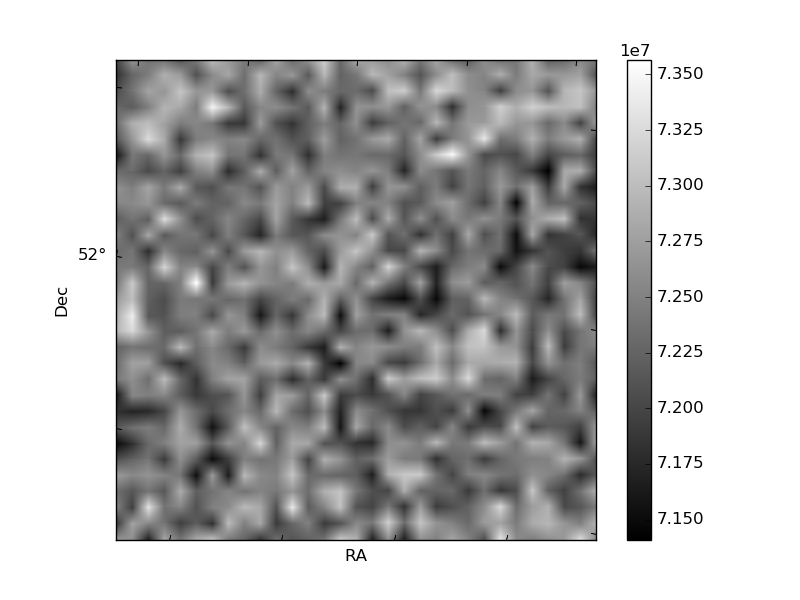
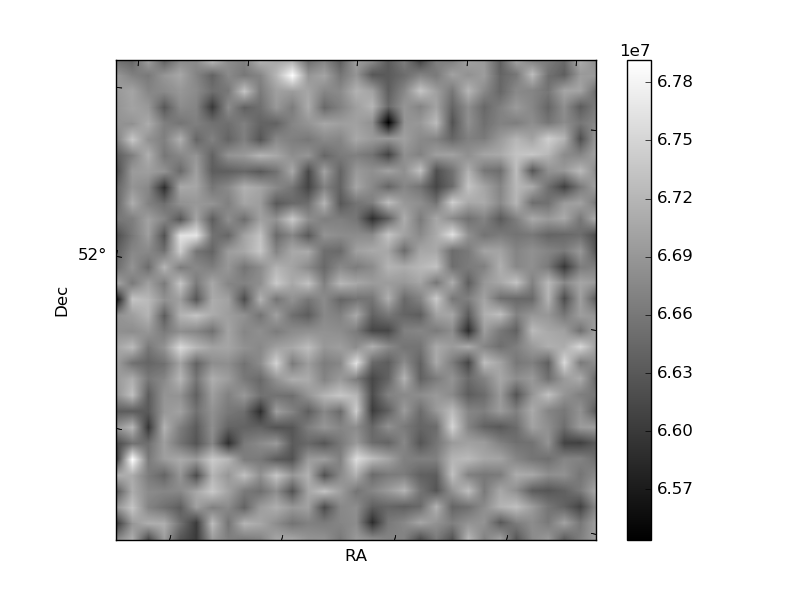
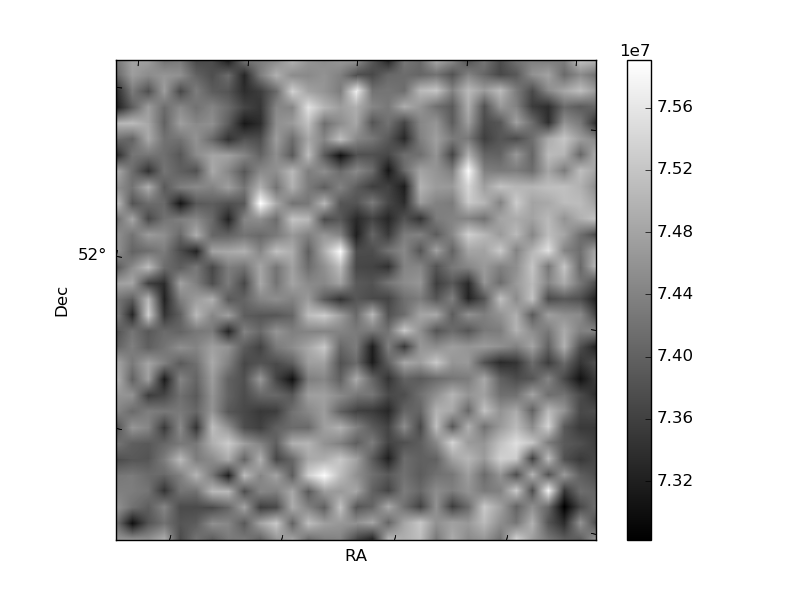
Histogram calculated using DETX and DETY for each event in the final _common_clean file
| Quadrant A | 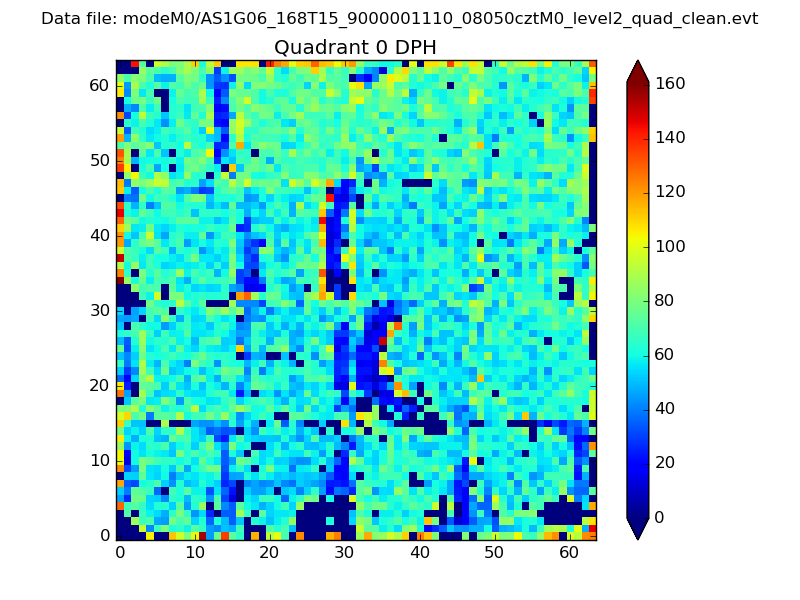 |
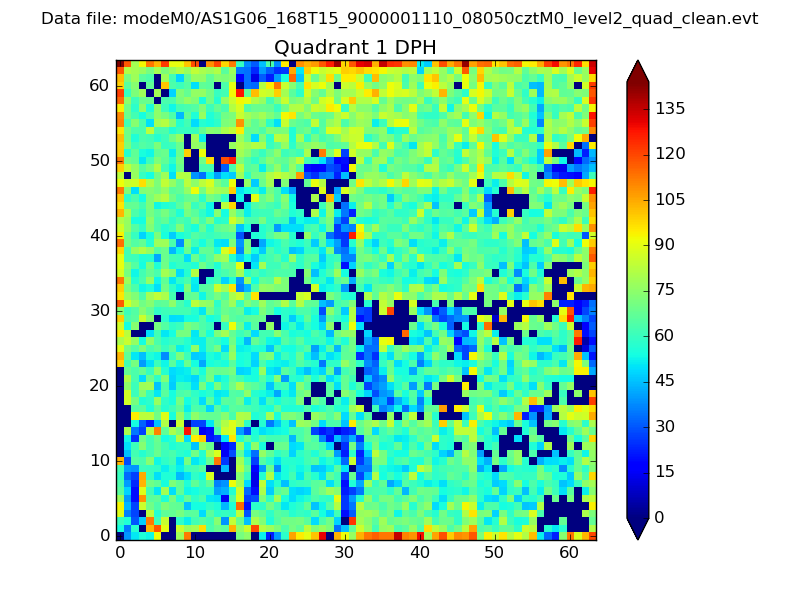 |
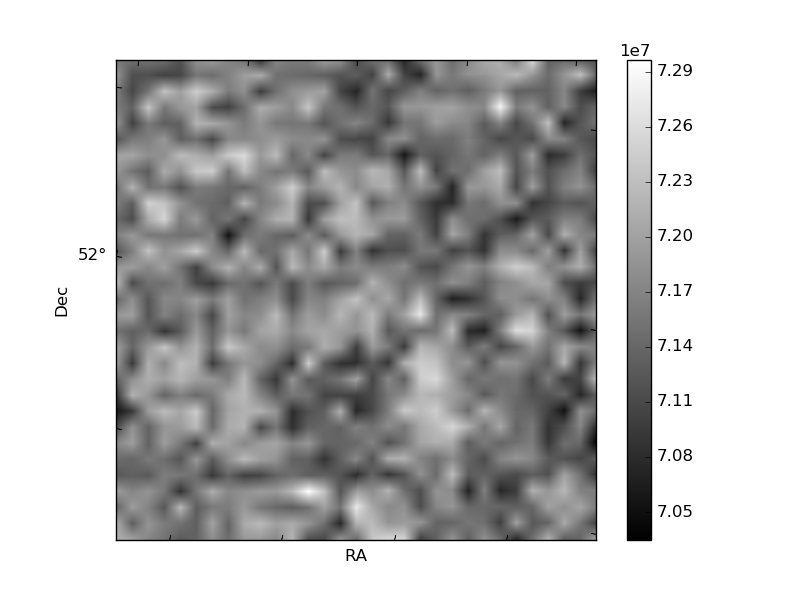
Quadrant B |
|---|---|---|---|
| Quadrant D | 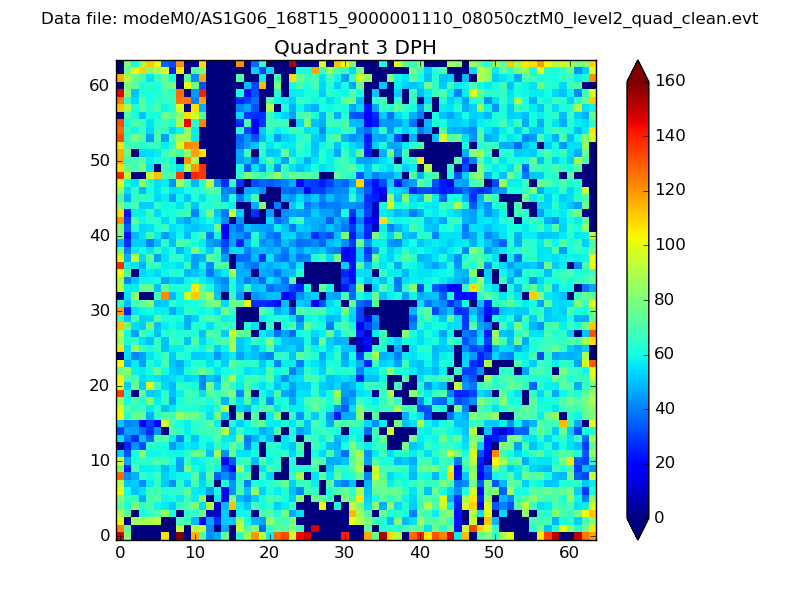 |
 |
Quadrant C |
| Plot type | Count rate plots | Images |
|---|---|---|
| Comparison with Poisson distribution Blue bars denote a histogram of data divided into 1 sec bins. Red curve is a Poisson curve with rate = median count rate of data. |
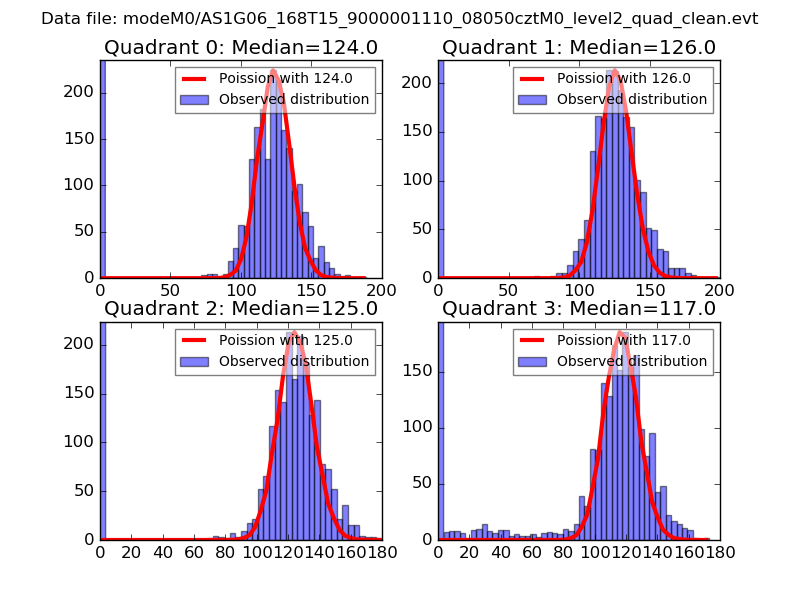 |
 |
| Quadrant-wise count rates Data is divided into 100 sec bins |
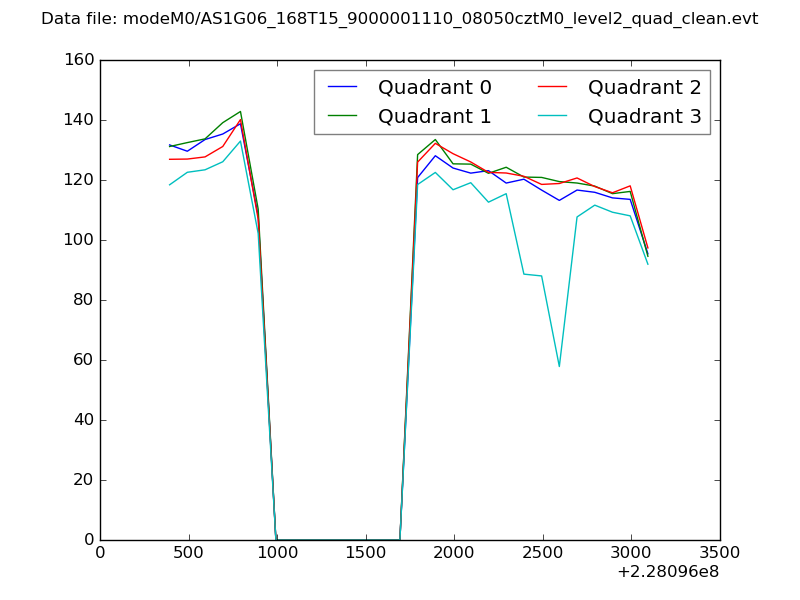 |
|
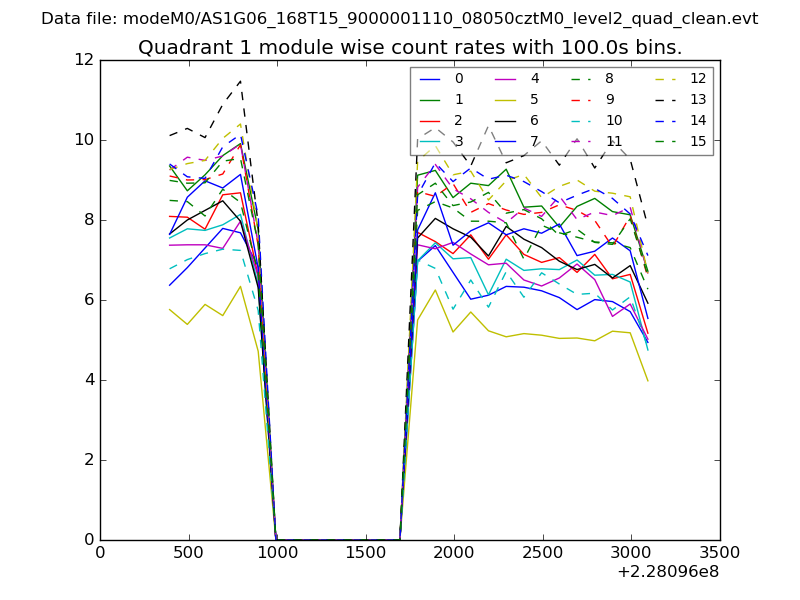
| Module-wise count rates for Quadrant A Data is divided into 100 sec bins |
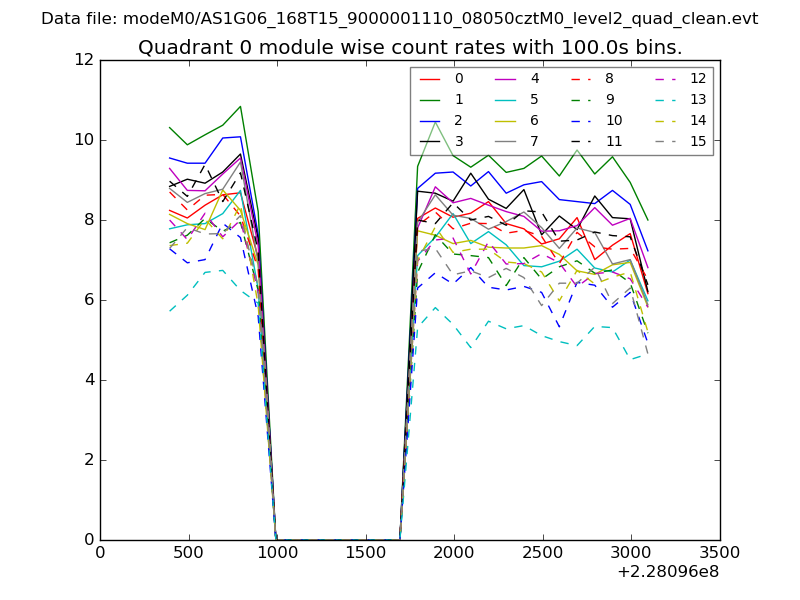 |
 |
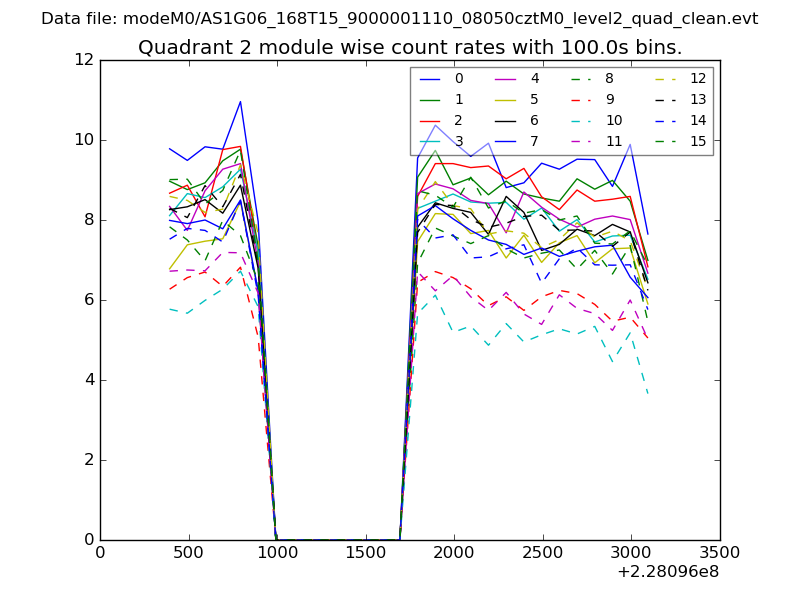
| Module-wise count rates for Quadrant B Data is divided into 100 sec bins |
 |
 |
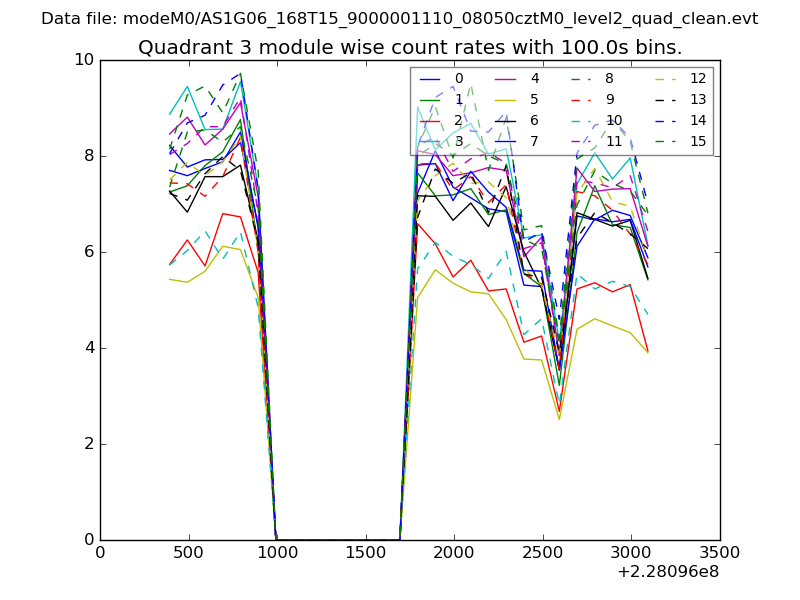
| Module-wise count rates for Quadrant C Data is divided into 100 sec bins |
 |
 |
| Module-wise count rates for Quadrant D Data is divided into 100 sec bins |
 |
 |
| Parameter | Plot |
|---|---|
| CZT HV Monitor | 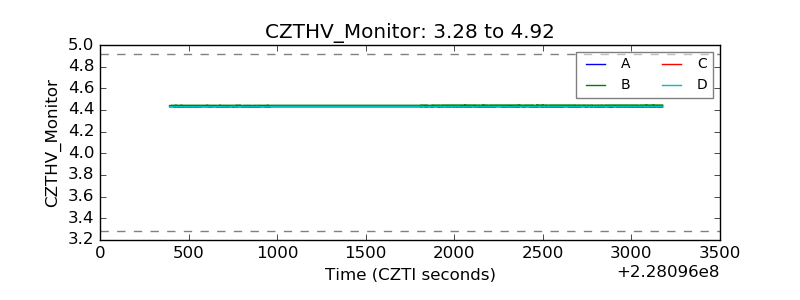 |
| D_VDD | 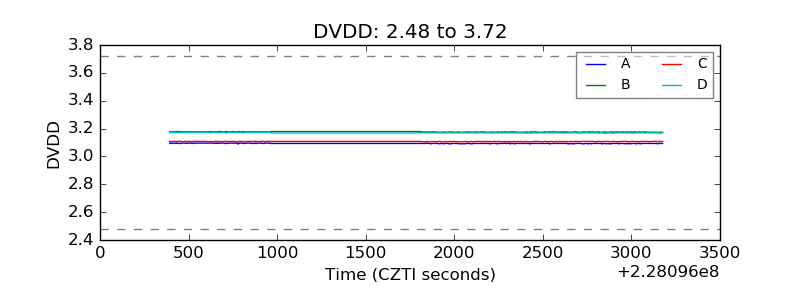 |
| Temperature 1 | 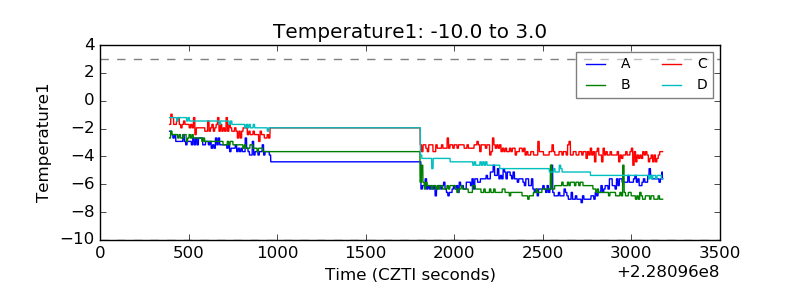 |
| Veto HV Monitor | 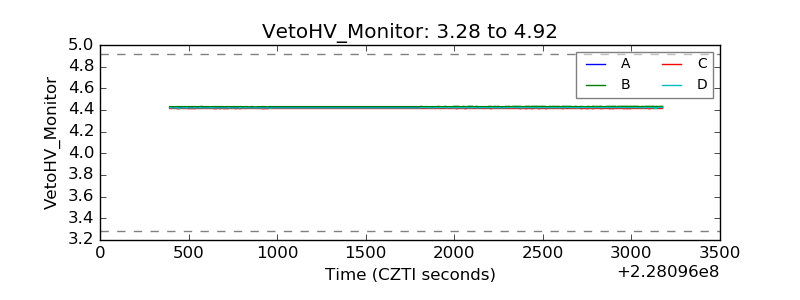 |
| Veto LLD | 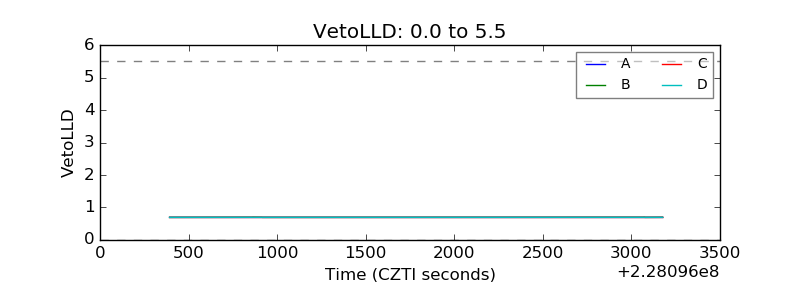 |
| Alpha Counter | 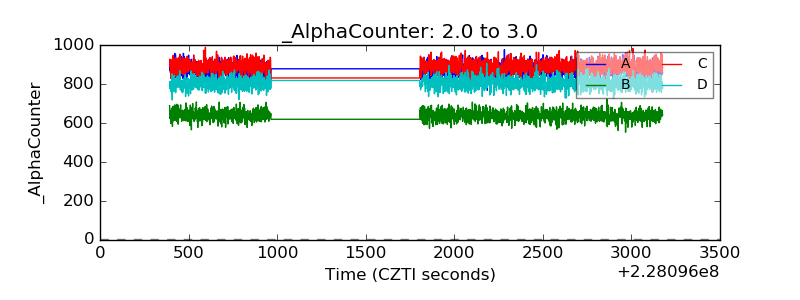 |
| _CPM_Rate |  |
| CZT Counter | 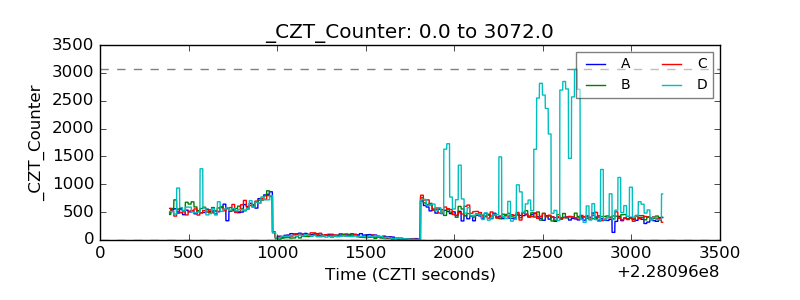 |
| +2.5 Volts monitor |  |
| +5 Volts monitor |  |
| _ROLL_ROT | 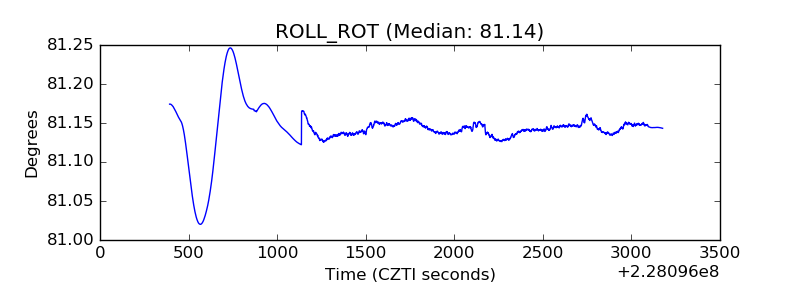 |
| _Roll_DEC | 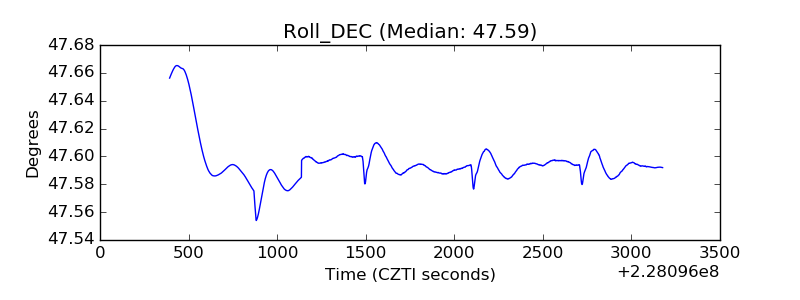 |
| _Roll_RA | 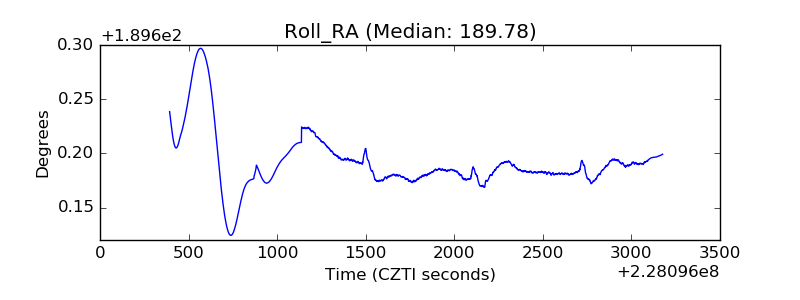 |
| Veto Counter | 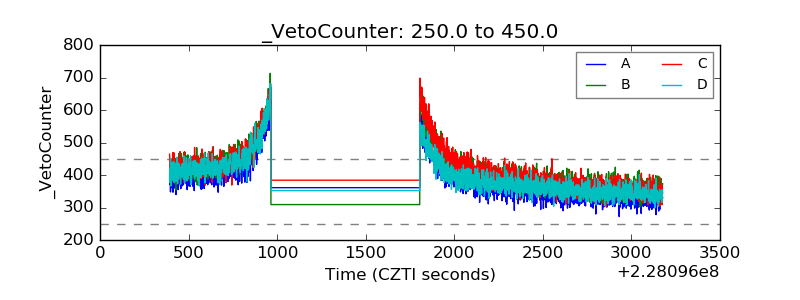 |