| Param | Original file | Final file |
|---|---|---|
| Filename | modeM0/AS1G06_028T01_9000001122_08154cztM0_level2.evt | modeM0/AS1G06_028T01_9000001122_08154cztM0_level2_quad_clean.evt |
| Size (bytes) | 96,744,960 | 10,203,840 |
| Size | 92.3 MB | 9.7 MB |
| Events in quadrant A | 663,265 | 55,156 |
| Events in quadrant B | 692,909 | 56,023 |
| Events in quadrant C | 688,384 | 56,236 |
| Events in quadrant D | 803,490 | 52,781 |
| Mode M0 | |||
|---|---|---|---|
| Quadrant | BADHDUFLAG | Total packets | Discarded packets |
| A | 0 | 2694 | 1 |
| B | 0 | 2766 | 1 |
| C | 0 | 2757 | 1 |
| D | 0 | 3172 | 1 |
| Mode SS | |||
|---|---|---|---|
| Quadrant | BADHDUFLAG | Total packets | Discarded packets |
| A | 0 | 26 | 0 |
| B | 0 | 26 | 0 |
| C | 0 | 26 | 0 |
| D | 0 | 26 | 0 |
| Mode M9 | |||
|---|---|---|---|
| Quadrant | BADHDUFLAG | Total packets | Discarded packets |
| A | 0 | 2 | 0 |
| B | 0 | 2 | 0 |
| C | 0 | 2 | 0 |
| D | 0 | 2 | 0 |
| Quadrant | Total seconds | Saturated seconds | Saturation percentage |
|---|---|---|---|
| A | 1160 | 49 | 4.224138% |
| B | 1160 | 69 | 5.948276% |
| C | 1160 | 44 | 3.793103% |
| D | 1160 | 32 | 2.758621% |
Noise dominated data is calculated using 1-second bins in cleaned event files. If a bin has >2000 counts, and if more than 50% of those come from <1% of pixels, then it is considered to be noise-dominated and hence unusable.
| Quadrant | # 1 sec bins | Bins with >0 counts | Bins with >2000 counts | High rate bins dominated by noise | Noise dominated (total time) | Noise dominated (detector-on time) | Marked lightcurve |
|---|---|---|---|---|---|---|---|
| A | 1355 | 1161 | 0 | 0 | 0.00% | 0.00% | 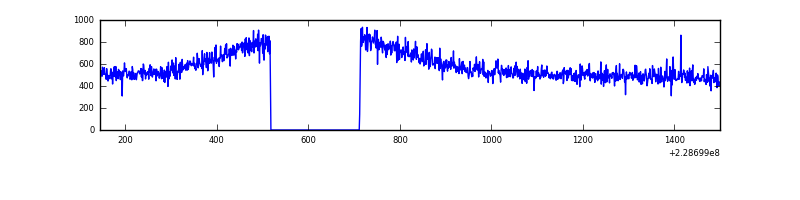 |
| B | 1355 | 1161 | 0 | 0 | 0.00% | 0.00% |  |
| C | 1355 | 1161 | 0 | 0 | 0.00% | 0.00% | 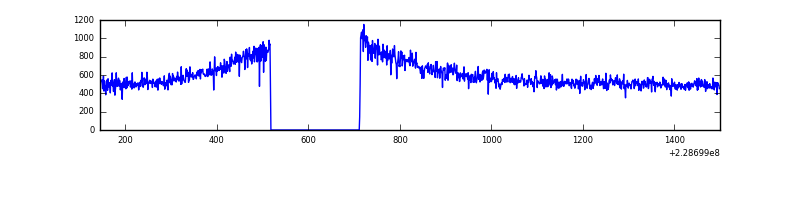 |
| D | 1355 | 1161 | 5 | 5 | 0.37% | 0.43% | 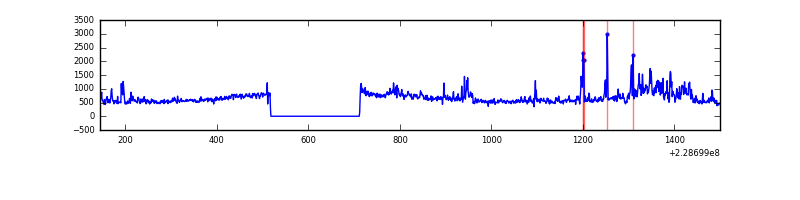 |
Top three noisy pixels from each quadrant. If the there are fewer than three noisy pixels in the level2.evt file, extra rows are filled as -1
| Pixel properties | Quadrant properties | ||||||
|---|---|---|---|---|---|---|---|
| Quadrant | DetID | PixID | Counts | Sigma | Mean | Median | Sigma |
| A | 13 | 254 | 1914 | 46.36 | 171 | 167 | 37.7 |
| A | 0 | 226 | 1653 | 39.44 | 171 | 167 | 37.7 |
| A | 12 | 194 | 1522 | 35.96 | 171 | 167 | 37.7 |
| B | 0 | 219 | 9701 | 263.87 | 174 | 170 | 36.1 |
| B | 0 | 184 | 3588 | 94.63 | 174 | 170 | 36.1 |
| B | 12 | 111 | 3082 | 80.62 | 174 | 170 | 36.1 |
| C | 1 | 16 | 29192 | 696.96 | 168 | 168 | 41.6 |
| C | 13 | 61 | 1332 | 27.95 | 168 | 168 | 41.6 |
| C | 7 | 159 | 584 | 9.99 | 168 | 168 | 41.6 |
| D | 2 | 152 | 62410 | 1415.34 | 167 | 161 | 44.0 |
| D | 13 | 29 | 61050 | 1384.42 | 167 | 161 | 44.0 |
| D | 2 | 136 | 21225 | 478.93 | 167 | 161 | 44.0 |
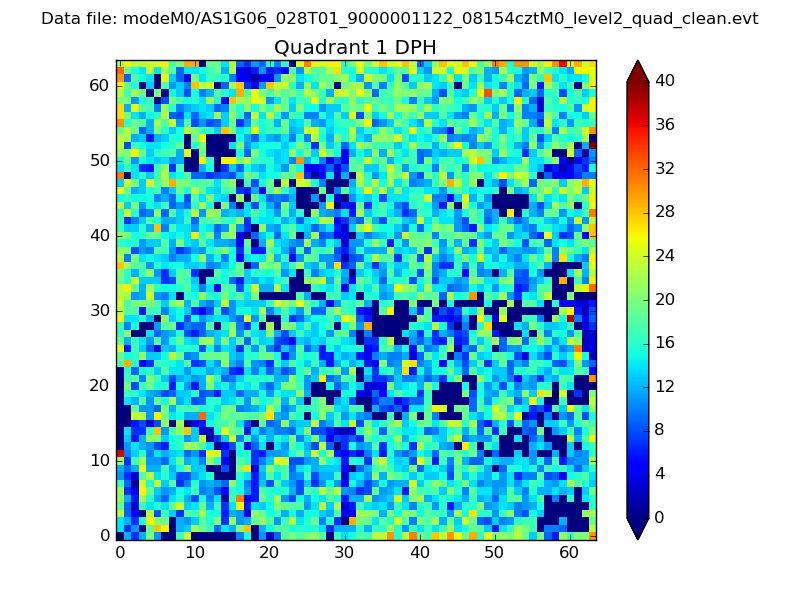
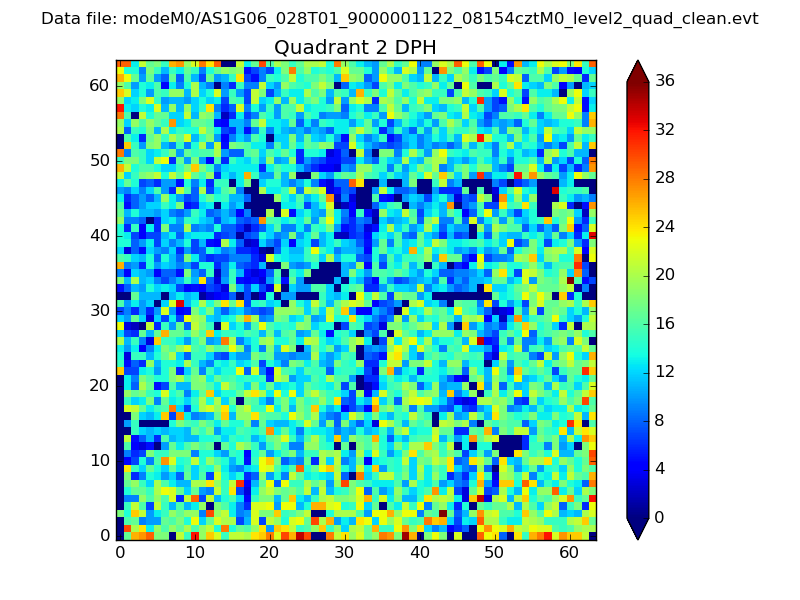
Histogram calculated using DETX and DETY for each event in the final _common_clean file
| Quadrant A | 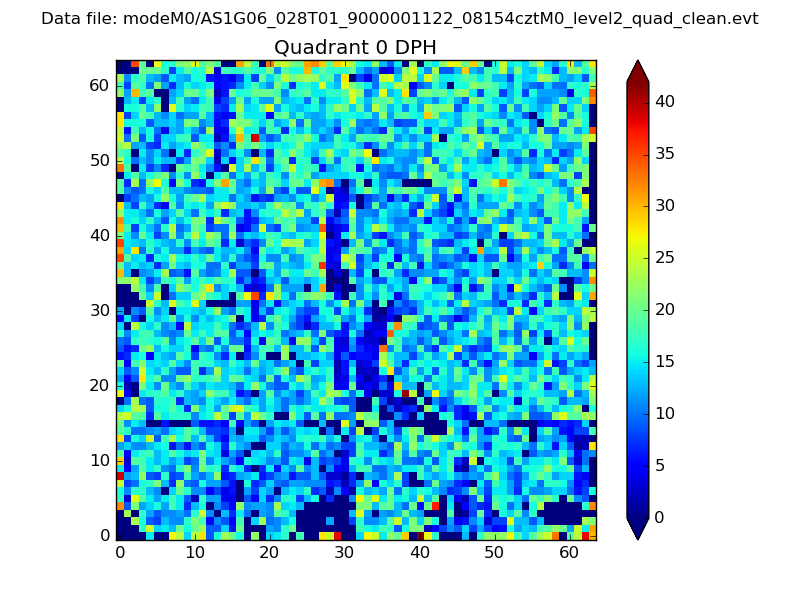 |
 |
Quadrant B |
|---|---|---|---|
| Quadrant D | 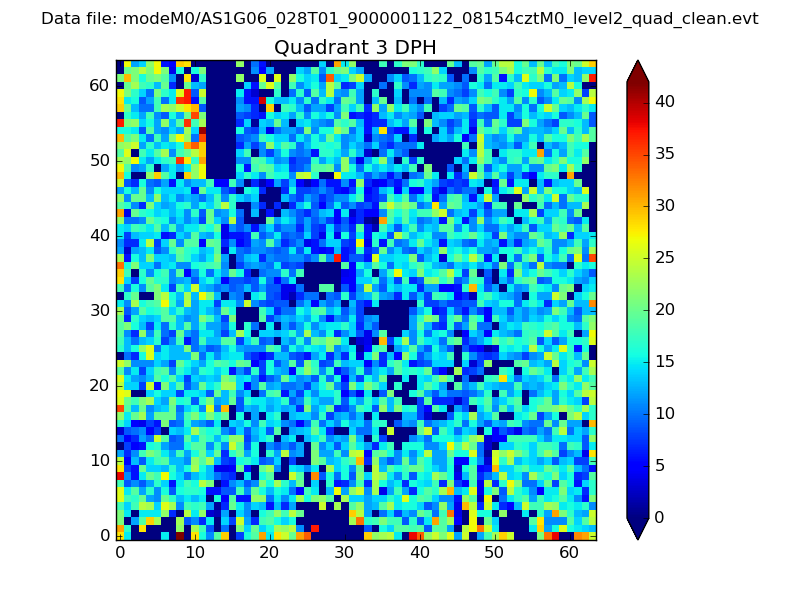 |
 |
Quadrant C |
| Plot type | Count rate plots | Images |
|---|---|---|
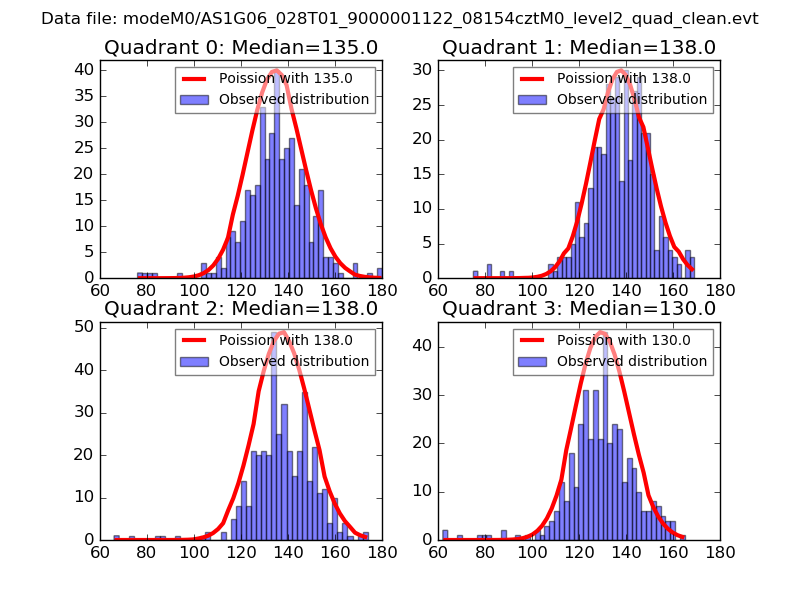
| Comparison with Poisson distribution Blue bars denote a histogram of data divided into 1 sec bins. Red curve is a Poisson curve with rate = median count rate of data. |
 |
 |
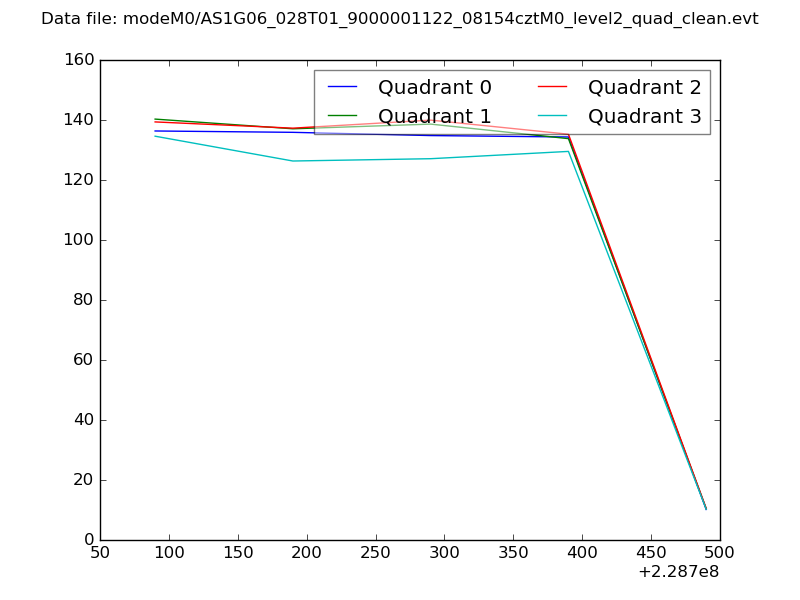
| Quadrant-wise count rates Data is divided into 100 sec bins |
 |
|
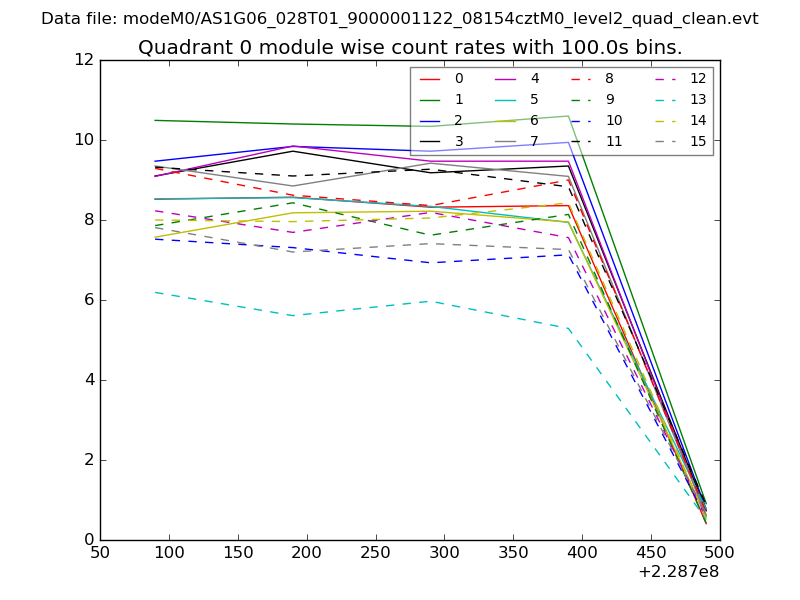
| Module-wise count rates for Quadrant A Data is divided into 100 sec bins |
 |
 |
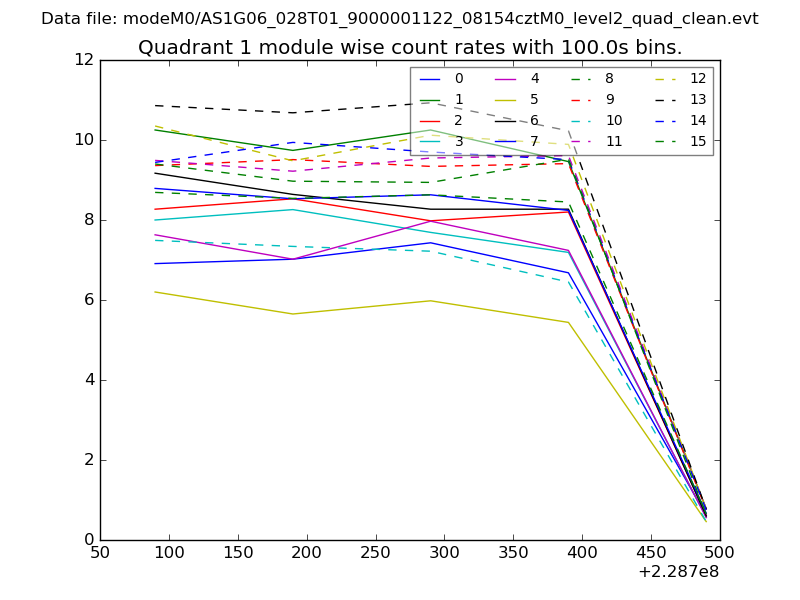
| Module-wise count rates for Quadrant B Data is divided into 100 sec bins |
 |
 |
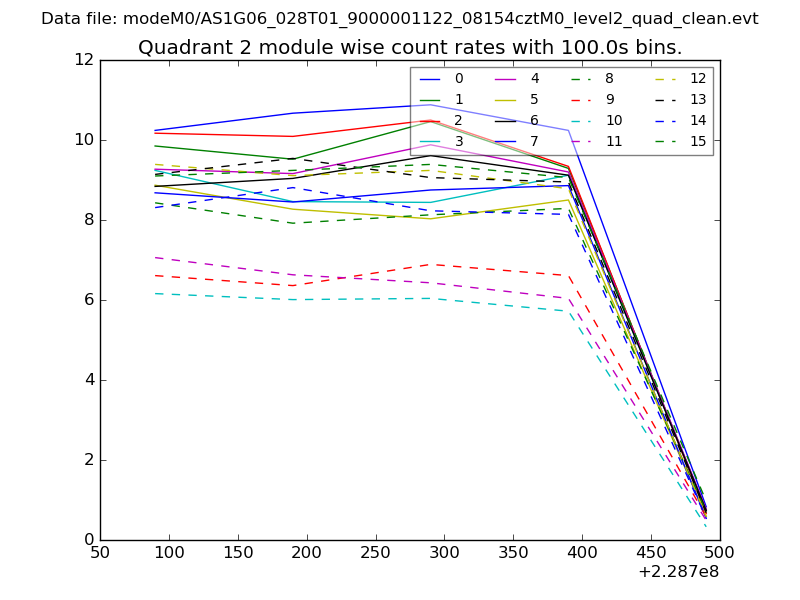
| Module-wise count rates for Quadrant C Data is divided into 100 sec bins |
 |
 |
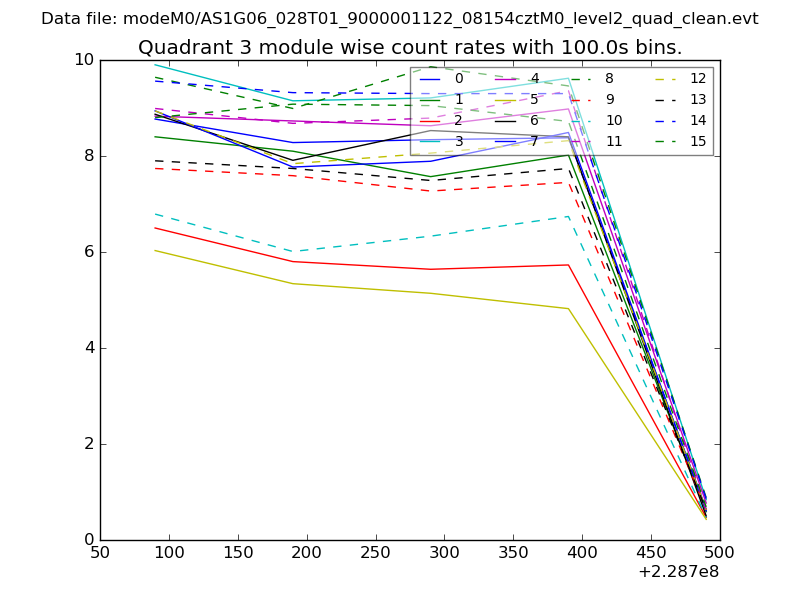
| Module-wise count rates for Quadrant D Data is divided into 100 sec bins |
 |
 |
| Parameter | Plot |
|---|---|
| CZT HV Monitor | 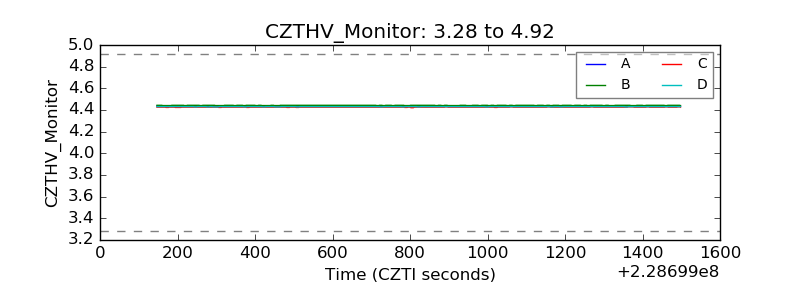 |
| D_VDD | 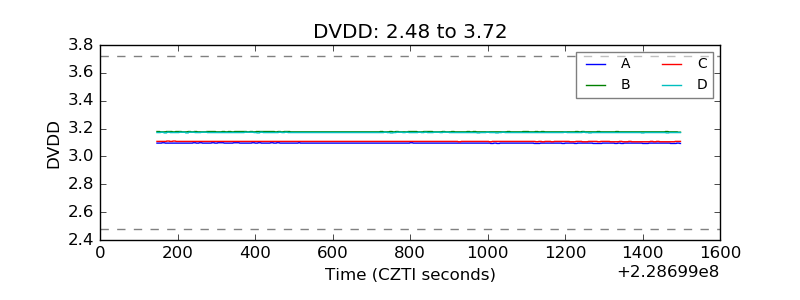 |
| Temperature 1 | 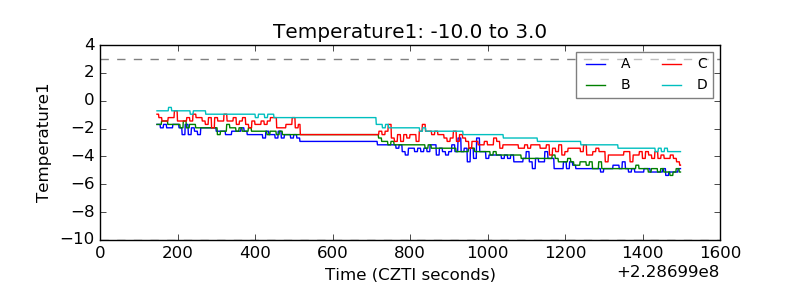 |
| Veto HV Monitor | 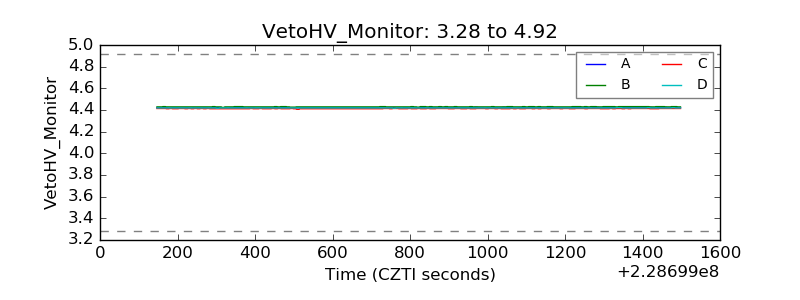 |
| Veto LLD | 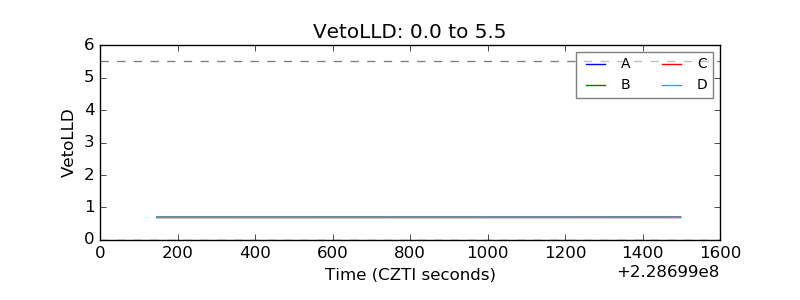 |
| Alpha Counter | 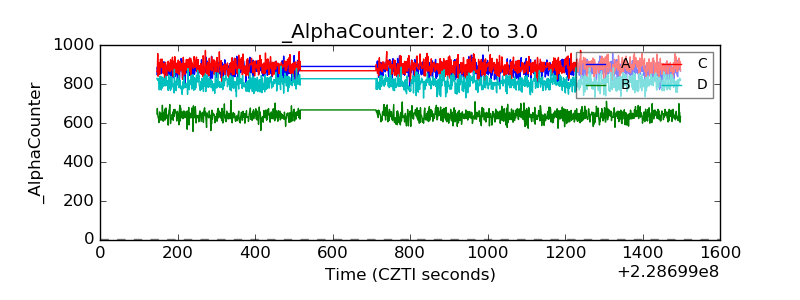 |
| _CPM_Rate | 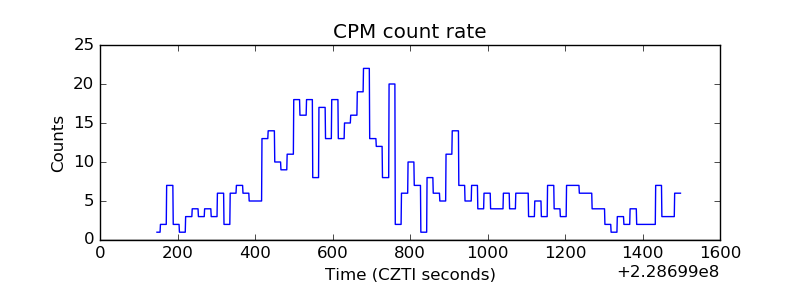 |
| CZT Counter | 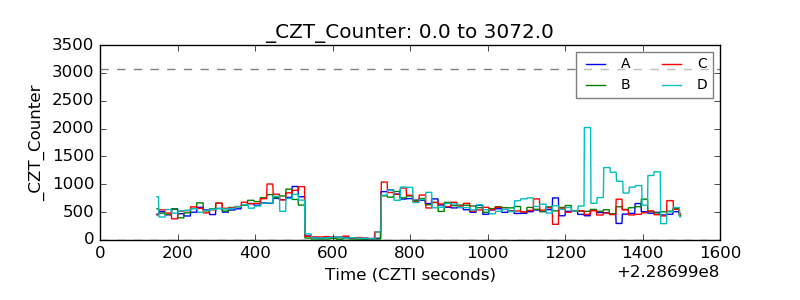 |
| +2.5 Volts monitor |  |
| +5 Volts monitor |  |
| _ROLL_ROT | 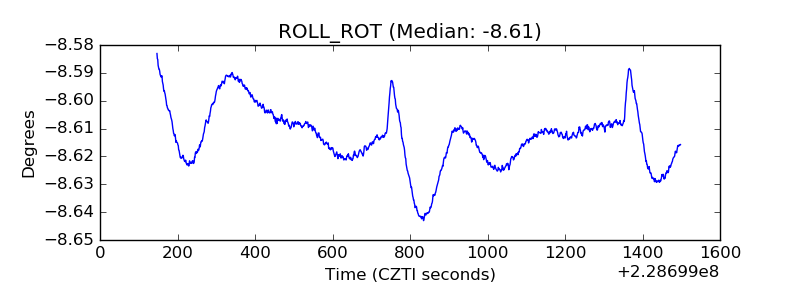 |
| _Roll_DEC | 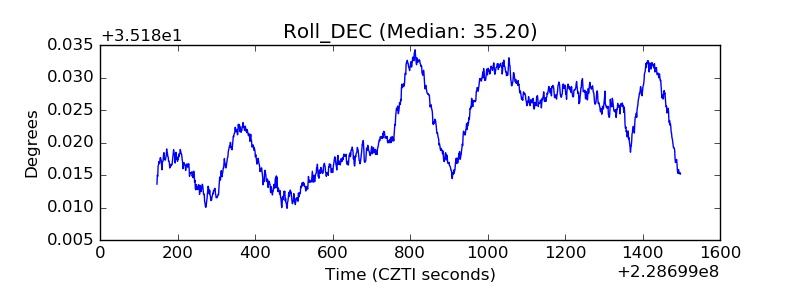 |
| _Roll_RA | 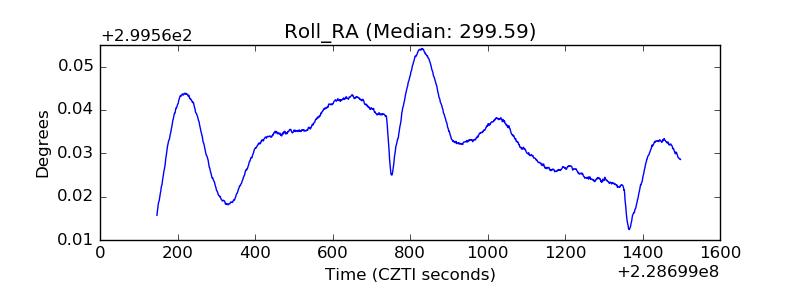 |
| Veto Counter | 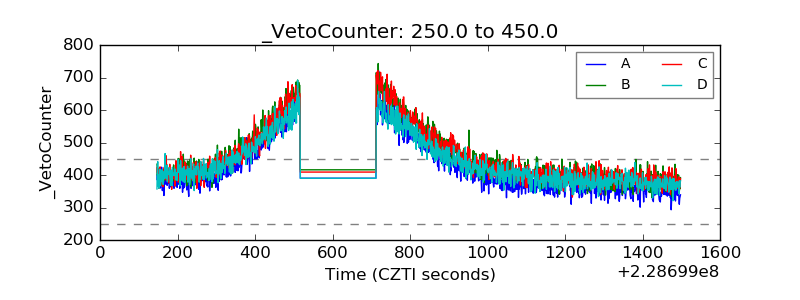 |