| Param | Original file | Final file |
|---|---|---|
| Filename | modeM0/AS1A03_114T01_9000001390_09744cztM0_level2.evt | modeM0/AS1A03_114T01_9000001390_09744cztM0_level2_quad_clean.evt |
| Size (bytes) | 461,039,040 | 74,799,360 |
| Size | 439.7 MB | 71.3 MB |
| Events in quadrant A | 3,355,156 | 444,564 |
| Events in quadrant B | 3,400,954 | 454,304 |
| Events in quadrant C | 3,305,727 | 443,189 |
| Events in quadrant D | 3,413,889 | 424,539 |
| Mode M0 | |||
|---|---|---|---|
| Quadrant | BADHDUFLAG | Total packets | Discarded packets |
| A | 0 | 14808 | 11 |
| B | 0 | 14823 | 12 |
| C | 0 | 14832 | 3 |
| D | 0 | 15270 | 17 |
| Mode SS | |||
|---|---|---|---|
| Quadrant | BADHDUFLAG | Total packets | Discarded packets |
| A | 0 | 150 | 0 |
| B | 0 | 150 | 0 |
| C | 0 | 150 | 0 |
| D | 0 | 150 | 0 |
| Mode M9 | |||
|---|---|---|---|
| Quadrant | BADHDUFLAG | Total packets | Discarded packets |
| A | 0 | 14 | 0 |
| B | 0 | 14 | 0 |
| C | 0 | 14 | 0 |
| D | 0 | 14 | 0 |
| Quadrant | Total seconds | Saturated seconds | Saturation percentage |
|---|---|---|---|
| A | 7151 | 176 | 2.461194% |
| B | 7150 | 188 | 2.629371% |
| C | 7154 | 145 | 2.026838% |
| D | 7151 | 169 | 2.363306% |
Noise dominated data is calculated using 1-second bins in cleaned event files. If a bin has >2000 counts, and if more than 50% of those come from <1% of pixels, then it is considered to be noise-dominated and hence unusable.
| Quadrant | # 1 sec bins | Bins with >0 counts | Bins with >2000 counts | High rate bins dominated by noise | Noise dominated (total time) | Noise dominated (detector-on time) | Marked lightcurve |
|---|---|---|---|---|---|---|---|
| A | 8510 | 7158 | 0 | 0 | 0.00% | 0.00% | 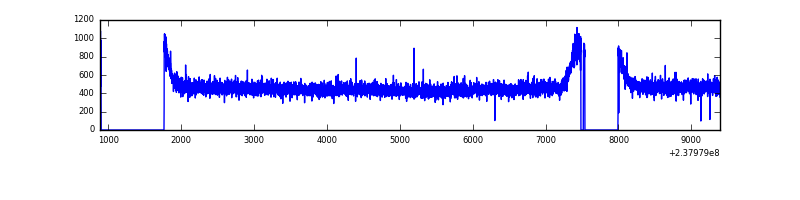 |
| B | 8510 | 7158 | 0 | 0 | 0.00% | 0.00% | 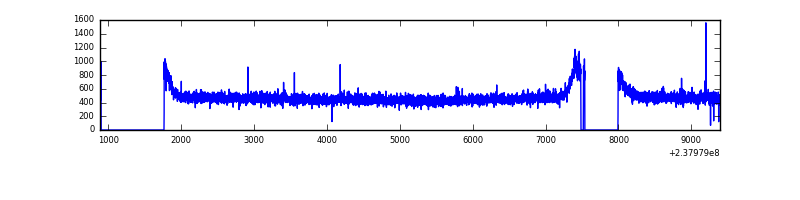 |
| C | 8510 | 7158 | 0 | 0 | 0.00% | 0.00% | 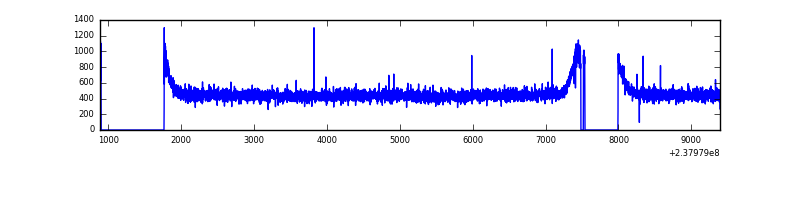 |
| D | 8510 | 7158 | 25 | 25 | 0.29% | 0.35% | 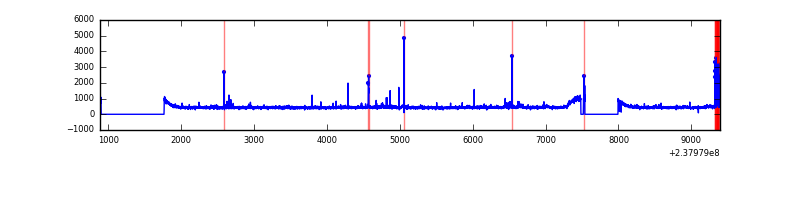 |
Top three noisy pixels from each quadrant. If the there are fewer than three noisy pixels in the level2.evt file, extra rows are filled as -1
| Pixel properties | Quadrant properties | ||||||
|---|---|---|---|---|---|---|---|
| Quadrant | DetID | PixID | Counts | Sigma | Mean | Median | Sigma |
| A | 0 | 226 | 8012 | 40.04 | 872 | 854 | 178.8 |
| A | 12 | 194 | 6959 | 34.15 | 872 | 854 | 178.8 |
| A | 13 | 253 | 4822 | 22.2 | 872 | 854 | 178.8 |
| B | 12 | 111 | 20510 | 115.7 | 872 | 849 | 169.9 |
| B | 11 | 111 | 16926 | 94.61 | 872 | 849 | 169.9 |
| B | 14 | 111 | 13735 | 75.83 | 872 | 849 | 169.9 |
| C | 13 | 61 | 6168 | 26.81 | 845 | 849 | 198.4 |
| C | 8 | 222 | 5238 | 22.12 | 845 | 849 | 198.4 |
| C | 9 | 237 | 5156 | 21.71 | 845 | 849 | 198.4 |
| D | 1 | 52 | 114500 | 521.25 | 834 | 814 | 218.1 |
| D | 13 | 137 | 67012 | 303.52 | 834 | 814 | 218.1 |
| D | 10 | 199 | 23351 | 103.33 | 834 | 814 | 218.1 |
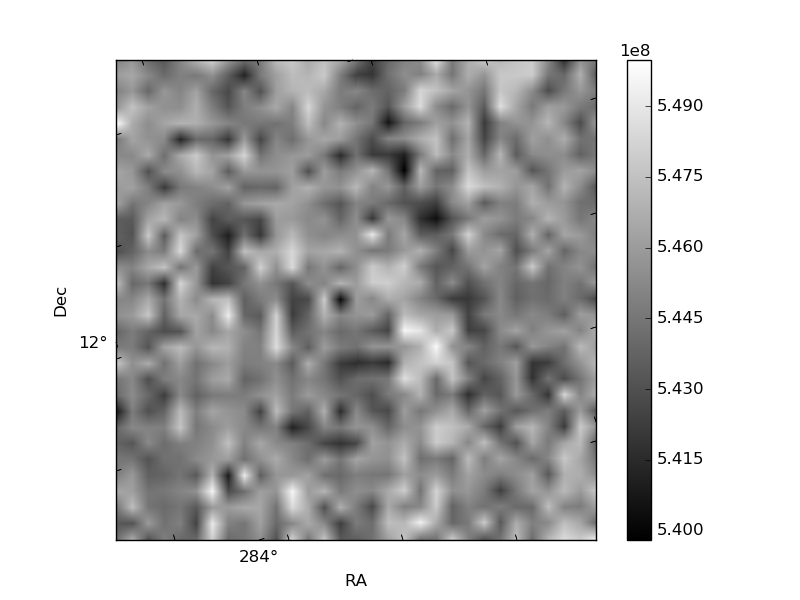
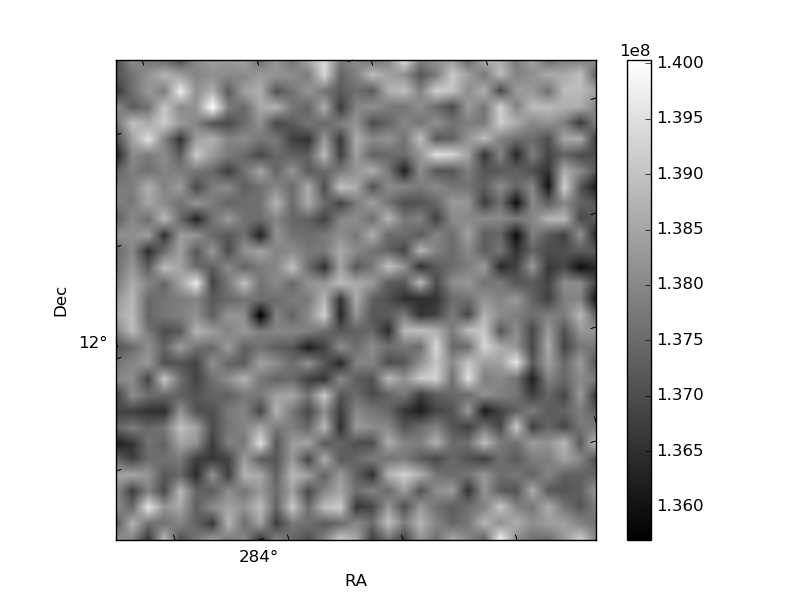
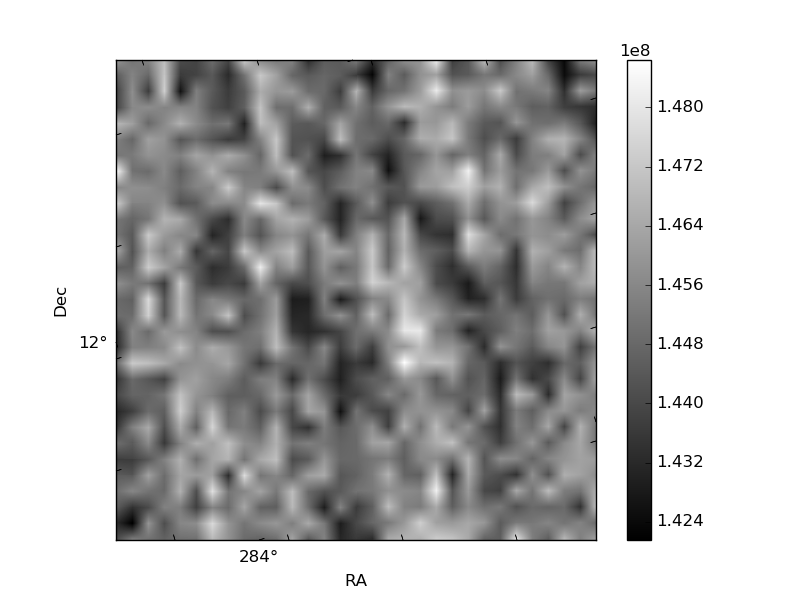
Histogram calculated using DETX and DETY for each event in the final _common_clean file
| Quadrant A | 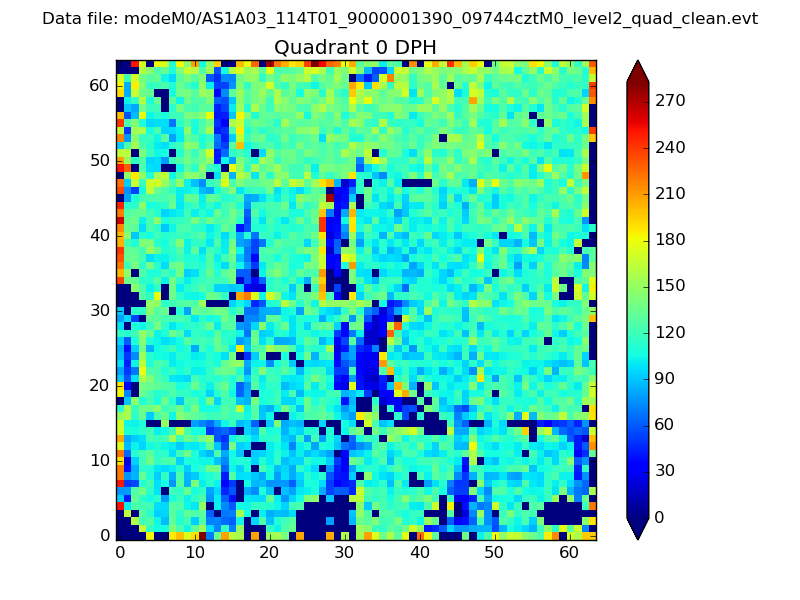 |
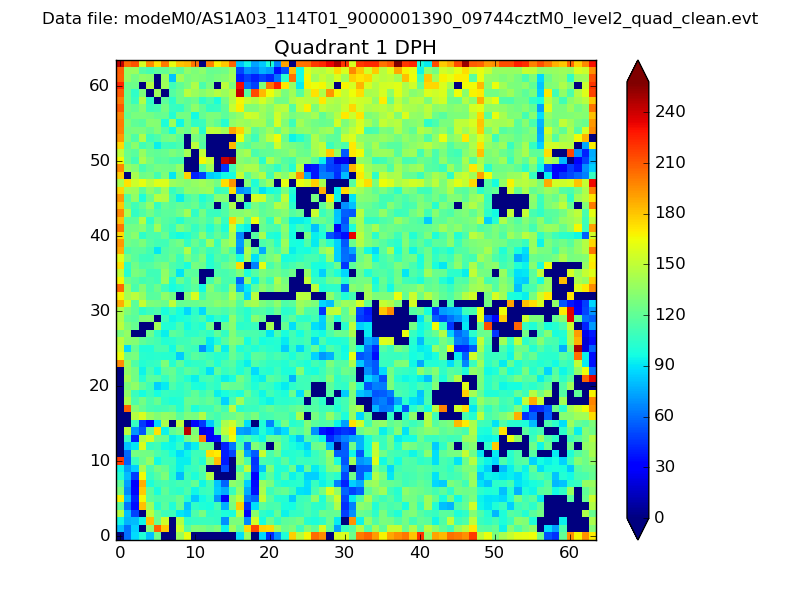 |
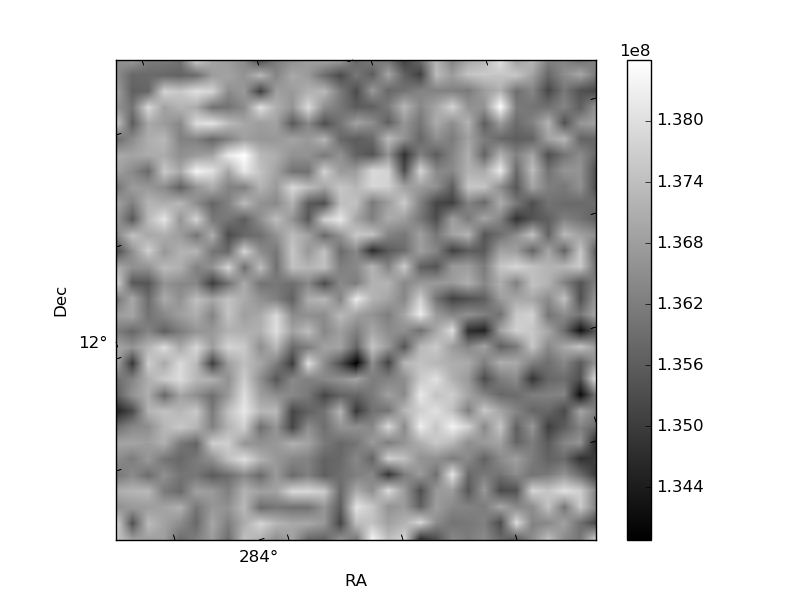
Quadrant B |
|---|---|---|---|
| Quadrant D | 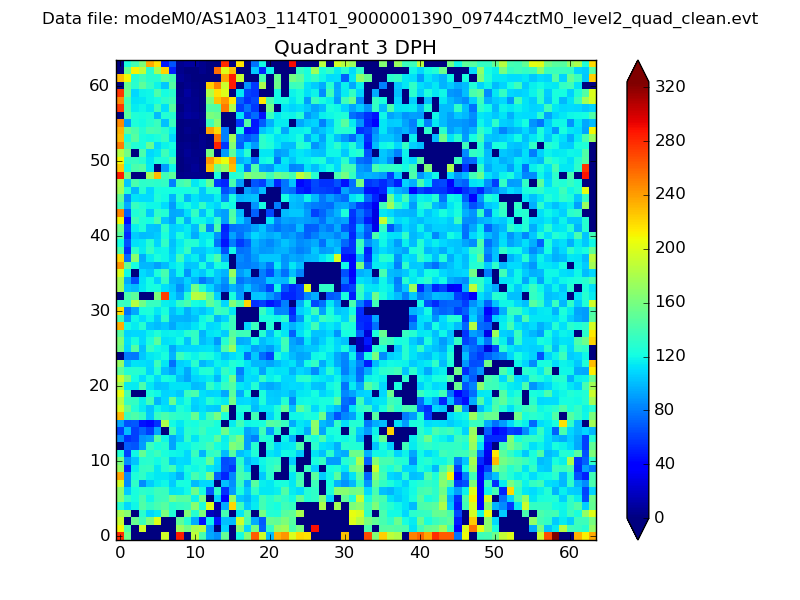 |
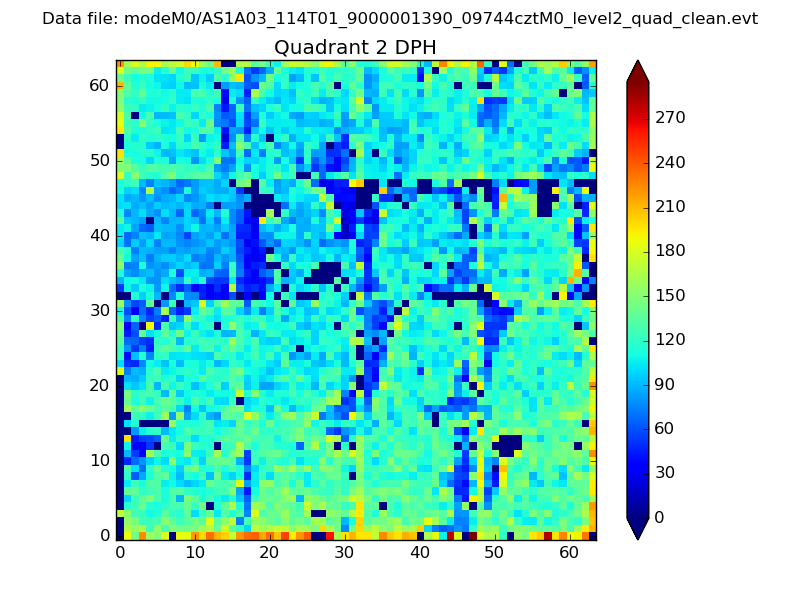 |
Quadrant C |
| Plot type | Count rate plots | Images |
|---|---|---|
| Comparison with Poisson distribution Blue bars denote a histogram of data divided into 1 sec bins. Red curve is a Poisson curve with rate = median count rate of data. |
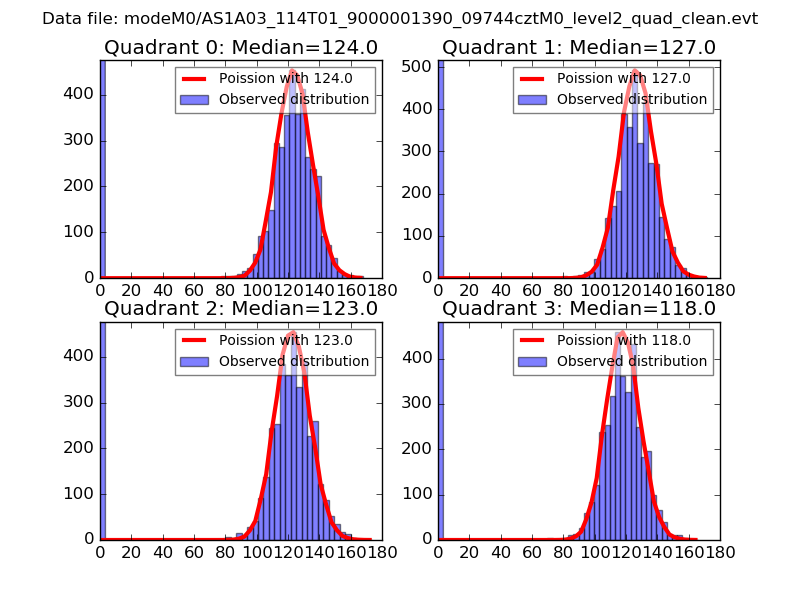 |
 |
| Quadrant-wise count rates Data is divided into 100 sec bins |
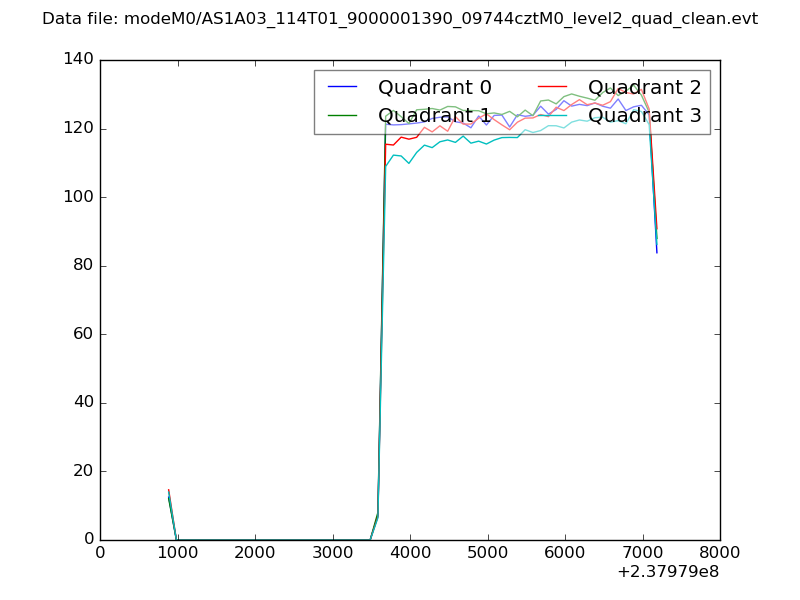 |
|
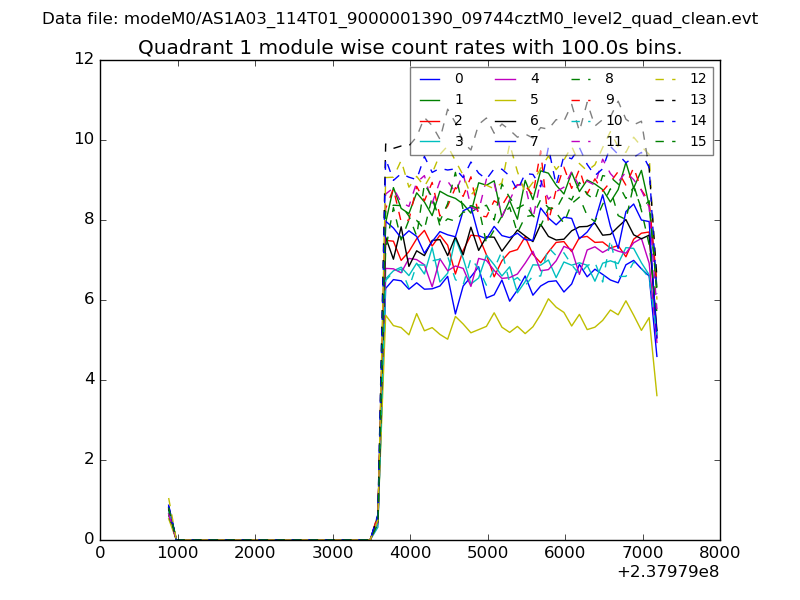
| Module-wise count rates for Quadrant A Data is divided into 100 sec bins |
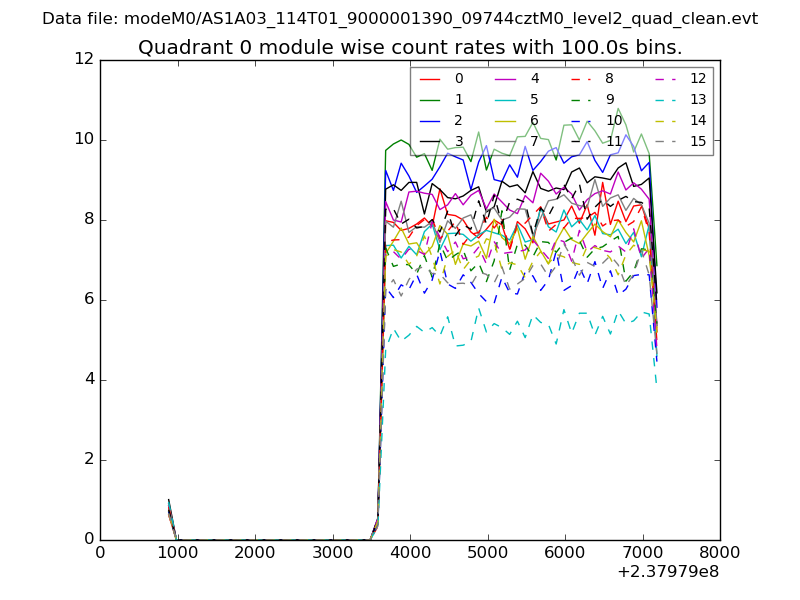 |
 |
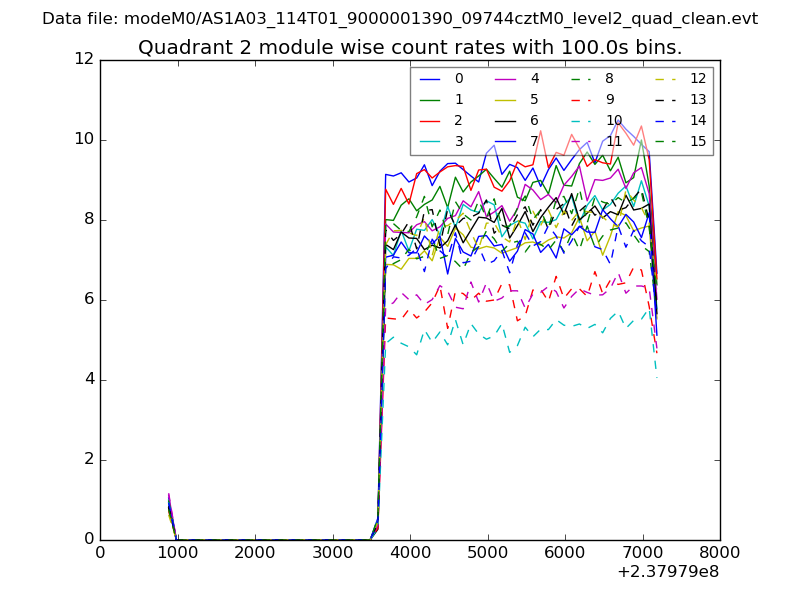
| Module-wise count rates for Quadrant B Data is divided into 100 sec bins |
 |
 |
| Module-wise count rates for Quadrant C Data is divided into 100 sec bins |
 |
 |
| Module-wise count rates for Quadrant D Data is divided into 100 sec bins |
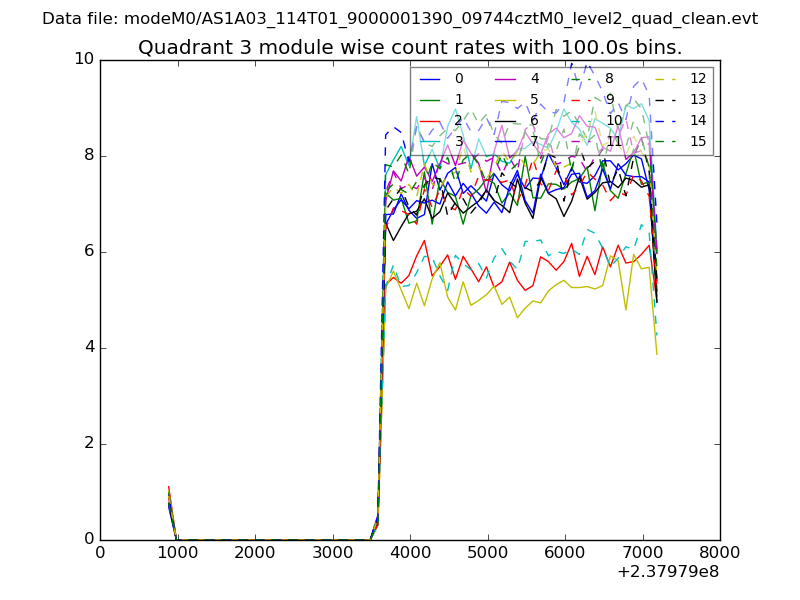 |
 |
| Parameter | Plot |
|---|---|
| CZT HV Monitor | 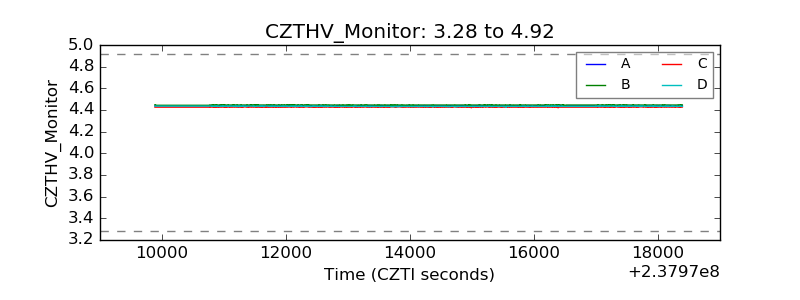 |
| D_VDD | 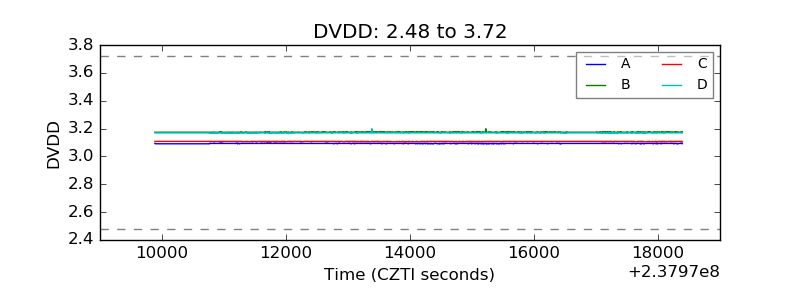 |
| Temperature 1 | 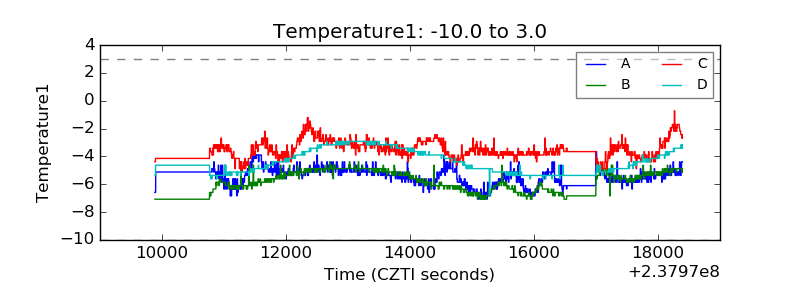 |
| Veto HV Monitor |  |
| Veto LLD | 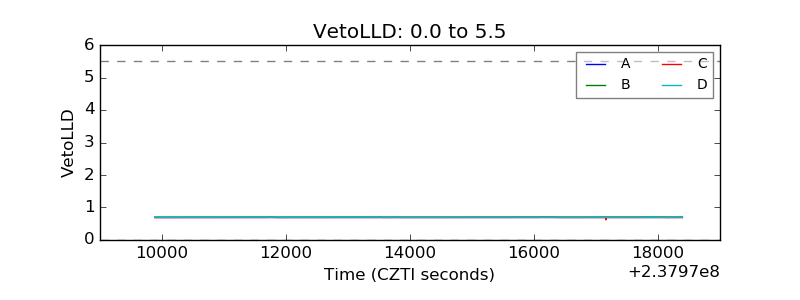 |
| Alpha Counter | 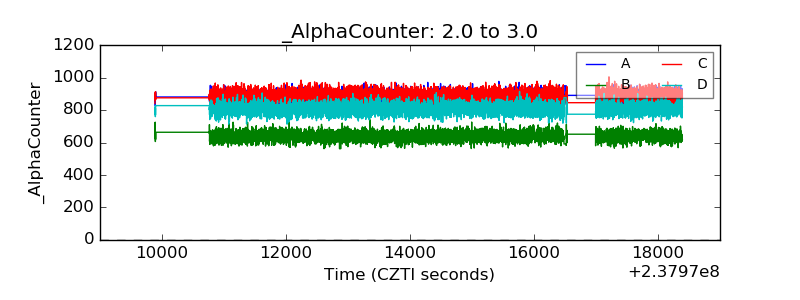 |
| _CPM_Rate | 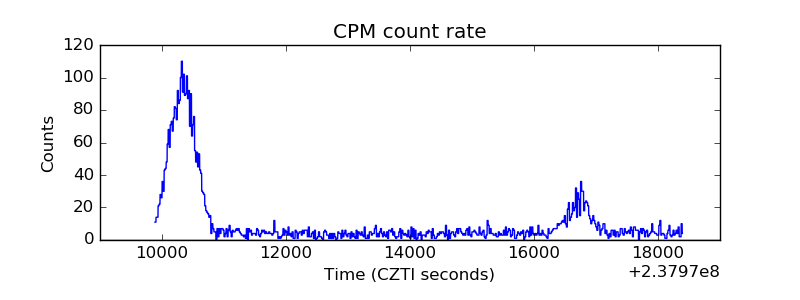 |
| CZT Counter | 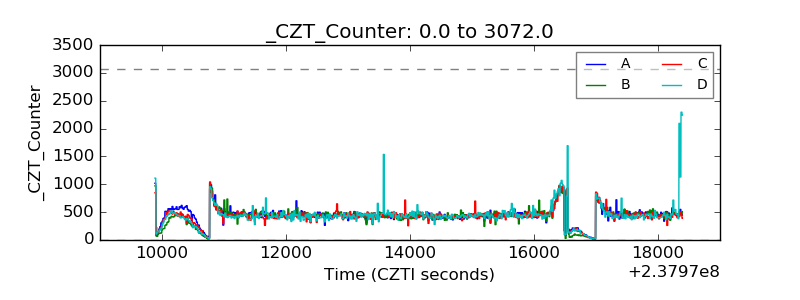 |
| +2.5 Volts monitor |  |
| +5 Volts monitor |  |
| _ROLL_ROT | 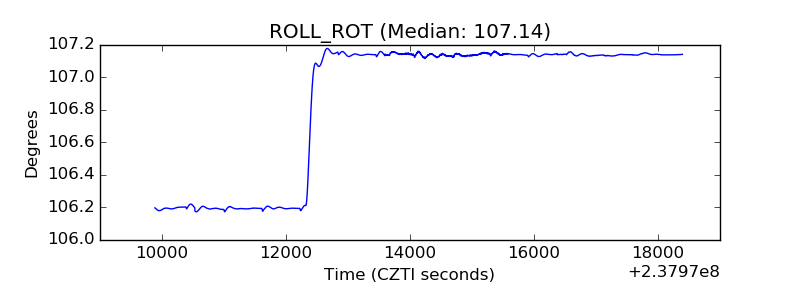 |
| _Roll_DEC | 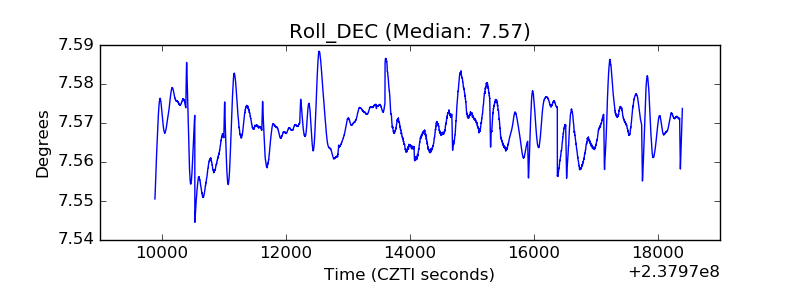 |
| _Roll_RA | 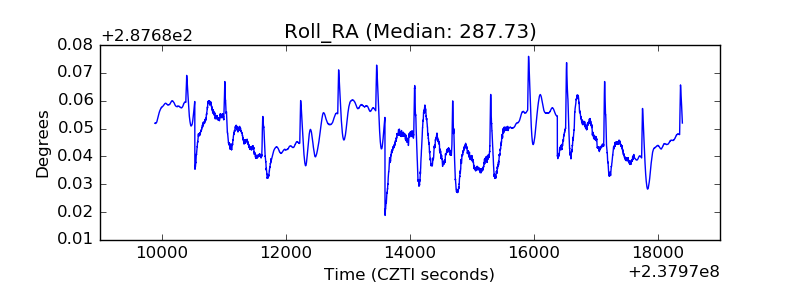 |
| Veto Counter | 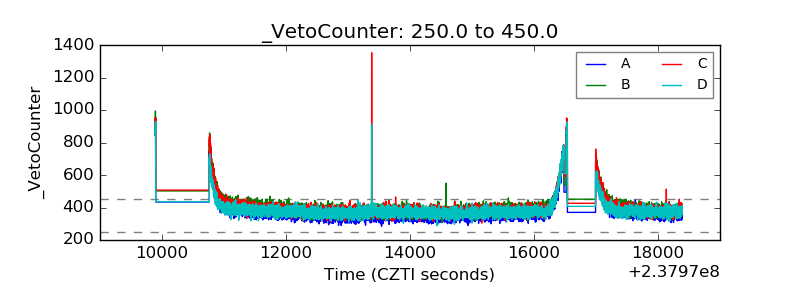 |