| Param | Original file | Final file |
|---|---|---|
| Filename | modeM0/AS1A03_052T01_9000001436_10048cztM0_level2.evt | modeM0/AS1A03_052T01_9000001436_10048cztM0_level2_quad_clean.evt |
| Size (bytes) | 416,868,480 | 70,738,560 |
| Size | 397.6 MB | 67.5 MB |
| Events in quadrant A | 2,665,586 | 470,184 |
| Events in quadrant B | 2,989,395 | 454,272 |
| Events in quadrant C | 2,484,193 | 459,893 |
| Events in quadrant D | 4,116,319 | 378,566 |
| Mode SS | |||
|---|---|---|---|
| Quadrant | BADHDUFLAG | Total packets | Discarded packets |
| A | 0 | 154 | 42 |
| B | 0 | 154 | 28 |
| C | 0 | 152 | 44 |
| D | 0 | 154 | 44 |
| Mode M9 | |||
|---|---|---|---|
| Quadrant | BADHDUFLAG | Total packets | Discarded packets |
| A | 0 | 17 | 3 |
| B | 0 | 17 | 3 |
| C | 0 | 17 | 4 |
| D | 0 | 17 | 4 |
| Mode M0 | |||
|---|---|---|---|
| Quadrant | BADHDUFLAG | Total packets | Discarded packets |
| A | 0 | 15937 | 4351 |
| B | 0 | 18174 | 5796 |
| C | 0 | 15432 | 4115 |
| D | 0 | 25865 | 10260 |
| Quadrant | Total seconds | Saturated seconds | Saturation percentage |
|---|---|---|---|
| A | 5557 | 14 | 0.251934% |
| B | 5367 | 67 | 1.248370% |
| C | 5585 | 8 | 0.143241% |
| D | 5019 | 601 | 11.974497% |
Noise dominated data is calculated using 1-second bins in cleaned event files. If a bin has >2000 counts, and if more than 50% of those come from <1% of pixels, then it is considered to be noise-dominated and hence unusable.
| Quadrant | # 1 sec bins | Bins with >0 counts | Bins with >2000 counts | High rate bins dominated by noise | Noise dominated (total time) | Noise dominated (detector-on time) | Marked lightcurve |
|---|---|---|---|---|---|---|---|
| A | 9255 | 6750 | 0 | 0 | 0.00% | 0.00% |  |
| B | 9255 | 6574 | 23 | 23 | 0.25% | 0.35% | 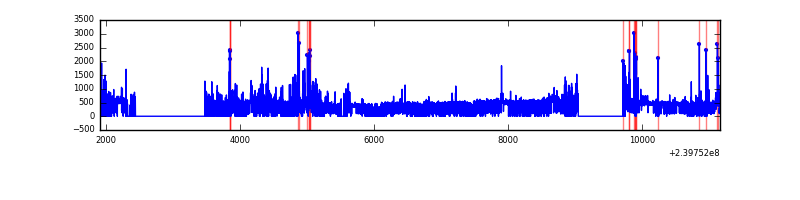 |
| C | 9255 | 6752 | 0 | 0 | 0.00% | 0.00% | 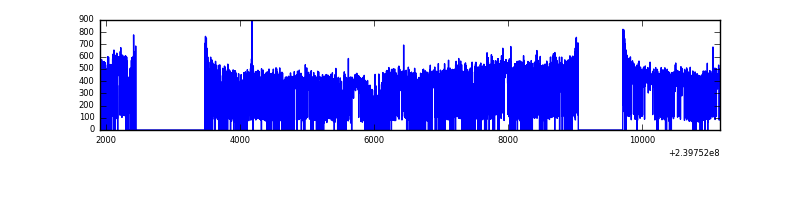 |
| D | 9255 | 6161 | 574 | 574 | 6.20% | 9.32% | 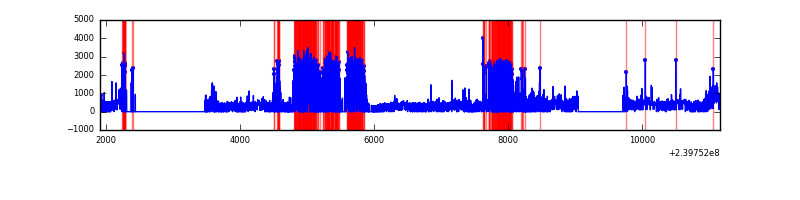 |
Top three noisy pixels from each quadrant. If the there are fewer than three noisy pixels in the level2.evt file, extra rows are filled as -1
| Pixel properties | Quadrant properties | ||||||
|---|---|---|---|---|---|---|---|
| Quadrant | DetID | PixID | Counts | Sigma | Mean | Median | Sigma |
| A | 8 | 15 | 120066 | 881.69 | 654 | 639 | 135.5 |
| A | 15 | 239 | 18783 | 133.95 | 654 | 639 | 135.5 |
| A | 0 | 226 | 5881 | 38.7 | 654 | 639 | 135.5 |
| B | 4 | 81 | 353579 | 2854.7 | 634 | 617 | 123.6 |
| B | 4 | 239 | 73223 | 587.23 | 634 | 617 | 123.6 |
| B | 10 | 247 | 43493 | 346.77 | 634 | 617 | 123.6 |
| C | 14 | 67 | 5179 | 30.55 | 634 | 637 | 148.7 |
| C | 13 | 61 | 4961 | 29.08 | 634 | 637 | 148.7 |
| C | 8 | 222 | 3562 | 19.67 | 634 | 637 | 148.7 |
| D | 1 | 20 | 1706147 | 11605.74 | 538 | 524 | 147.0 |
| D | 1 | 52 | 132838 | 900.32 | 538 | 524 | 147.0 |
| D | 7 | 71 | 49641 | 334.21 | 538 | 524 | 147.0 |
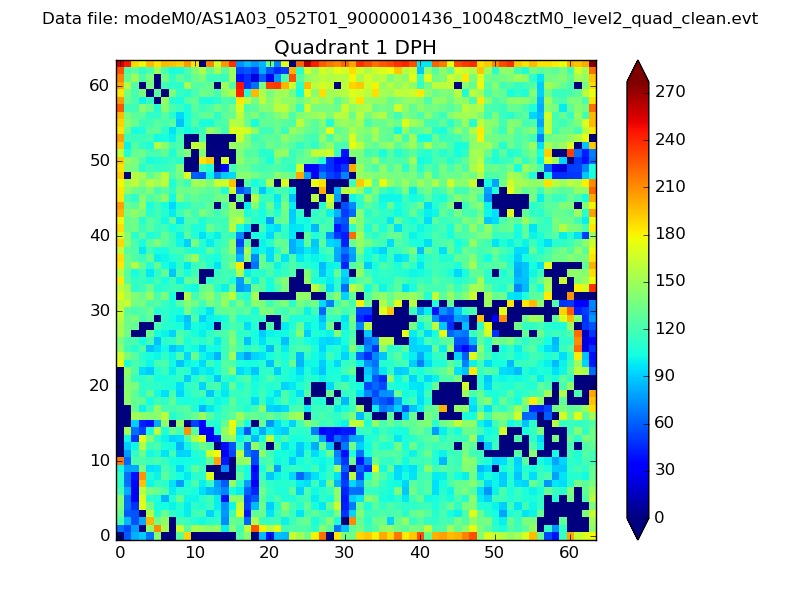
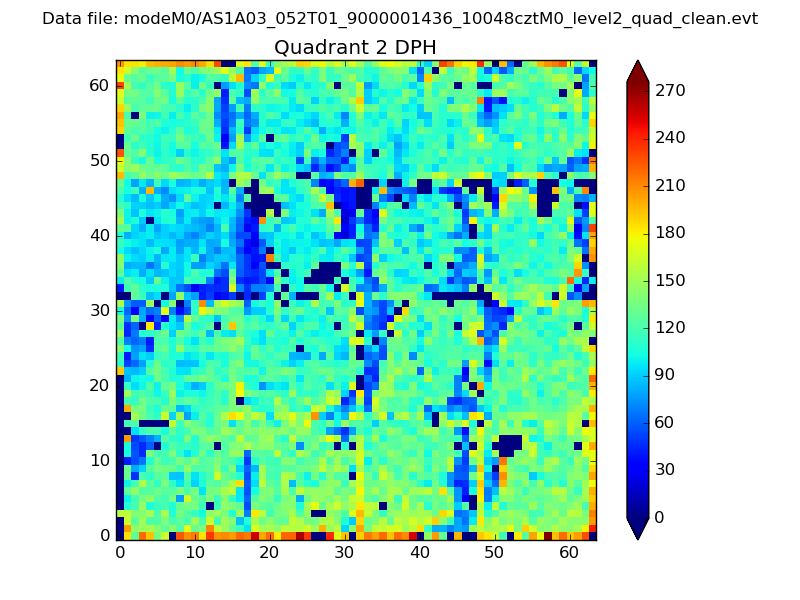
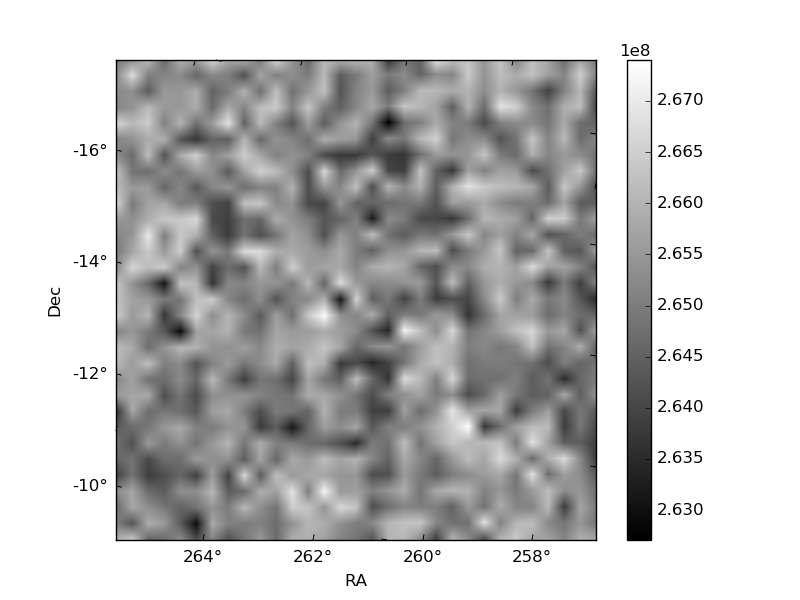
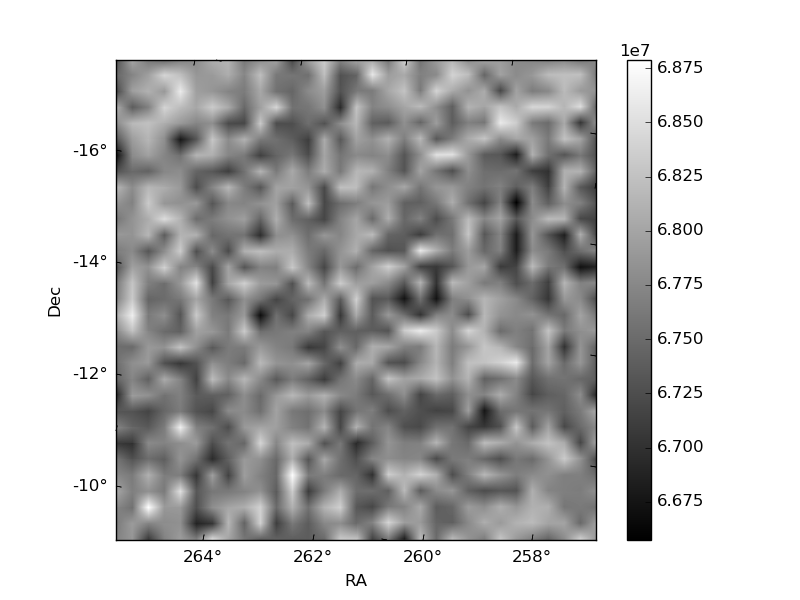
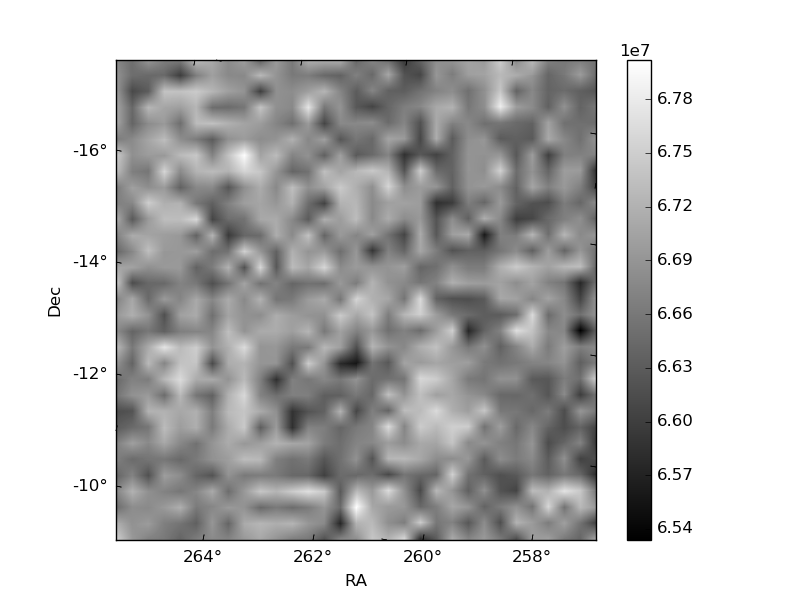
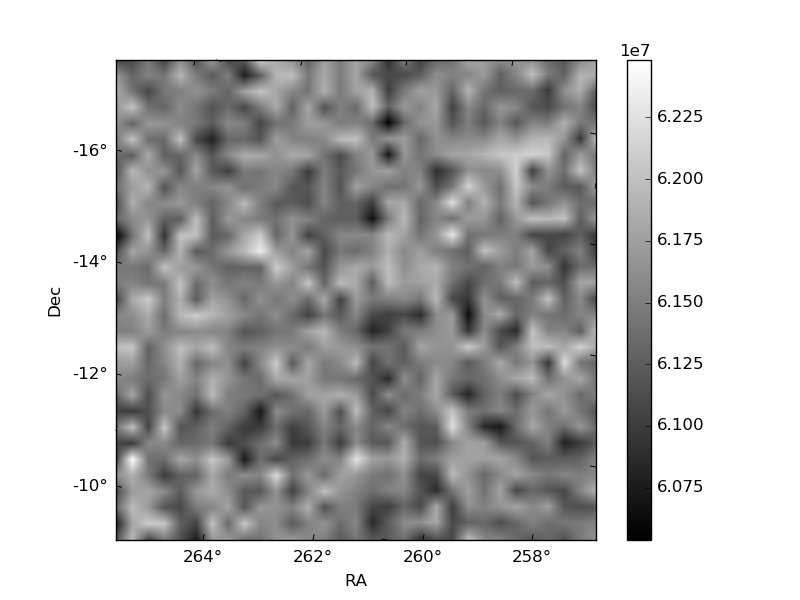
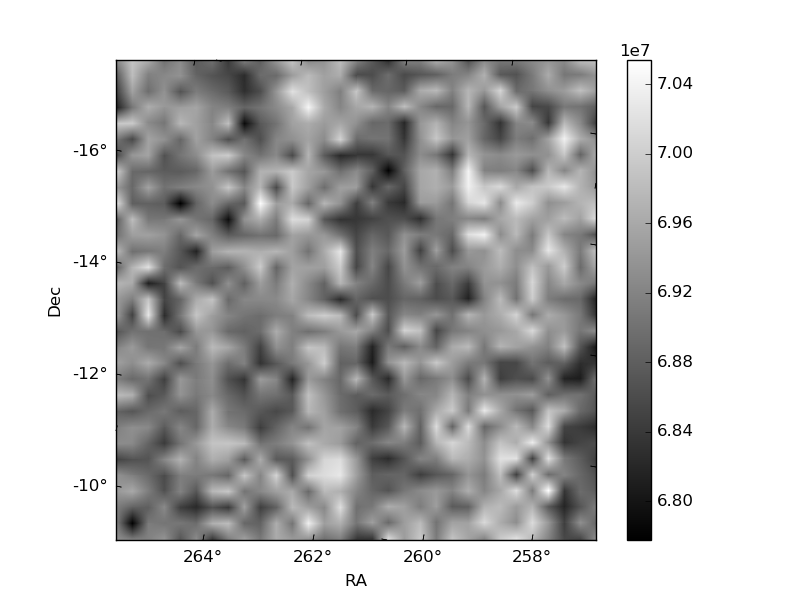
Histogram calculated using DETX and DETY for each event in the final _common_clean file
| Quadrant A | 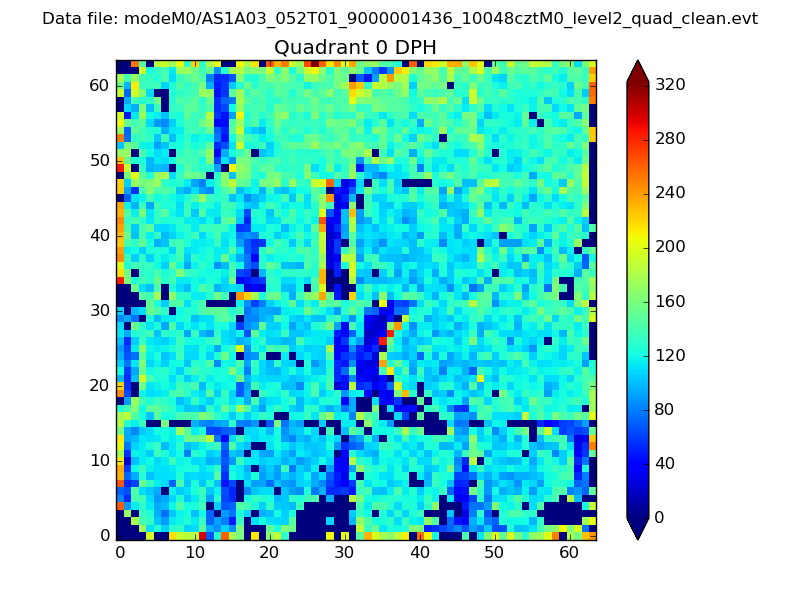 |
 |
Quadrant B |
|---|---|---|---|
| Quadrant D | 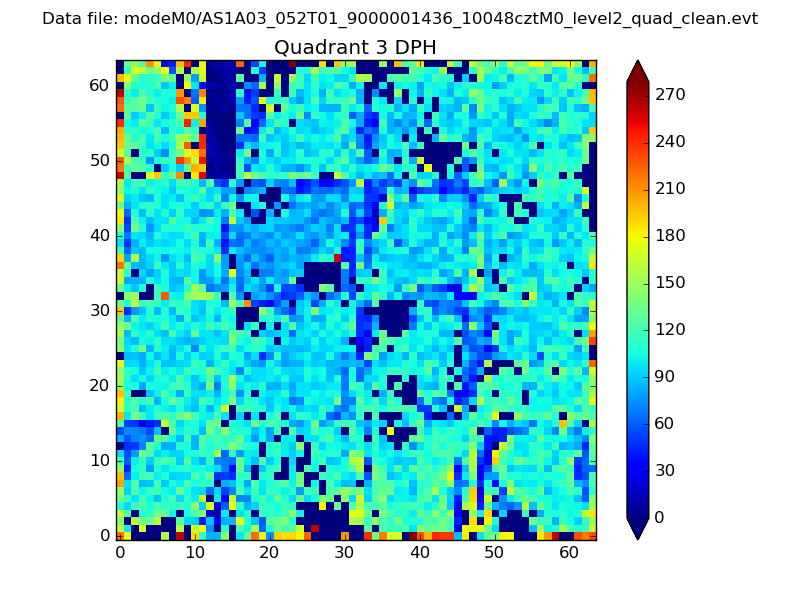 |
 |
Quadrant C |
| Plot type | Count rate plots | Images |
|---|---|---|
| Comparison with Poisson distribution Blue bars denote a histogram of data divided into 1 sec bins. Red curve is a Poisson curve with rate = median count rate of data. |
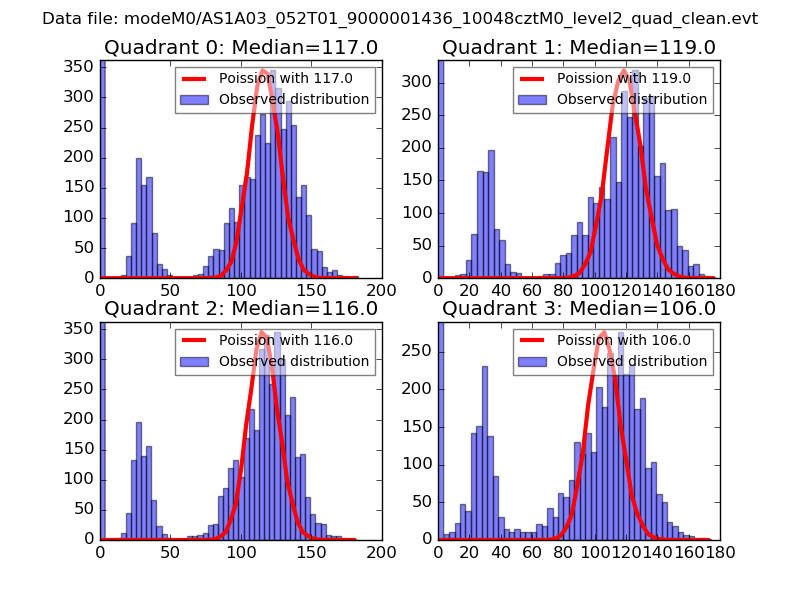 |
 |
| Quadrant-wise count rates Data is divided into 100 sec bins |
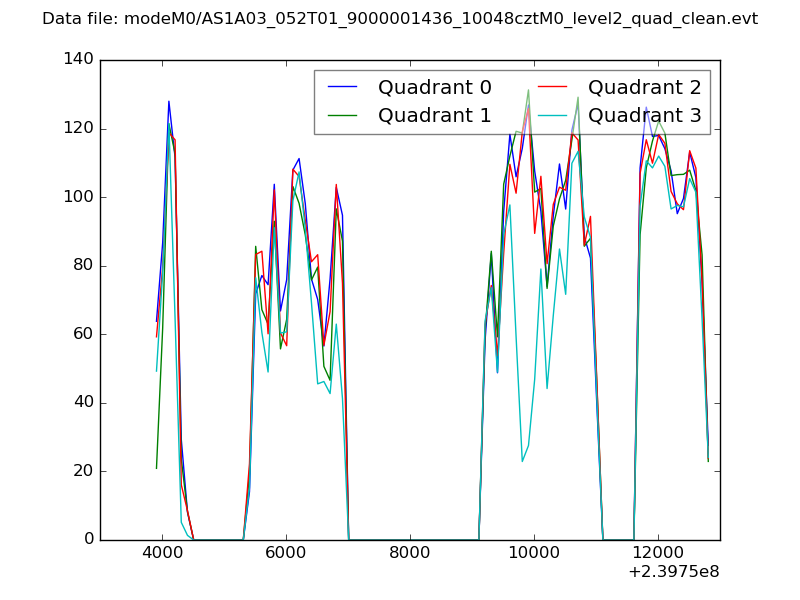 |
|
| Module-wise count rates for Quadrant A Data is divided into 100 sec bins |
 |
 |
| Module-wise count rates for Quadrant B Data is divided into 100 sec bins |
 |
 |
| Module-wise count rates for Quadrant C Data is divided into 100 sec bins |
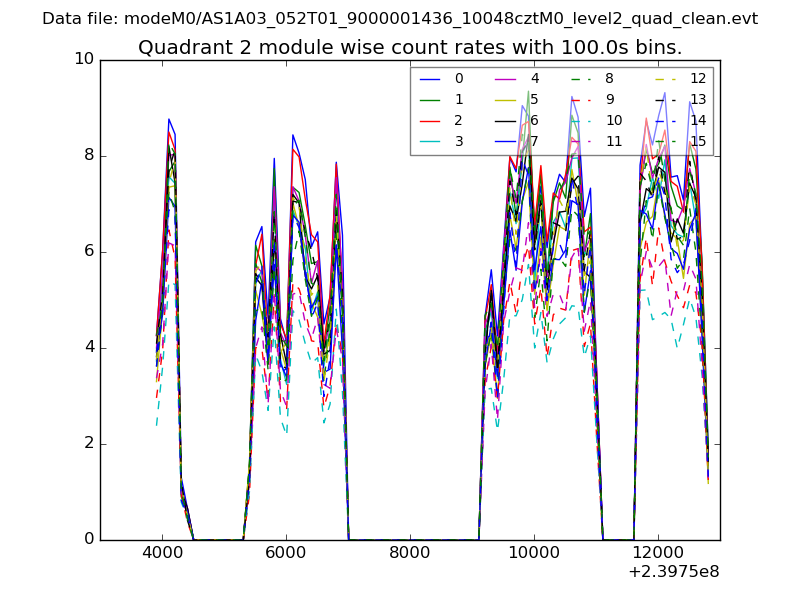 |
 |
| Module-wise count rates for Quadrant D Data is divided into 100 sec bins |
 |
 |
| Parameter | Plot |
|---|---|
| CZT HV Monitor | 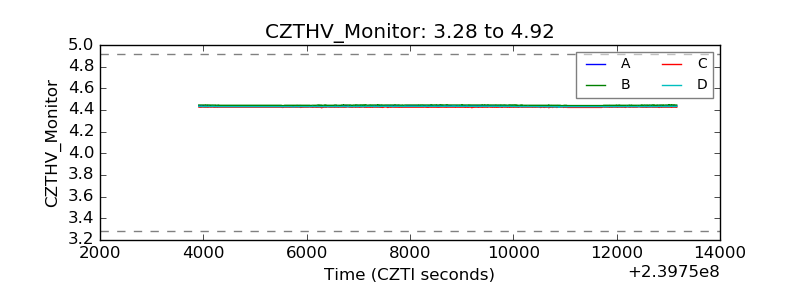 |
| D_VDD |  |
| Temperature 1 | 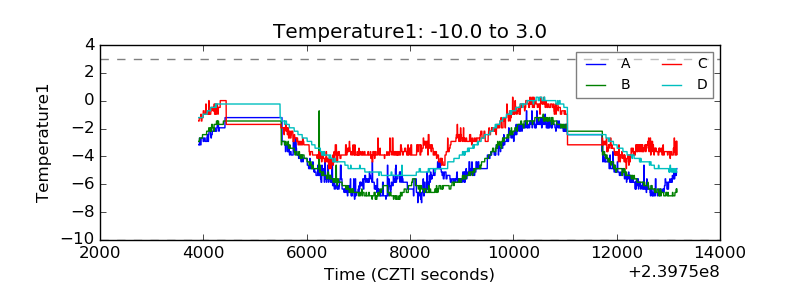 |
| Veto HV Monitor | 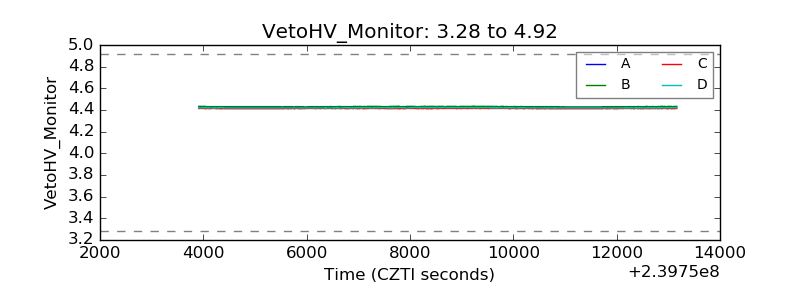 |
| Veto LLD |  |
| Alpha Counter | 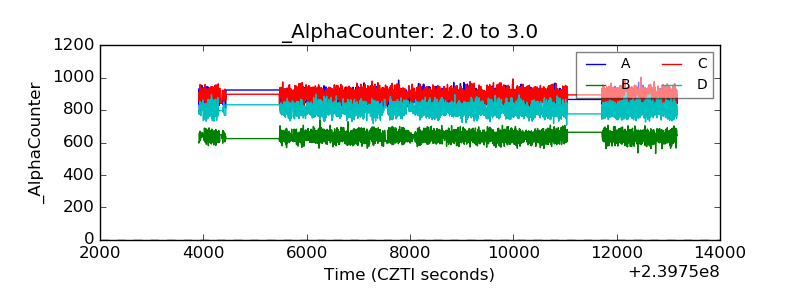 |
| _CPM_Rate | 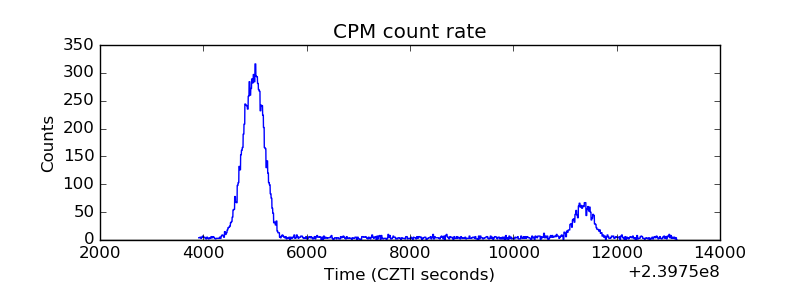 |
| CZT Counter | 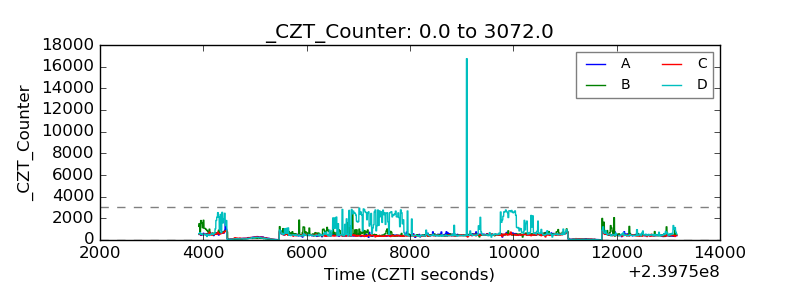 |
| +2.5 Volts monitor |  |
| +5 Volts monitor |  |
| _ROLL_ROT | 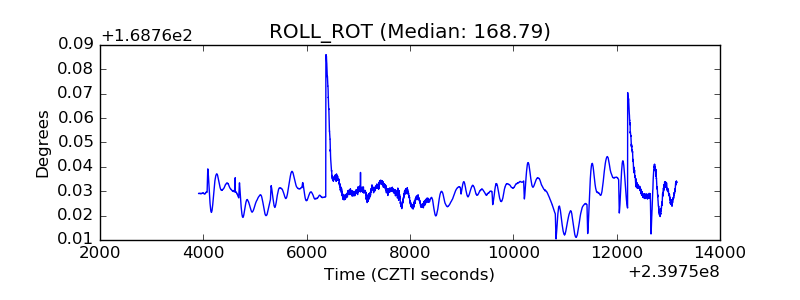 |
| _Roll_DEC | 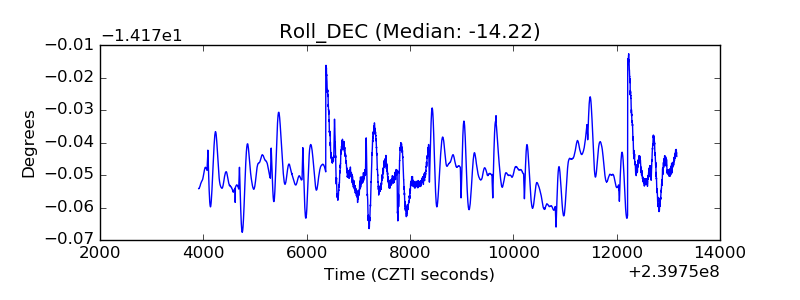 |
| _Roll_RA | 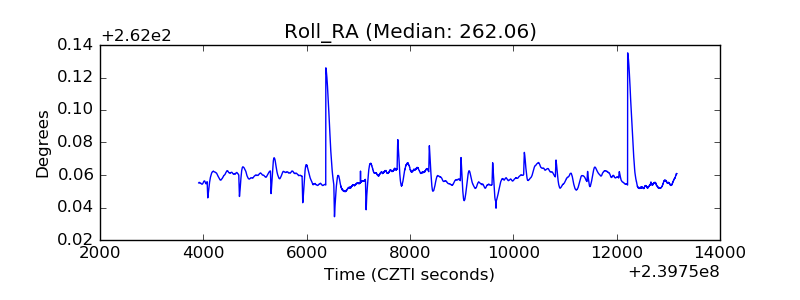 |
| Veto Counter | 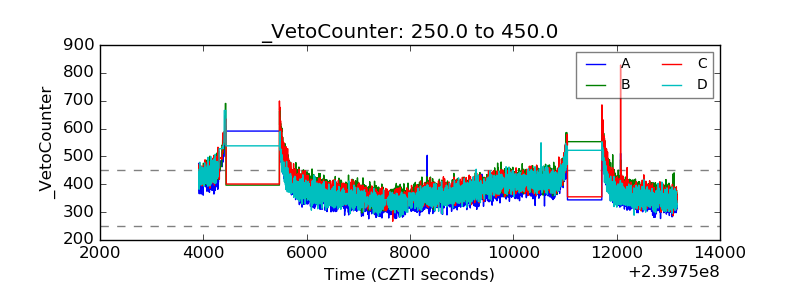 |