| Param | Original file | Final file |
|---|---|---|
| Filename | modeM0/AS1A03_086T01_9000001568_10854cztM0_level2.evt | modeM0/AS1A03_086T01_9000001568_10854cztM0_level2_quad_clean.evt |
| Size (bytes) | 507,960,000 | 68,869,440 |
| Size | 484.4 MB | 65.7 MB |
| Events in quadrant A | 5,103,695 | 414,519 |
| Events in quadrant B | 3,928,728 | 431,592 |
| Events in quadrant C | 2,724,932 | 437,170 |
| Events in quadrant D | 3,249,068 | 412,482 |
| Mode M9 | |||
|---|---|---|---|
| Quadrant | BADHDUFLAG | Total packets | Discarded packets |
| A | 0 | 13 | 0 |
| B | 0 | 13 | 0 |
| C | 0 | 13 | 0 |
| D | 0 | 13 | 0 |
| Mode SS | |||
|---|---|---|---|
| Quadrant | BADHDUFLAG | Total packets | Discarded packets |
| A | 0 | 112 | 0 |
| B | 0 | 112 | 0 |
| C | 0 | 112 | 0 |
| D | 0 | 112 | 0 |
| Mode M0 | |||
|---|---|---|---|
| Quadrant | BADHDUFLAG | Total packets | Discarded packets |
| A | 0 | 19127 | 2 |
| B | 0 | 15266 | 1 |
| C | 0 | 11519 | 1 |
| D | 0 | 13127 | 1 |
| Quadrant | Total seconds | Saturated seconds | Saturation percentage |
|---|---|---|---|
| A | 5569 | 552 | 9.912013% |
| B | 5569 | 310 | 5.566529% |
| C | 5569 | 25 | 0.448914% |
| D | 5569 | 112 | 2.011133% |
Noise dominated data is calculated using 1-second bins in cleaned event files. If a bin has >2000 counts, and if more than 50% of those come from <1% of pixels, then it is considered to be noise-dominated and hence unusable.
| Quadrant | # 1 sec bins | Bins with >0 counts | Bins with >2000 counts | High rate bins dominated by noise | Noise dominated (total time) | Noise dominated (detector-on time) | Marked lightcurve |
|---|---|---|---|---|---|---|---|
| A | 6799 | 5570 | 305 | 305 | 4.49% | 5.48% | 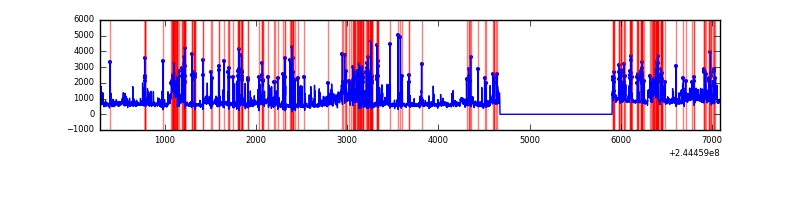 |
| B | 6799 | 5570 | 180 | 180 | 2.65% | 3.23% | 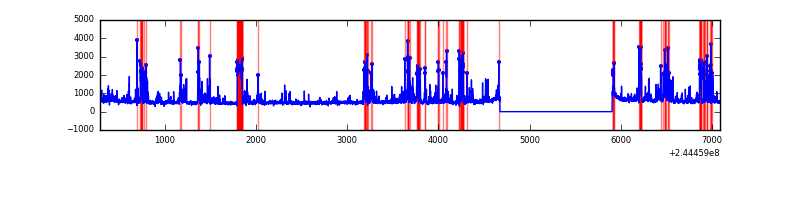 |
| C | 6799 | 5570 | 0 | 0 | 0.00% | 0.00% | 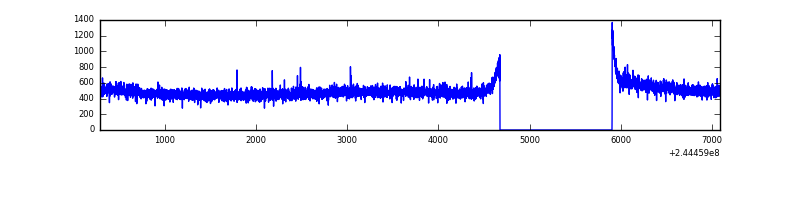 |
| D | 6799 | 5570 | 56 | 56 | 0.82% | 1.01% | 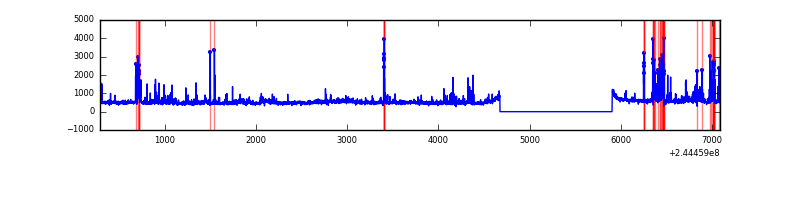 |
Top three noisy pixels from each quadrant. If the there are fewer than three noisy pixels in the level2.evt file, extra rows are filled as -1
| Pixel properties | Quadrant properties | ||||||
|---|---|---|---|---|---|---|---|
| Quadrant | DetID | PixID | Counts | Sigma | Mean | Median | Sigma |
| A | 8 | 5 | 2310788 | 16566.83 | 694 | 682 | 139.4 |
| A | 15 | 223 | 22138 | 153.87 | 694 | 682 | 139.4 |
| A | 13 | 251 | 18754 | 129.6 | 694 | 682 | 139.4 |
| B | 4 | 239 | 1072912 | 7992.57 | 706 | 693 | 134.2 |
| B | 0 | 214 | 32290 | 235.53 | 706 | 693 | 134.2 |
| B | 0 | 187 | 27390 | 199.01 | 706 | 693 | 134.2 |
| C | 13 | 61 | 5292 | 28.82 | 697 | 704 | 159.2 |
| C | 14 | 234 | 3129 | 15.23 | 697 | 704 | 159.2 |
| C | 7 | 221 | 2058 | 8.5 | 697 | 704 | 159.2 |
| D | 12 | 233 | 145752 | 876.13 | 697 | 680 | 165.6 |
| D | 1 | 52 | 120187 | 721.74 | 697 | 680 | 165.6 |
| D | 2 | 14 | 94344 | 565.66 | 697 | 680 | 165.6 |
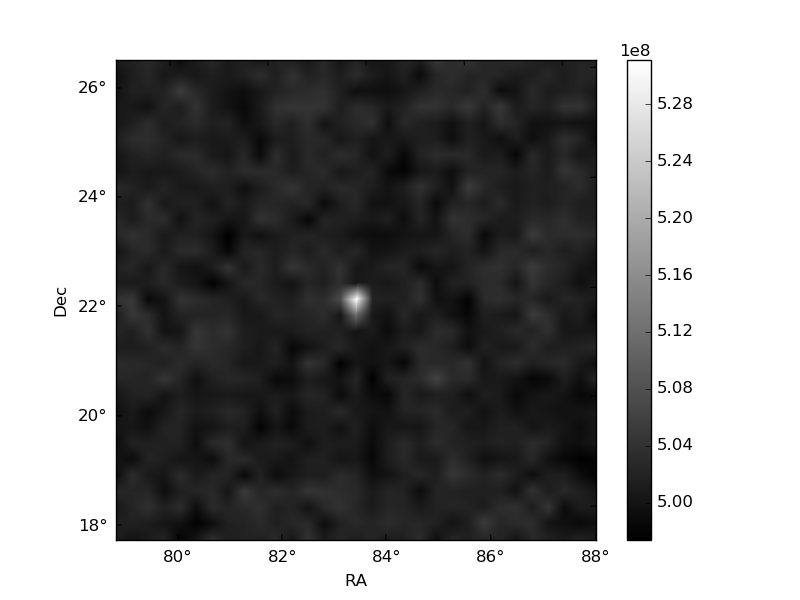
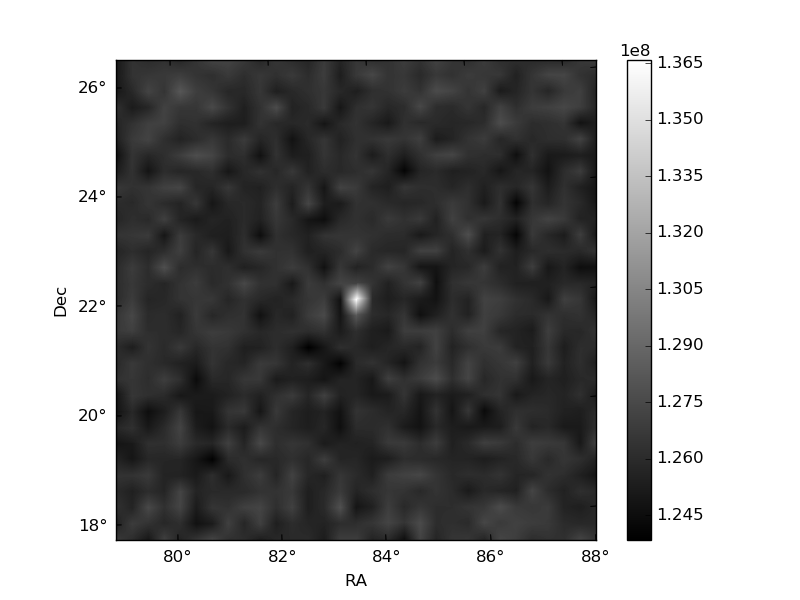
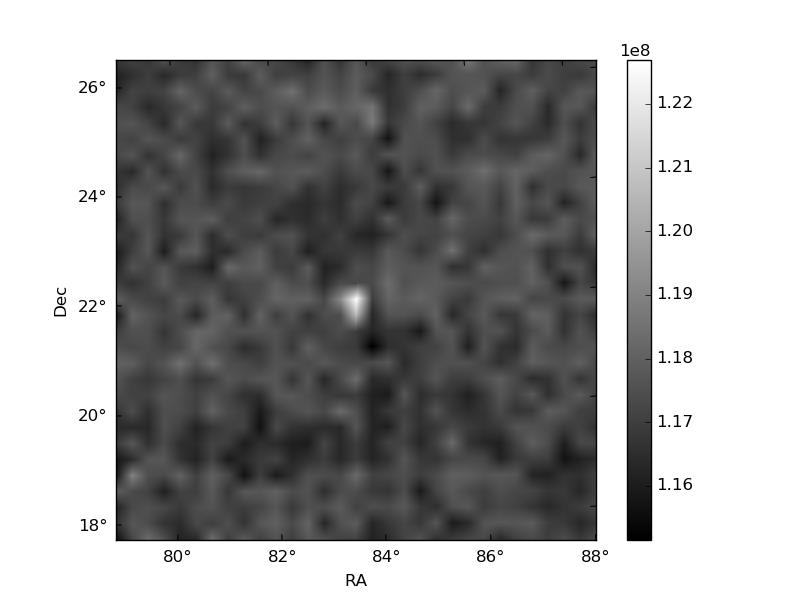
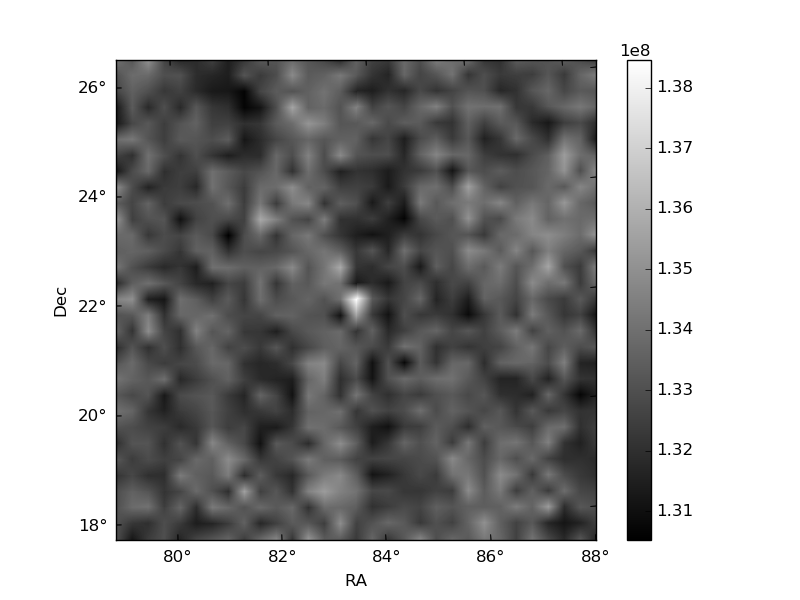
Histogram calculated using DETX and DETY for each event in the final _common_clean file
| Quadrant A | 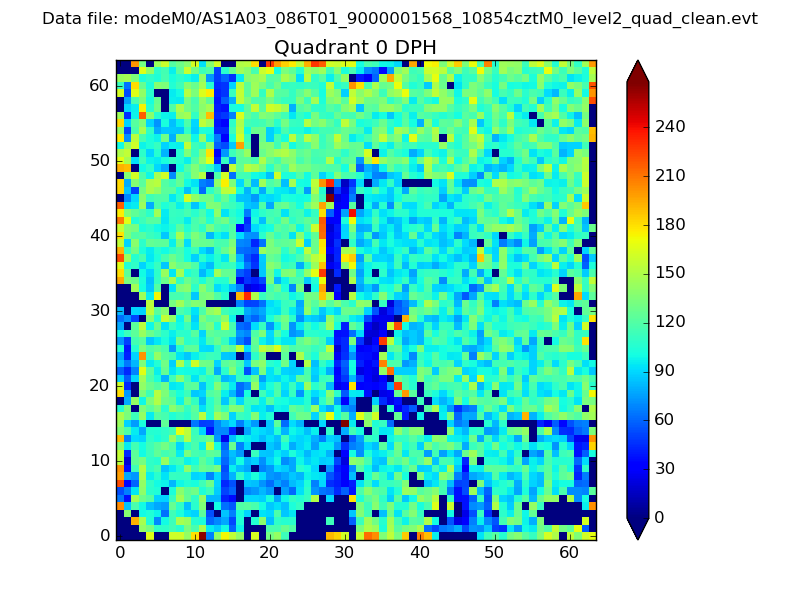 |
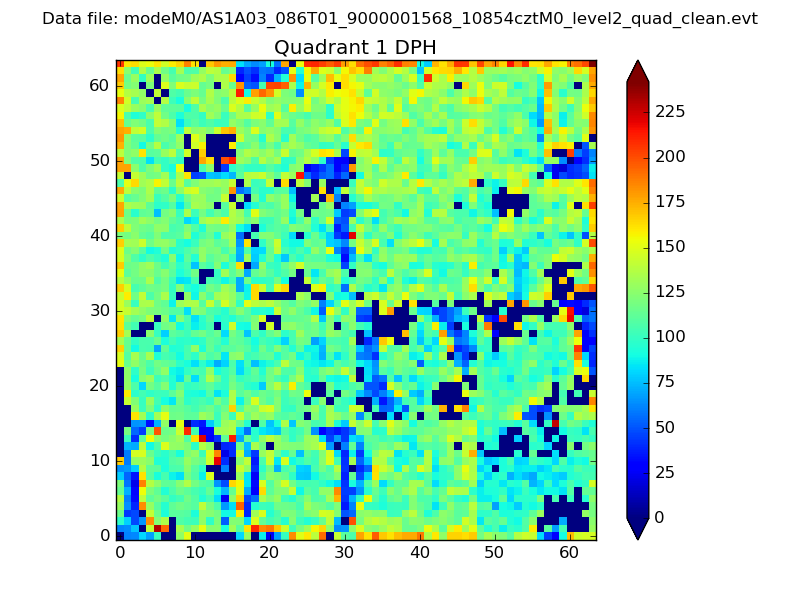 |
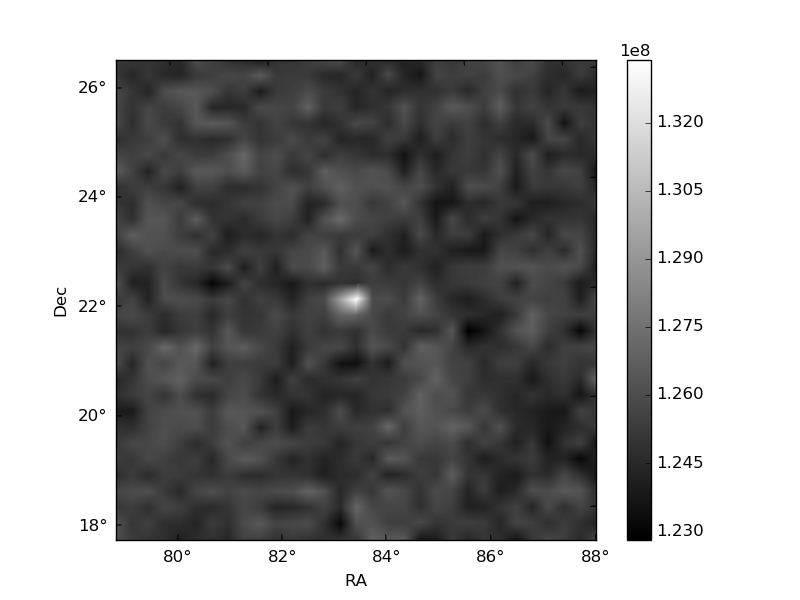
Quadrant B |
|---|---|---|---|
| Quadrant D | 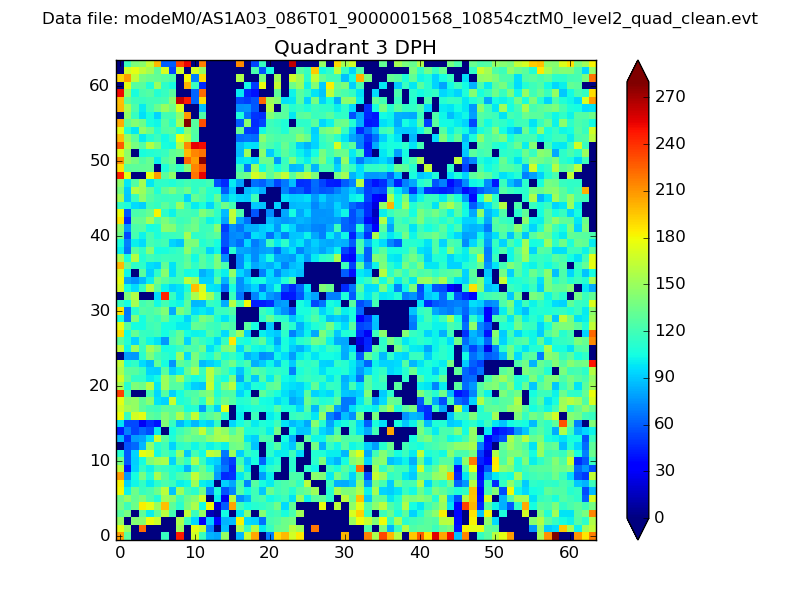 |
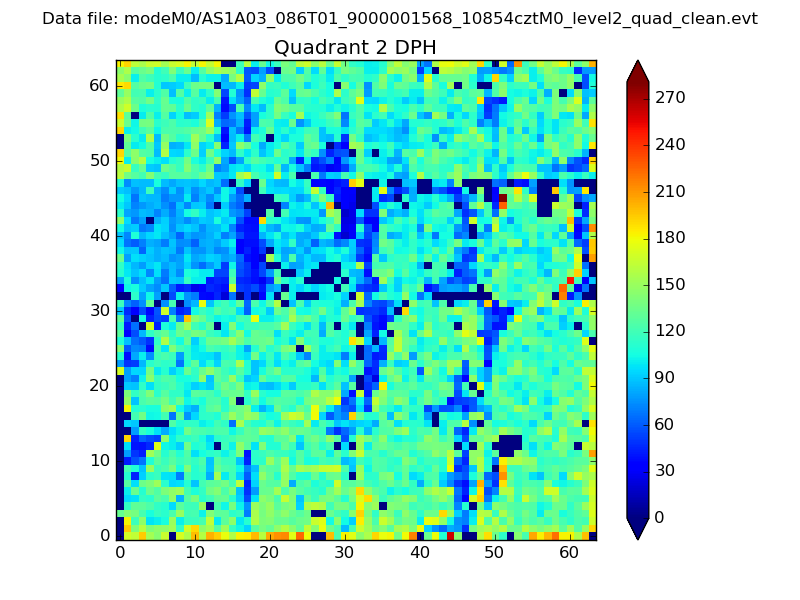 |
Quadrant C |
| Plot type | Count rate plots | Images |
|---|---|---|
| Comparison with Poisson distribution Blue bars denote a histogram of data divided into 1 sec bins. Red curve is a Poisson curve with rate = median count rate of data. |
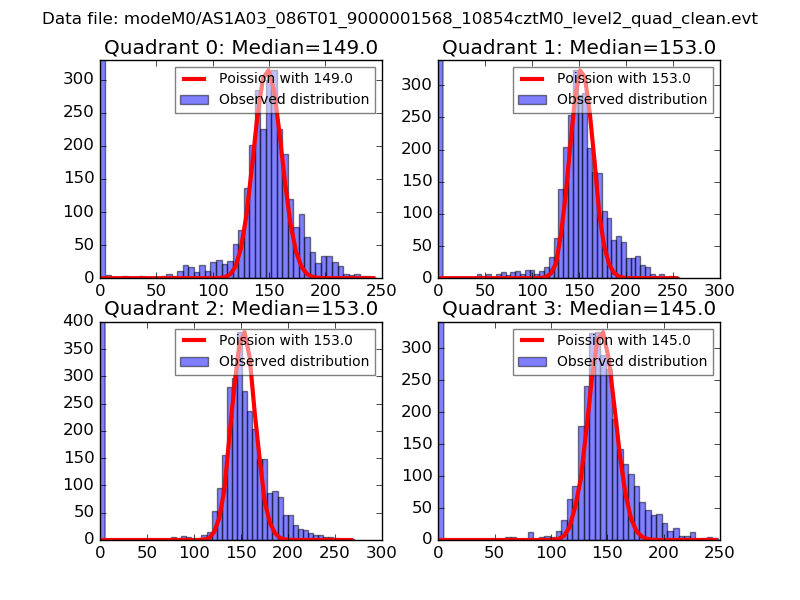 |
 |
| Quadrant-wise count rates Data is divided into 100 sec bins |
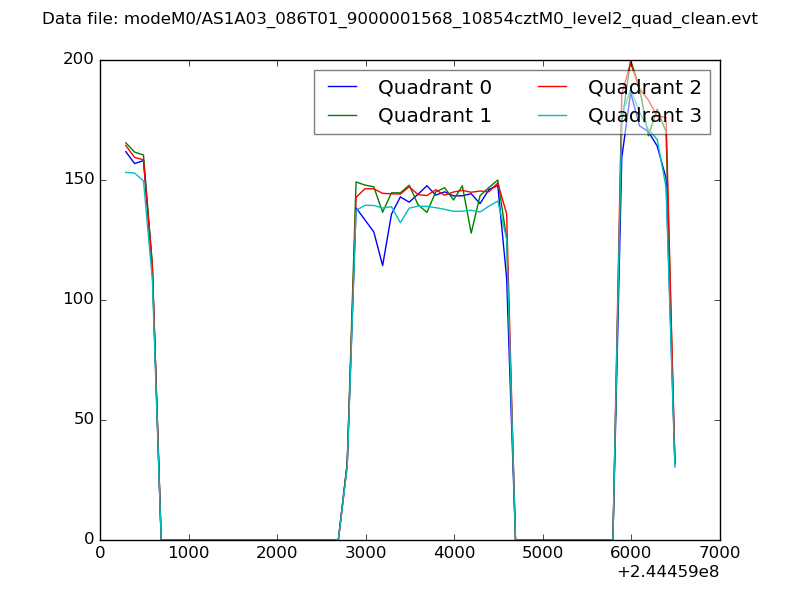 |
|
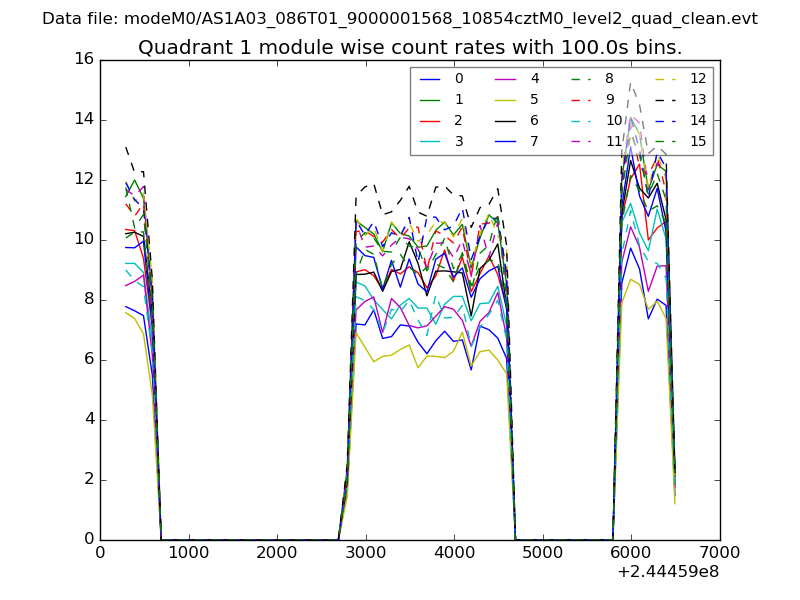
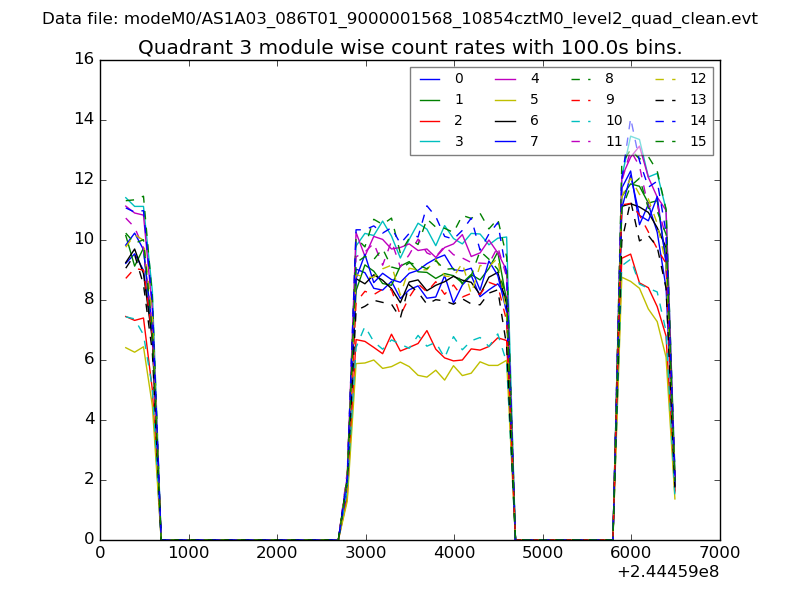
| Module-wise count rates for Quadrant A Data is divided into 100 sec bins |
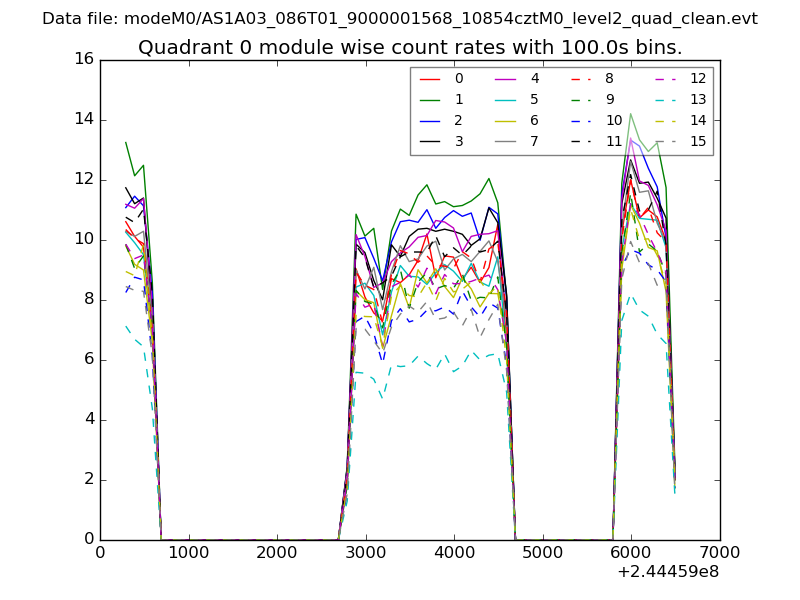 |
 |
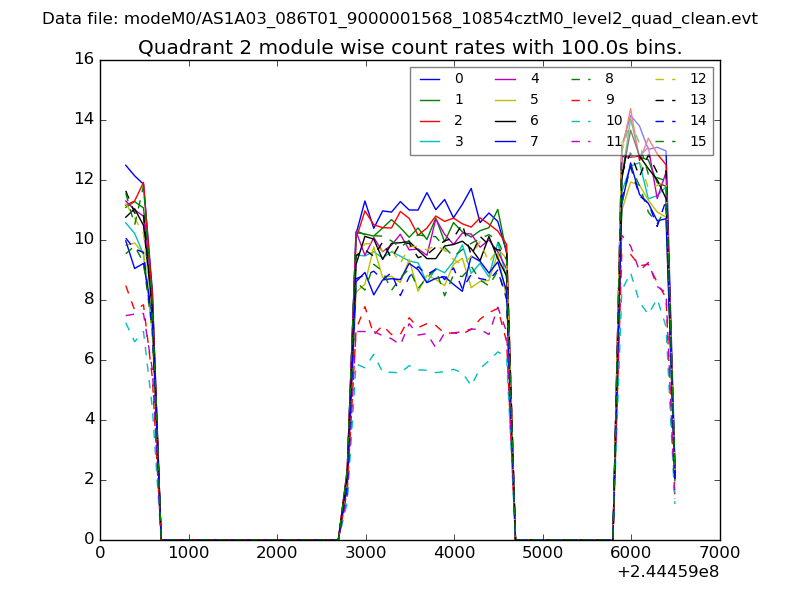
| Module-wise count rates for Quadrant B Data is divided into 100 sec bins |
 |
 |
| Module-wise count rates for Quadrant C Data is divided into 100 sec bins |
 |
 |
| Module-wise count rates for Quadrant D Data is divided into 100 sec bins |
 |
 |
| Parameter | Plot |
|---|---|
| CZT HV Monitor | 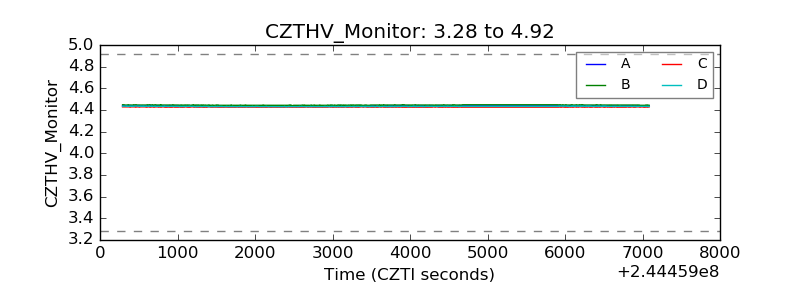 |
| D_VDD | 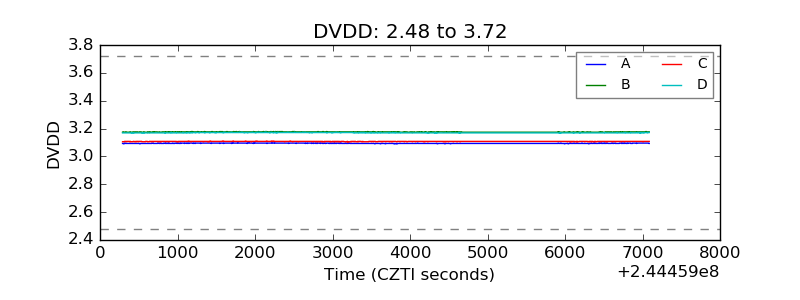 |
| Temperature 1 | 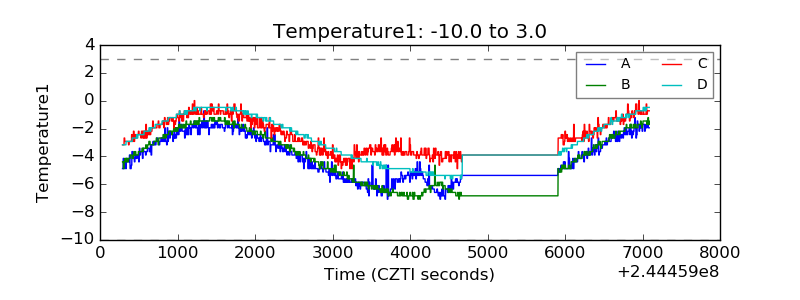 |
| Veto HV Monitor | 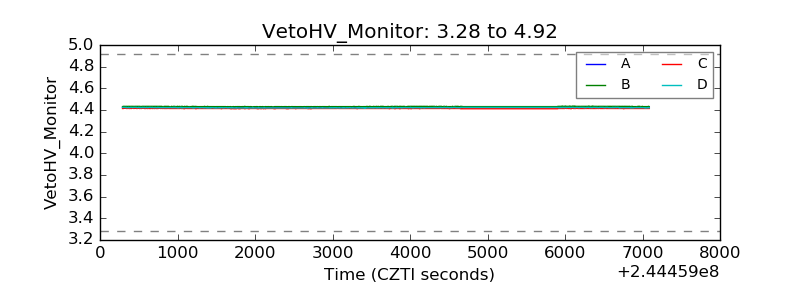 |
| Veto LLD | 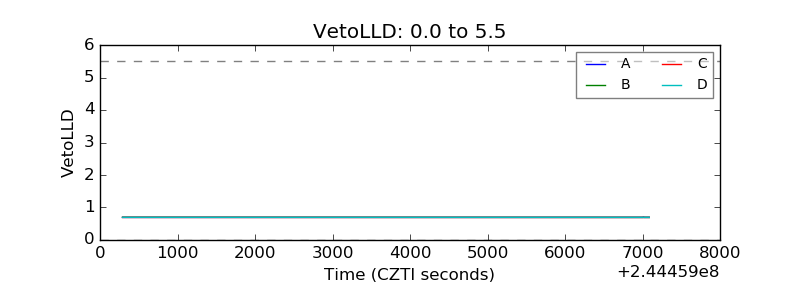 |
| Alpha Counter | 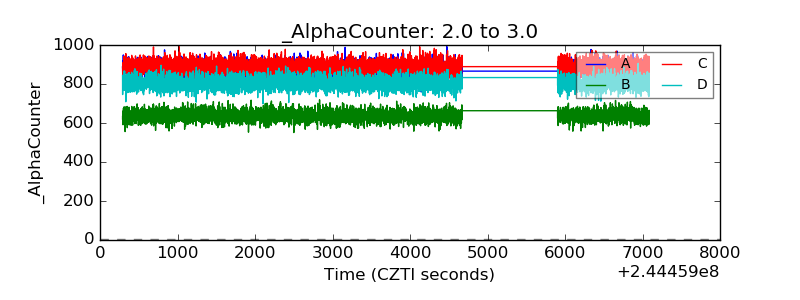 |
| _CPM_Rate | 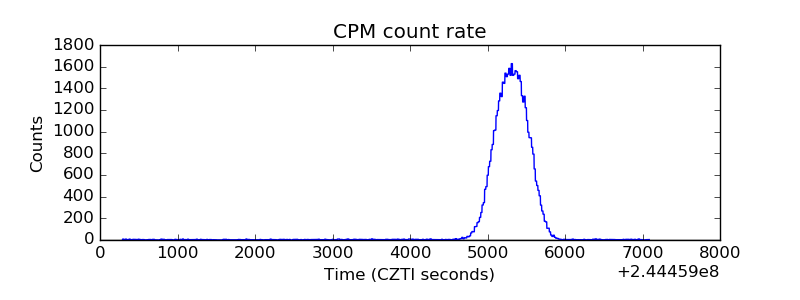 |
| CZT Counter | 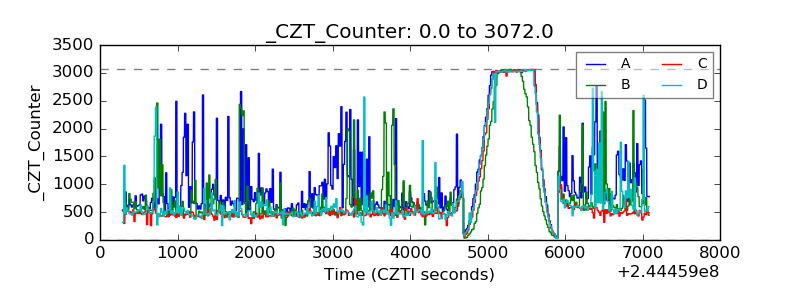 |
| +2.5 Volts monitor |  |
| +5 Volts monitor |  |
| _ROLL_ROT | 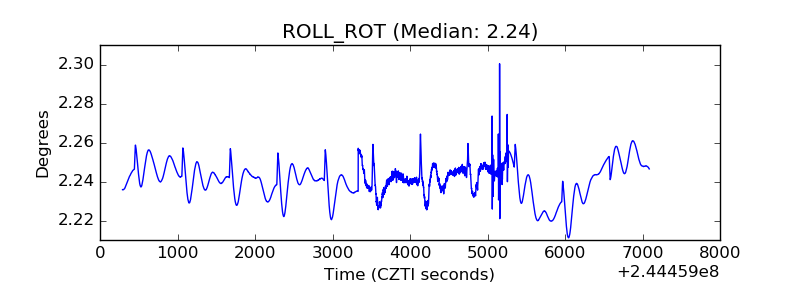 |
| _Roll_DEC | 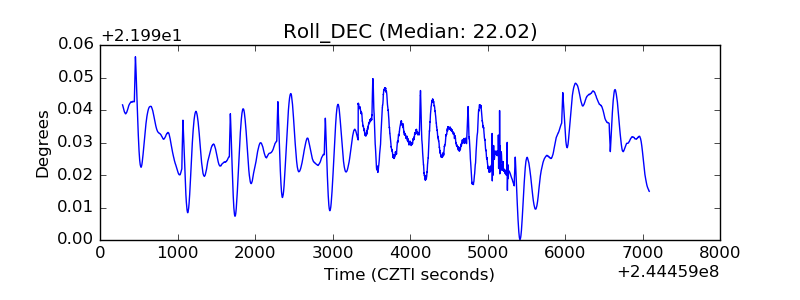 |
| _Roll_RA | 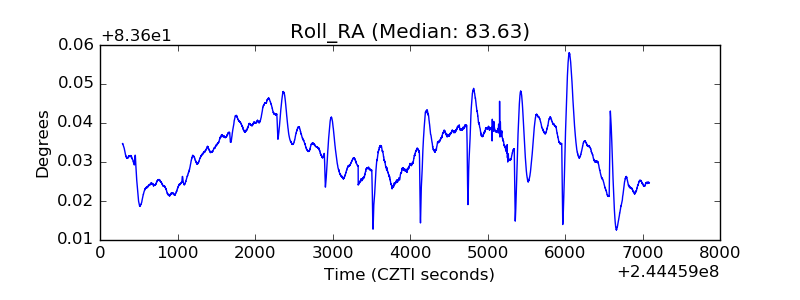 |
| Veto Counter | 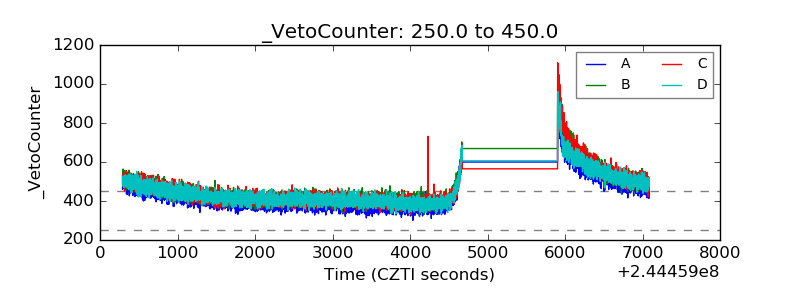 |