| Param | Original file | Final file |
|---|---|---|
| Filename | modeM0/AS1A04_130T01_9000001856_12537cztM0_level2.evt | modeM0/AS1A04_130T01_9000001856_12537cztM0_level2_quad_clean.evt |
| Size (bytes) | 514,664,640 | 72,728,640 |
| Size | 490.8 MB | 69.4 MB |
| Events in quadrant A | 3,787,410 | 433,481 |
| Events in quadrant B | 3,779,553 | 432,974 |
| Events in quadrant C | 3,340,235 | 433,902 |
| Events in quadrant D | 4,199,441 | 409,229 |
| Mode M9 | |||
|---|---|---|---|
| Quadrant | BADHDUFLAG | Total packets | Discarded packets |
| A | 0 | 22 | 0 |
| B | 0 | 22 | 0 |
| C | 0 | 22 | 0 |
| D | 0 | 22 | 0 |
| Mode M0 | |||
|---|---|---|---|
| Quadrant | BADHDUFLAG | Total packets | Discarded packets |
| A | 0 | 15602 | 3 |
| B | 0 | 15686 | 2 |
| C | 0 | 14665 | 2 |
| D | 0 | 17475 | 2 |
| Mode SS | |||
|---|---|---|---|
| Quadrant | BADHDUFLAG | Total packets | Discarded packets |
| A | 0 | 146 | 0 |
| B | 0 | 146 | 0 |
| C | 0 | 146 | 0 |
| D | 0 | 146 | 0 |
| Quadrant | Total seconds | Saturated seconds | Saturation percentage |
|---|---|---|---|
| A | 7075 | 127 | 1.795053% |
| B | 7075 | 173 | 2.445230% |
| C | 7075 | 60 | 0.848057% |
| D | 7075 | 270 | 3.816254% |
Noise dominated data is calculated using 1-second bins in cleaned event files. If a bin has >2000 counts, and if more than 50% of those come from <1% of pixels, then it is considered to be noise-dominated and hence unusable.
| Quadrant | # 1 sec bins | Bins with >0 counts | Bins with >2000 counts | High rate bins dominated by noise | Noise dominated (total time) | Noise dominated (detector-on time) | Marked lightcurve |
|---|---|---|---|---|---|---|---|
| A | 9161 | 7078 | 0 | 0 | 0.00% | 0.00% | 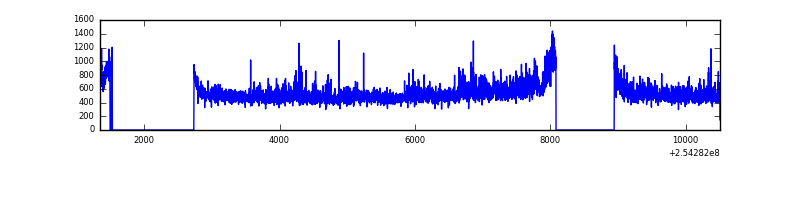 |
| B | 9161 | 7078 | 20 | 20 | 0.22% | 0.28% | 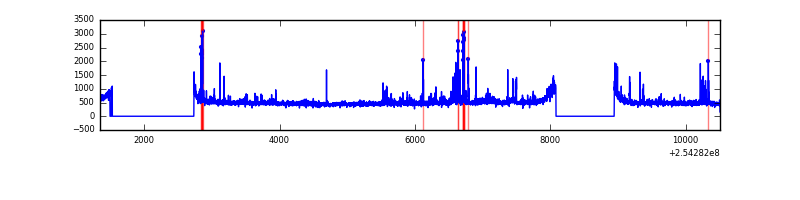 |
| C | 9161 | 7079 | 0 | 0 | 0.00% | 0.00% | 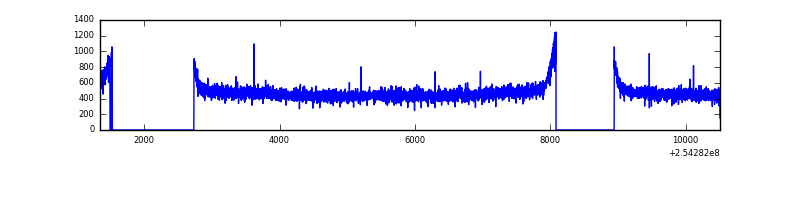 |
| D | 9161 | 7078 | 162 | 162 | 1.77% | 2.29% | 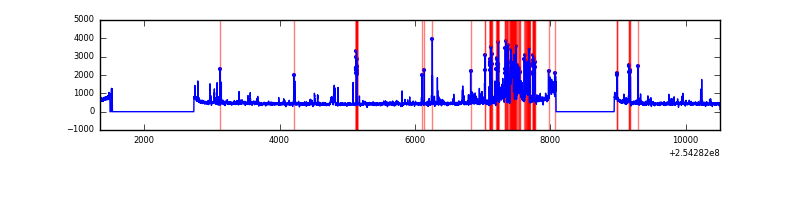 |
Top three noisy pixels from each quadrant. If the there are fewer than three noisy pixels in the level2.evt file, extra rows are filled as -1
| Pixel properties | Quadrant properties | ||||||
|---|---|---|---|---|---|---|---|
| Quadrant | DetID | PixID | Counts | Sigma | Mean | Median | Sigma |
| A | 1 | 162 | 156259 | 875.09 | 871 | 852 | 177.6 |
| A | 1 | 178 | 90101 | 502.56 | 871 | 852 | 177.6 |
| A | 1 | 161 | 75420 | 419.89 | 871 | 852 | 177.6 |
| B | 4 | 239 | 255302 | 1517.81 | 873 | 851 | 167.6 |
| B | 0 | 230 | 41973 | 245.29 | 873 | 851 | 167.6 |
| B | 0 | 214 | 27896 | 161.32 | 873 | 851 | 167.6 |
| C | 3 | 0 | 7814 | 34.88 | 854 | 861 | 199.4 |
| C | 13 | 61 | 6417 | 27.87 | 854 | 861 | 199.4 |
| C | 8 | 222 | 2165 | 6.54 | 854 | 861 | 199.4 |
| D | 1 | 52 | 868971 | 4315.84 | 839 | 818 | 201.2 |
| D | 8 | 195 | 45029 | 219.79 | 839 | 818 | 201.2 |
| D | 13 | 104 | 33494 | 162.44 | 839 | 818 | 201.2 |
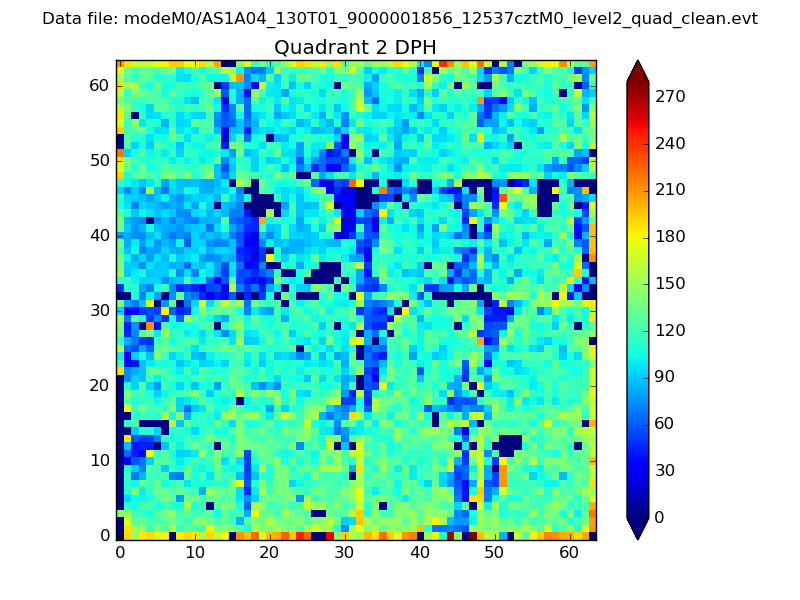
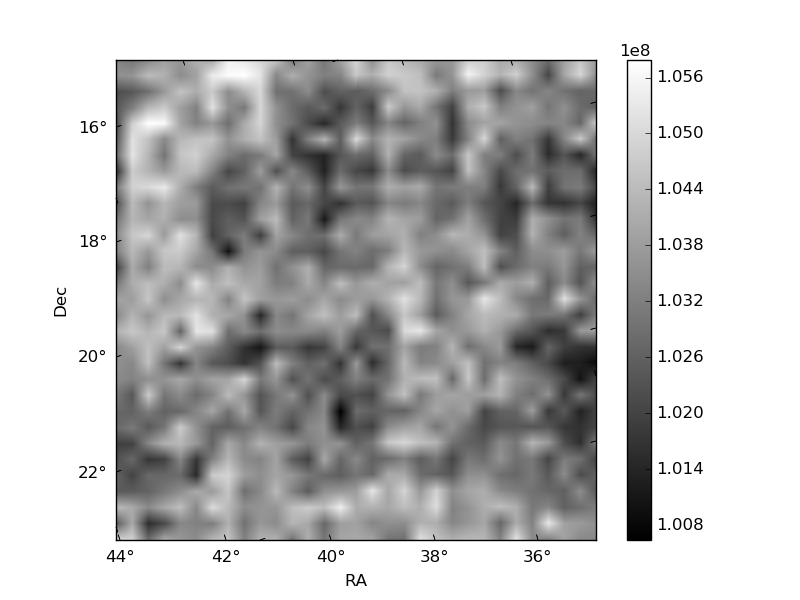
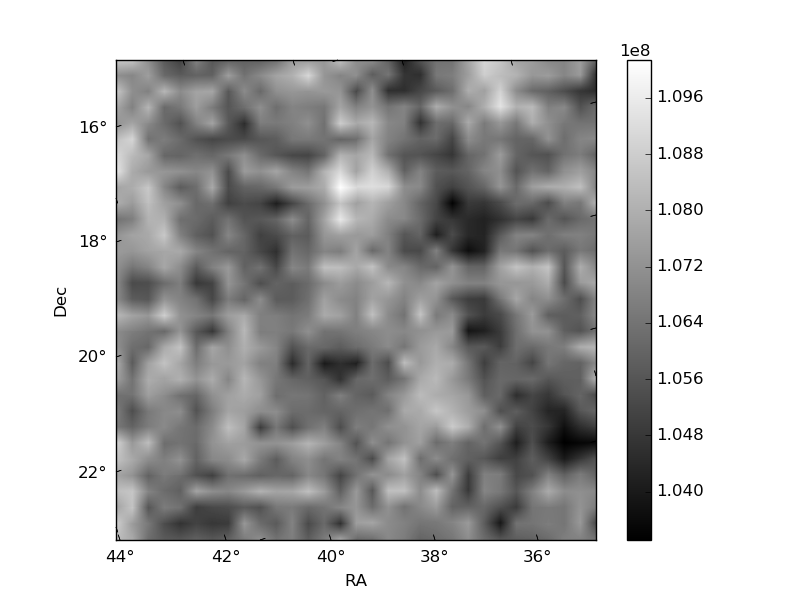
Histogram calculated using DETX and DETY for each event in the final _common_clean file
| Quadrant A | 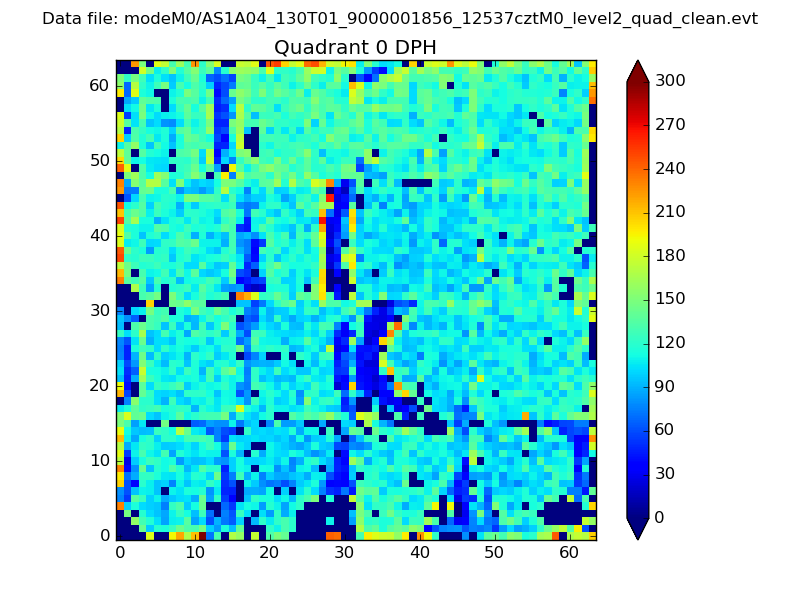 |
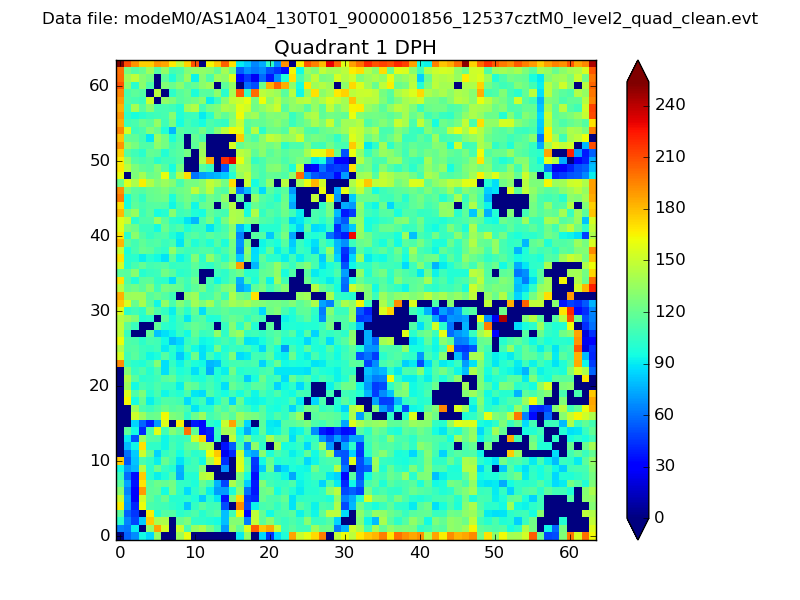 |
Quadrant B |
|---|---|---|---|
| Quadrant D | 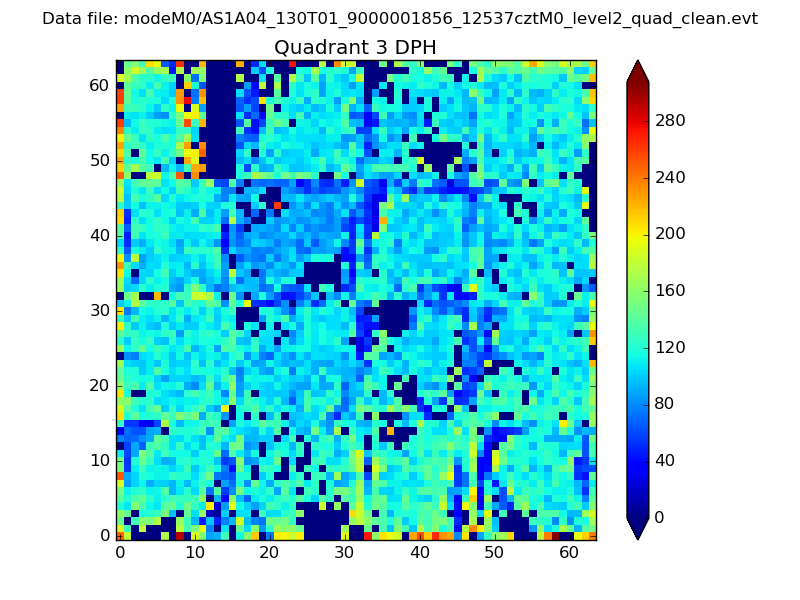 |
 |
Quadrant C |
| Plot type | Count rate plots | Images |
|---|---|---|
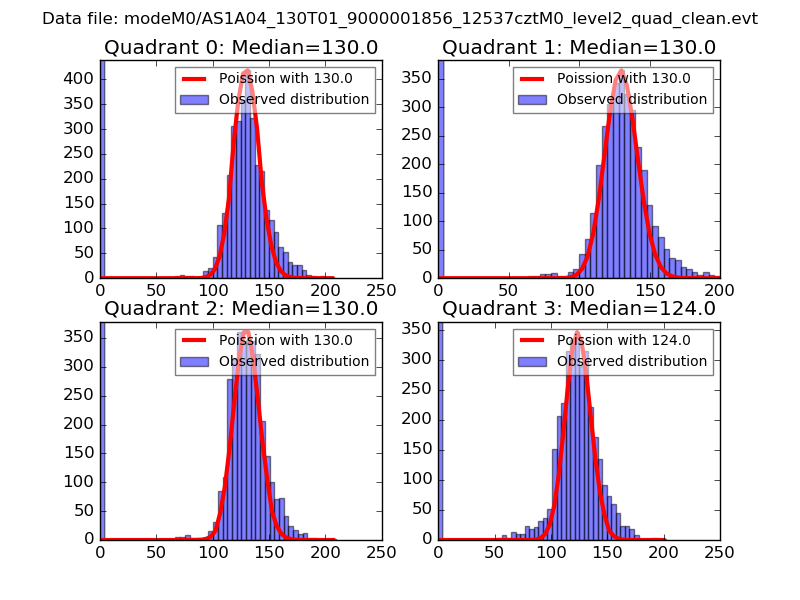
| Comparison with Poisson distribution Blue bars denote a histogram of data divided into 1 sec bins. Red curve is a Poisson curve with rate = median count rate of data. |
 |
 |
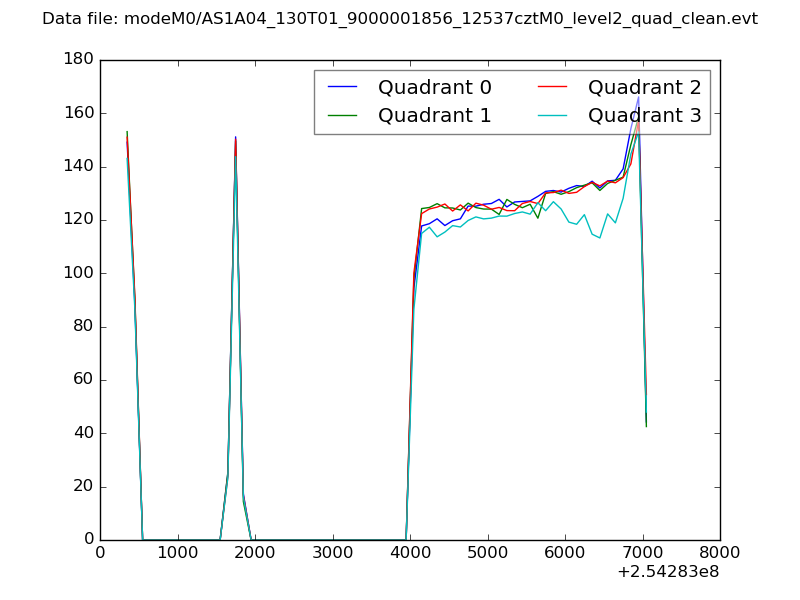
| Quadrant-wise count rates Data is divided into 100 sec bins |
 |
|
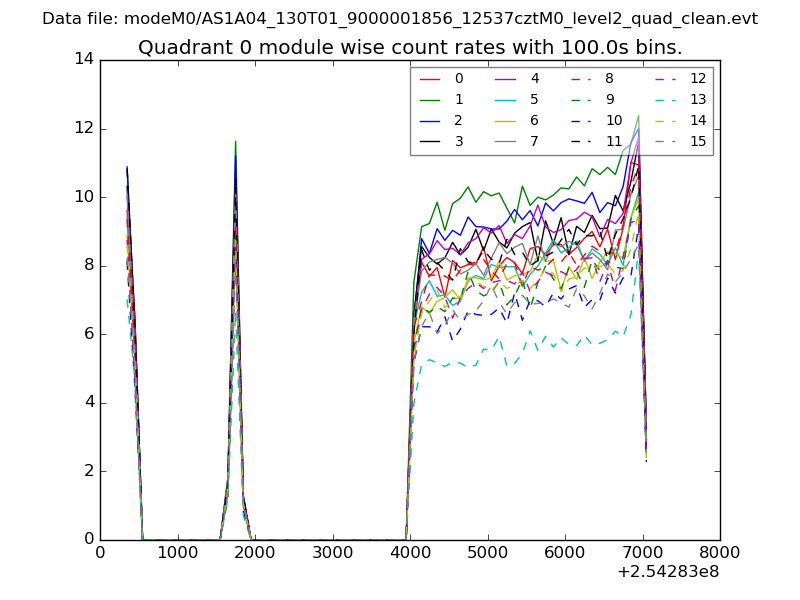
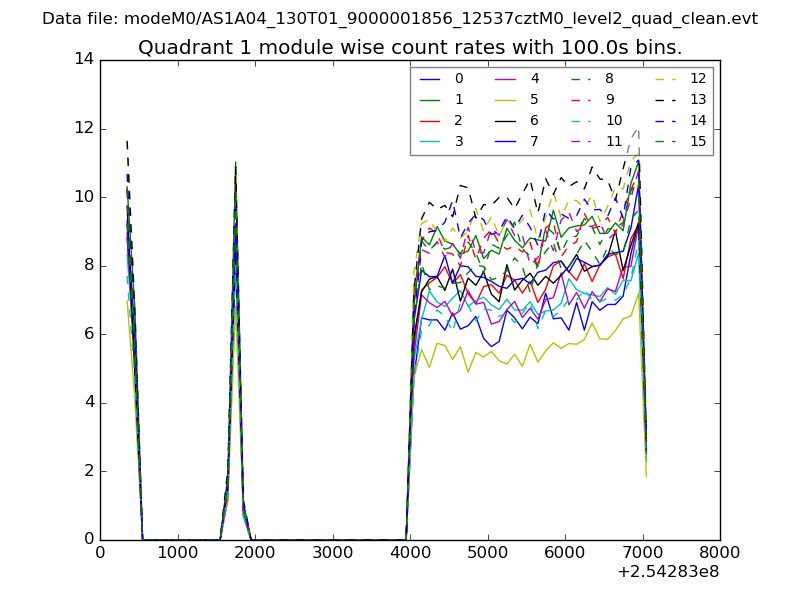
| Module-wise count rates for Quadrant A Data is divided into 100 sec bins |
 |
 |
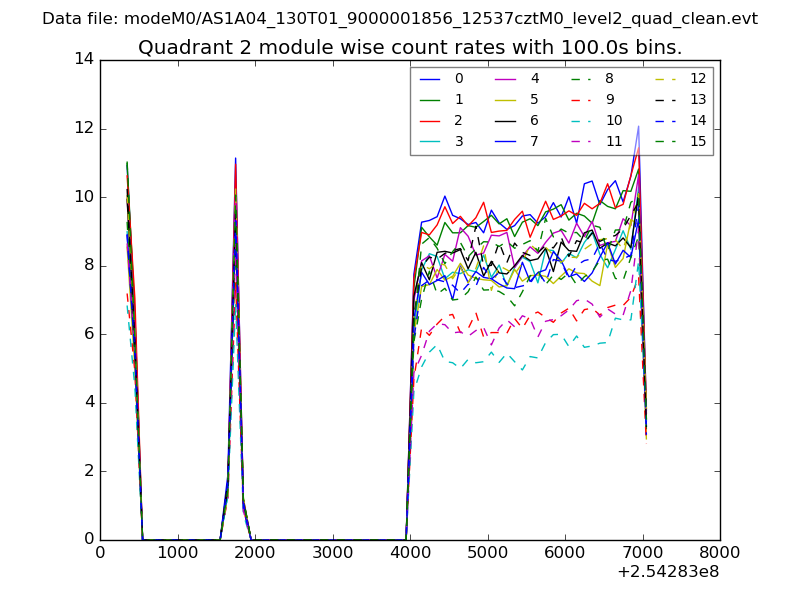
| Module-wise count rates for Quadrant B Data is divided into 100 sec bins |
 |
 |
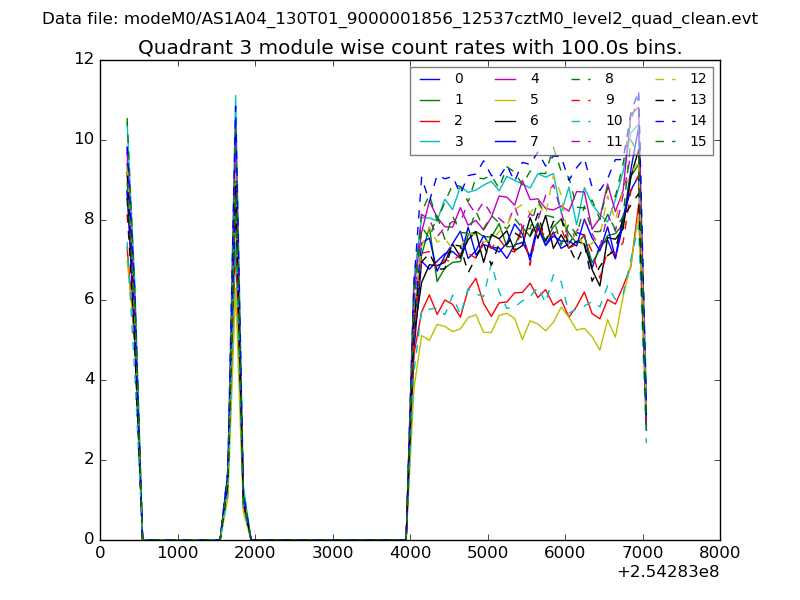
| Module-wise count rates for Quadrant C Data is divided into 100 sec bins |
 |
 |
| Module-wise count rates for Quadrant D Data is divided into 100 sec bins |
 |
 |
| Parameter | Plot |
|---|---|
| CZT HV Monitor | 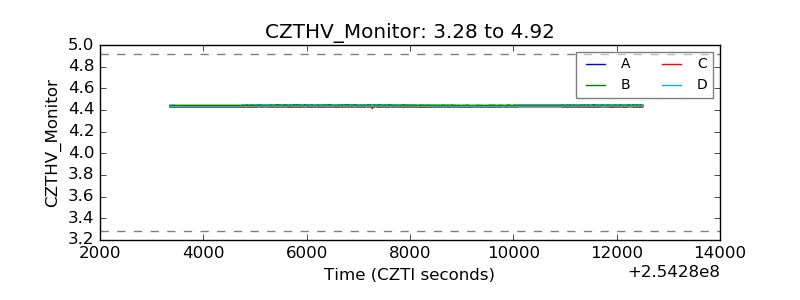 |
| D_VDD | 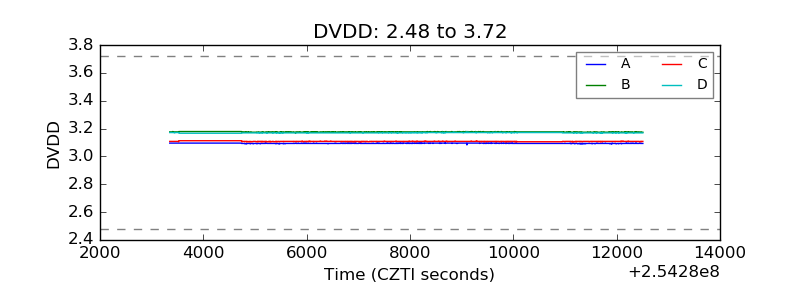 |
| Temperature 1 | 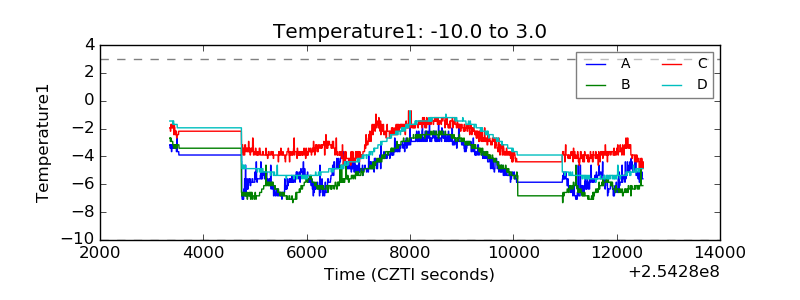 |
| Veto HV Monitor | 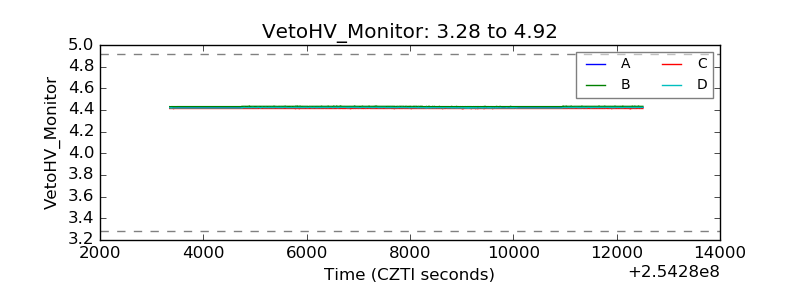 |
| Veto LLD | 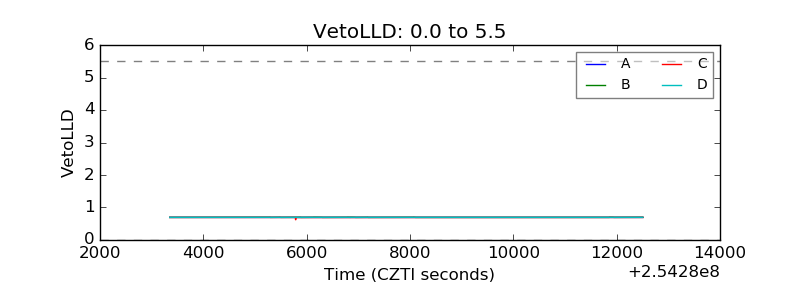 |
| Alpha Counter | 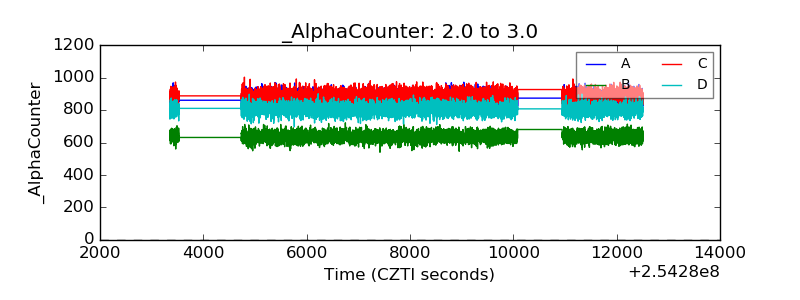 |
| _CPM_Rate | 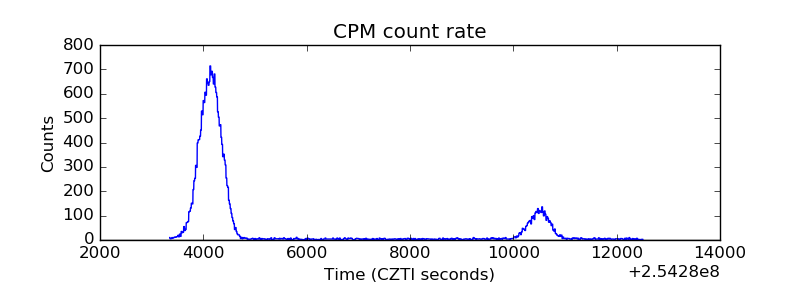 |
| CZT Counter | 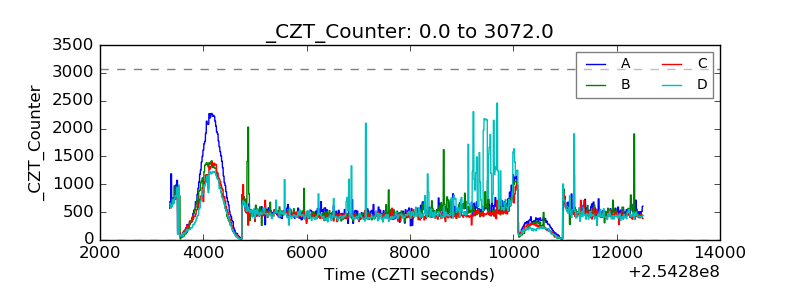 |
| +2.5 Volts monitor |  |
| +5 Volts monitor |  |
| _ROLL_ROT | 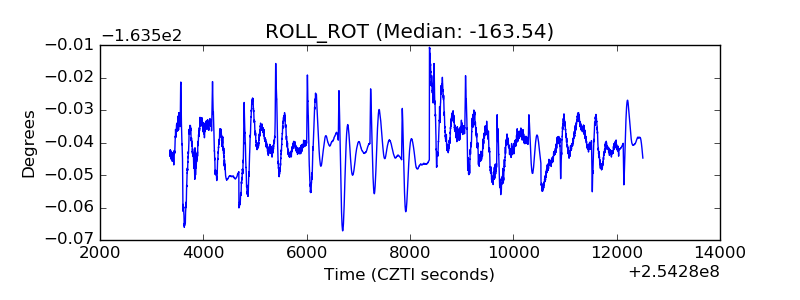 |
| _Roll_DEC | 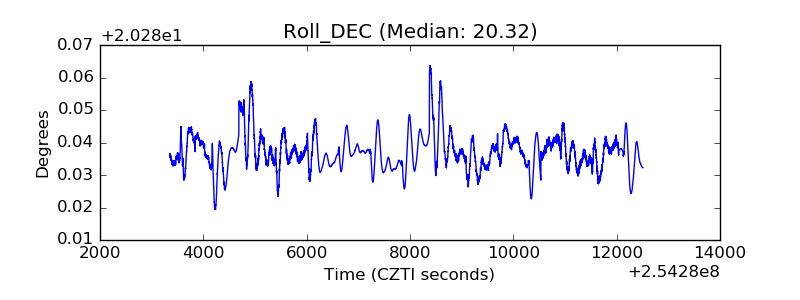 |
| _Roll_RA | 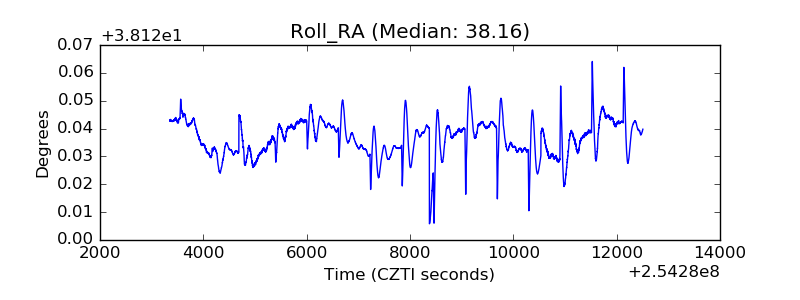 |
| Veto Counter | 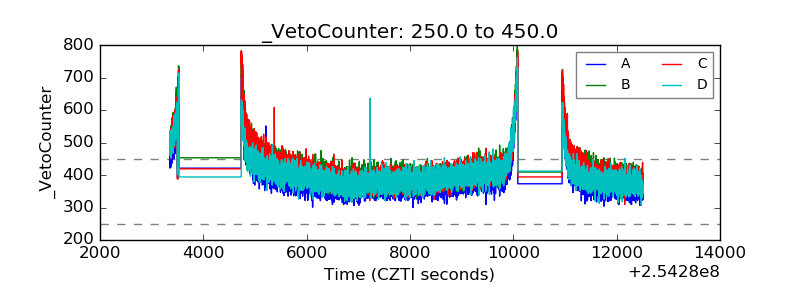 |