| Param | Original file | Final file |
|---|---|---|
| Filename | modeM0/AS1A04_110T04_9000001886_12794cztM0_level2.evt | modeM0/AS1A04_110T04_9000001886_12794cztM0_level2_quad_clean.evt |
| Size (bytes) | 207,023,040 | 54,028,800 |
| Size | 197.4 MB | 51.5 MB |
| Events in quadrant A | 1,294,367 | 378,598 |
| Events in quadrant B | 1,883,358 | 362,235 |
| Events in quadrant C | 1,224,809 | 363,556 |
| Events in quadrant D | 1,689,141 | 345,800 |
| Mode SS | |||
|---|---|---|---|
| Quadrant | BADHDUFLAG | Total packets | Discarded packets |
| A | 0 | 52 | 0 |
| B | 0 | 52 | 0 |
| C | 0 | 52 | 0 |
| D | 0 | 52 | 0 |
| Mode M0 | |||
|---|---|---|---|
| Quadrant | BADHDUFLAG | Total packets | Discarded packets |
| A | 0 | 5408 | 0 |
| B | 0 | 7233 | 0 |
| C | 0 | 5261 | 0 |
| D | 0 | 6660 | 0 |
| Quadrant | Total seconds | Saturated seconds | Saturation percentage |
|---|---|---|---|
| A | 2590 | 1 | 0.038610% |
| B | 2590 | 168 | 6.486486% |
| C | 2590 | 1 | 0.038610% |
| D | 2590 | 64 | 2.471042% |
Noise dominated data is calculated using 1-second bins in cleaned event files. If a bin has >2000 counts, and if more than 50% of those come from <1% of pixels, then it is considered to be noise-dominated and hence unusable.
| Quadrant | # 1 sec bins | Bins with >0 counts | Bins with >2000 counts | High rate bins dominated by noise | Noise dominated (total time) | Noise dominated (detector-on time) | Marked lightcurve |
|---|---|---|---|---|---|---|---|
| A | 2592 | 2592 | 0 | 0 | 0.00% | 0.00% | 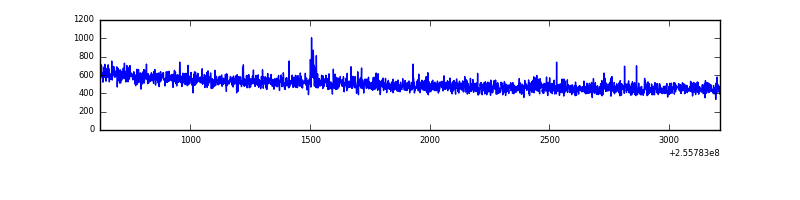 |
| B | 2592 | 2592 | 86 | 86 | 3.32% | 3.32% | 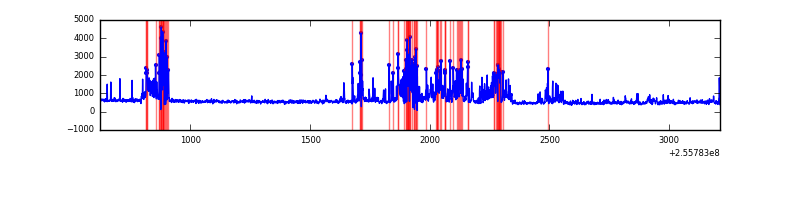 |
| C | 2592 | 2592 | 1 | 1 | 0.04% | 0.04% | 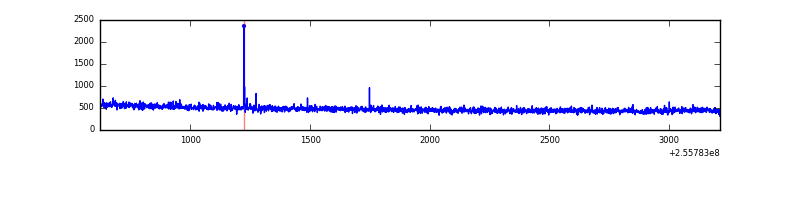 |
| D | 2592 | 2592 | 50 | 50 | 1.93% | 1.93% | 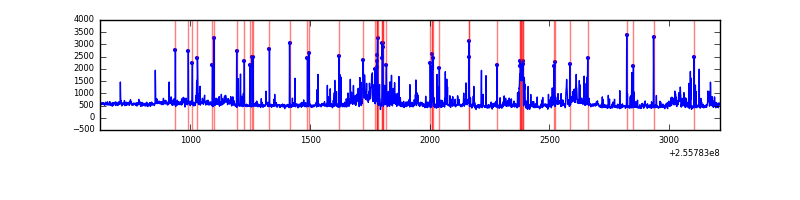 |
Top three noisy pixels from each quadrant. If the there are fewer than three noisy pixels in the level2.evt file, extra rows are filled as -1
| Pixel properties | Quadrant properties | ||||||
|---|---|---|---|---|---|---|---|
| Quadrant | DetID | PixID | Counts | Sigma | Mean | Median | Sigma |
| A | 12 | 189 | 6885 | 96.92 | 332 | 326 | 67.7 |
| A | 8 | 15 | 6033 | 84.33 | 332 | 326 | 67.7 |
| A | 0 | 226 | 3078 | 40.67 | 332 | 326 | 67.7 |
| B | 4 | 239 | 569082 | 9635.52 | 313 | 306 | 59.0 |
| B | 0 | 219 | 61522 | 1037.05 | 313 | 306 | 59.0 |
| B | 3 | 209 | 11798 | 194.68 | 313 | 306 | 59.0 |
| C | 14 | 234 | 4237 | 53.98 | 313 | 314 | 72.7 |
| C | 13 | 61 | 2355 | 28.08 | 313 | 314 | 72.7 |
| C | 3 | 202 | 829 | 7.09 | 313 | 314 | 72.7 |
| D | 8 | 195 | 219300 | 2917.87 | 316 | 309 | 75.1 |
| D | 1 | 52 | 190405 | 2532.87 | 316 | 309 | 75.1 |
| D | 7 | 80 | 24238 | 318.83 | 316 | 309 | 75.1 |
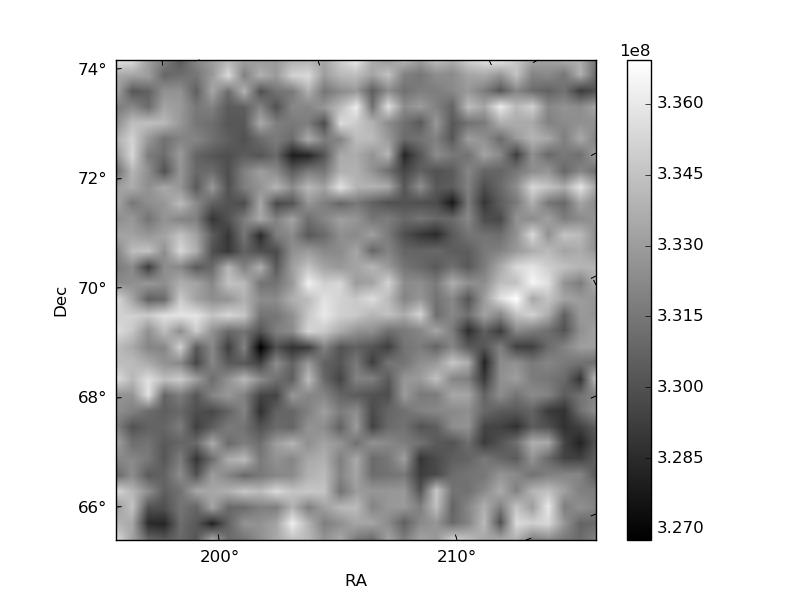
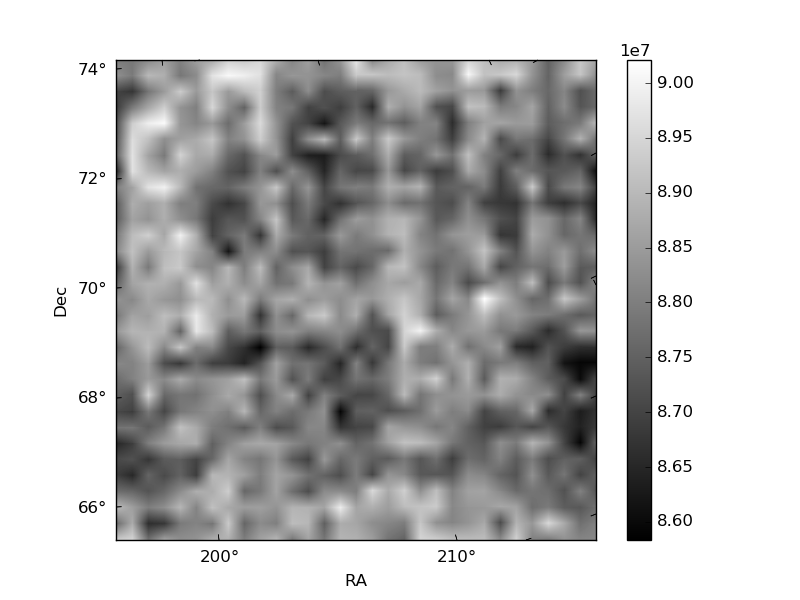
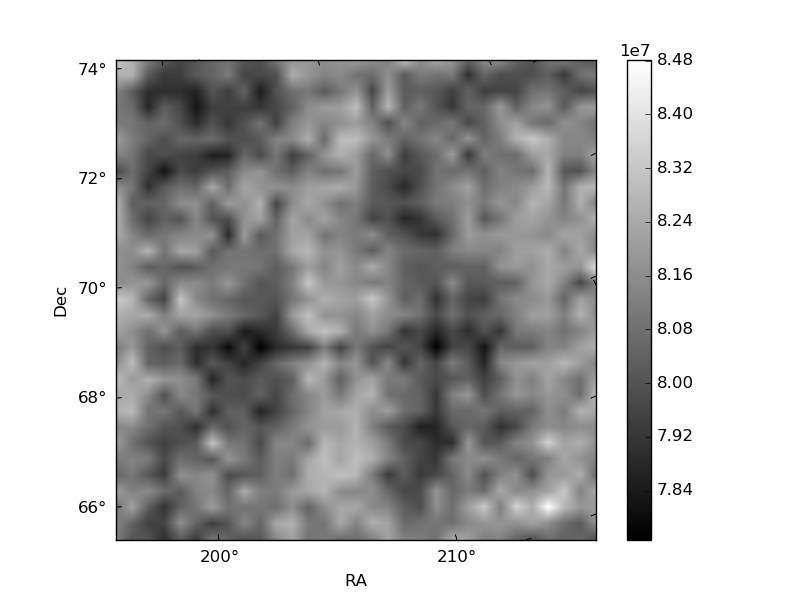
Histogram calculated using DETX and DETY for each event in the final _common_clean file
| Quadrant A | 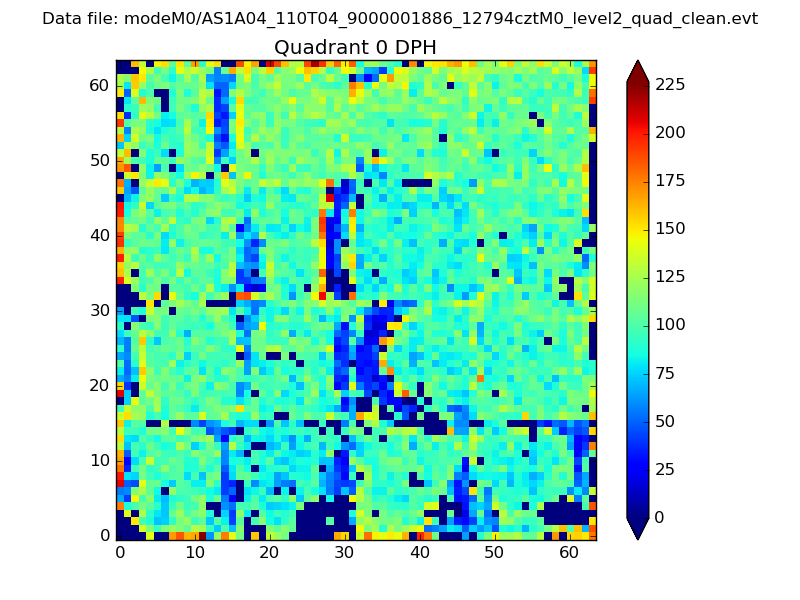 |
 |
Quadrant B |
|---|---|---|---|
| Quadrant D | 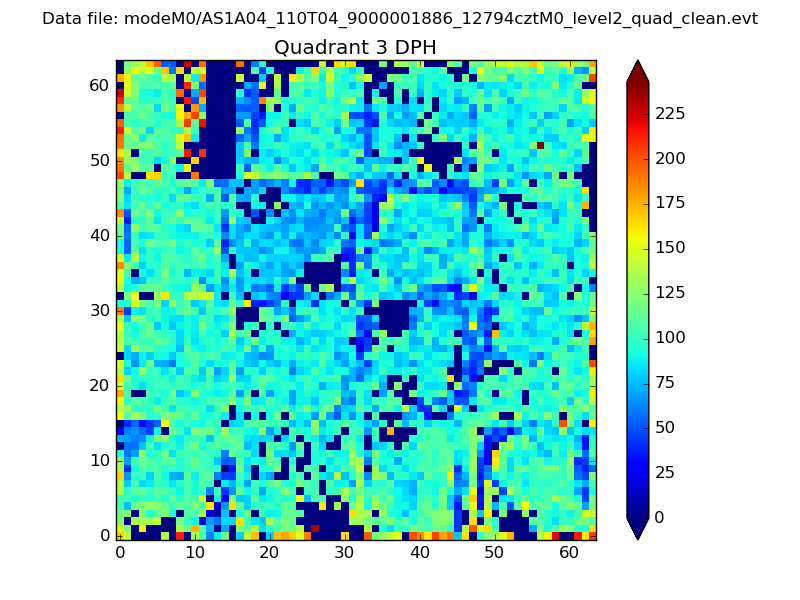 |
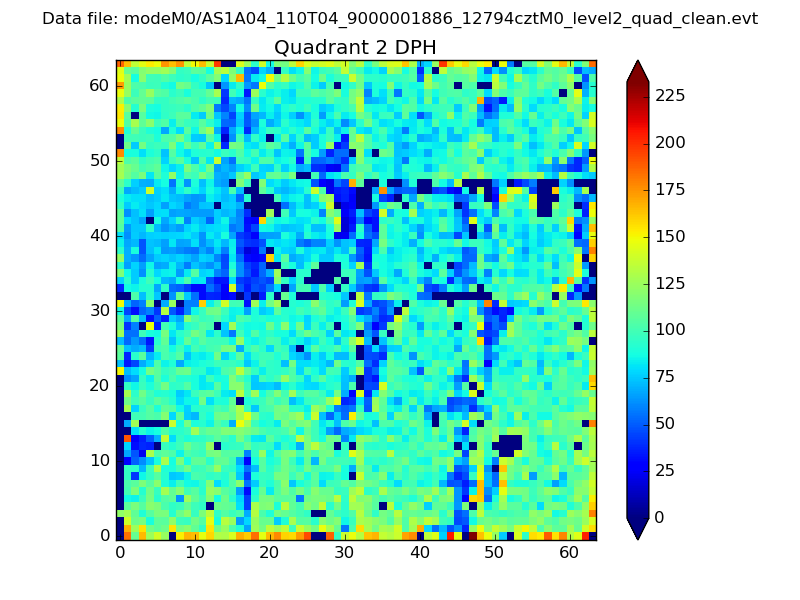 |
Quadrant C |
| Plot type | Count rate plots | Images |
|---|---|---|
| Comparison with Poisson distribution Blue bars denote a histogram of data divided into 1 sec bins. Red curve is a Poisson curve with rate = median count rate of data. |
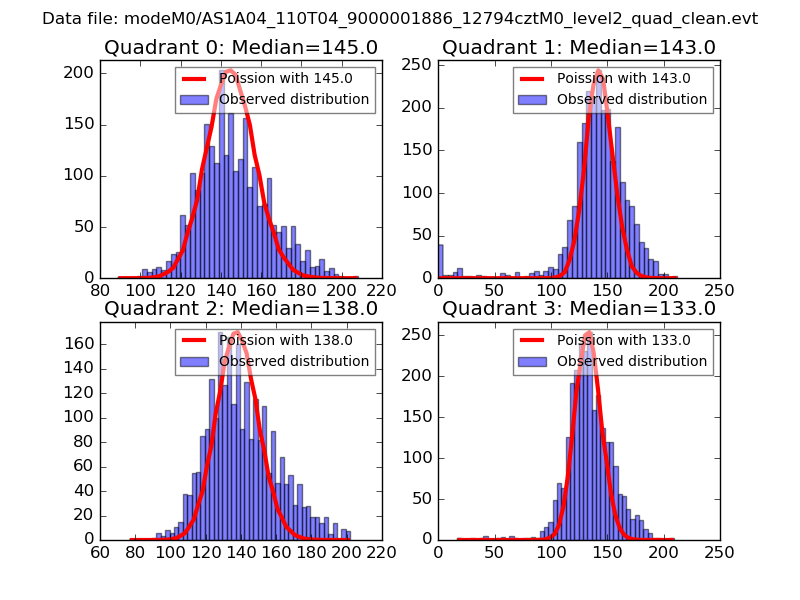 |
 |
| Quadrant-wise count rates Data is divided into 100 sec bins |
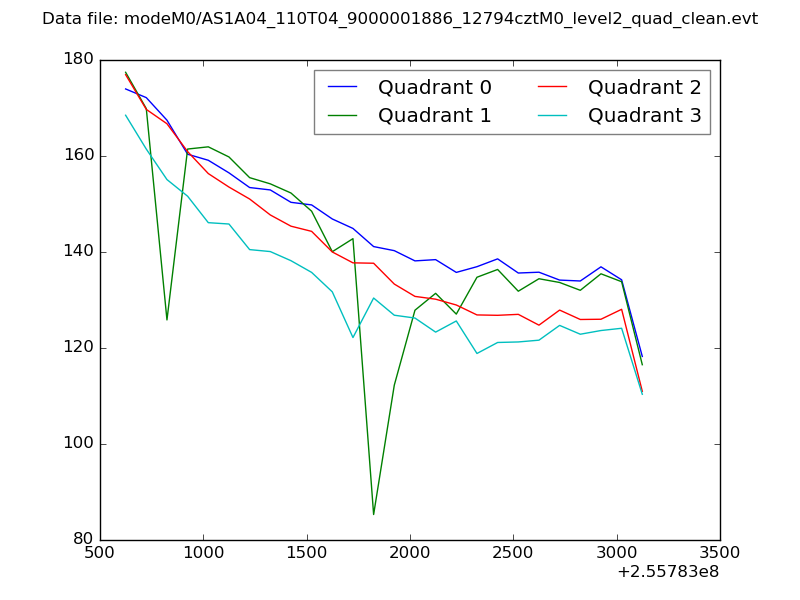 |
|
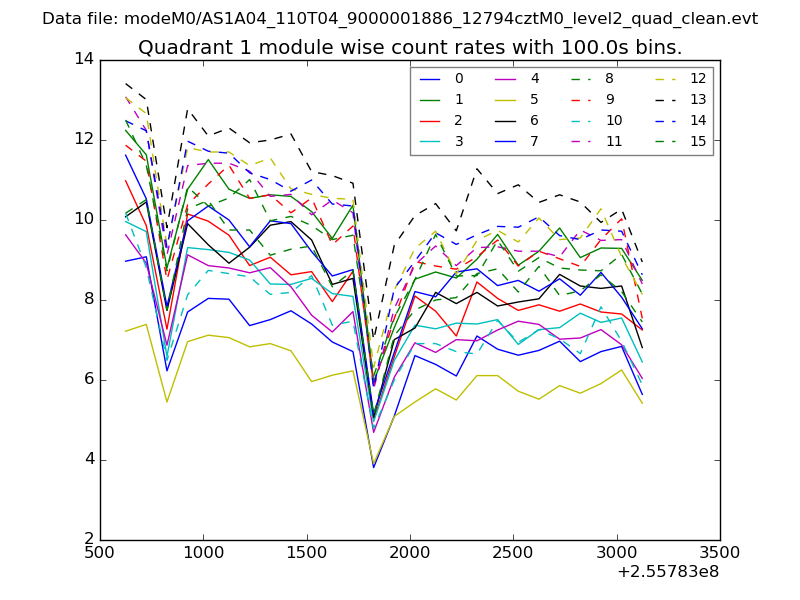
| Module-wise count rates for Quadrant A Data is divided into 100 sec bins |
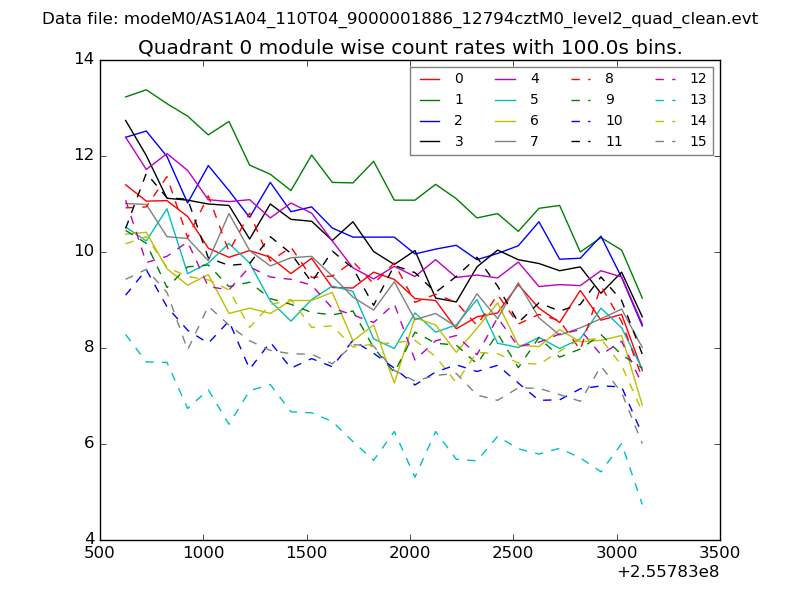 |
 |
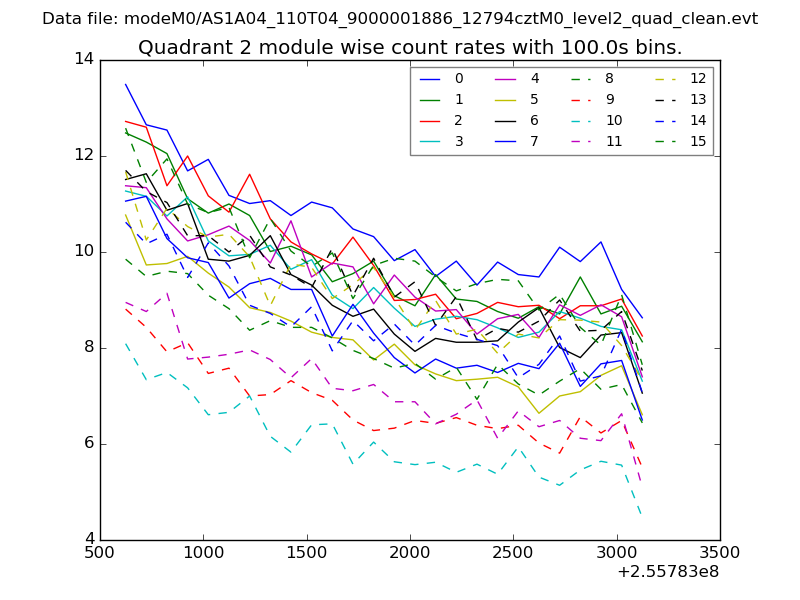
| Module-wise count rates for Quadrant B Data is divided into 100 sec bins |
 |
 |
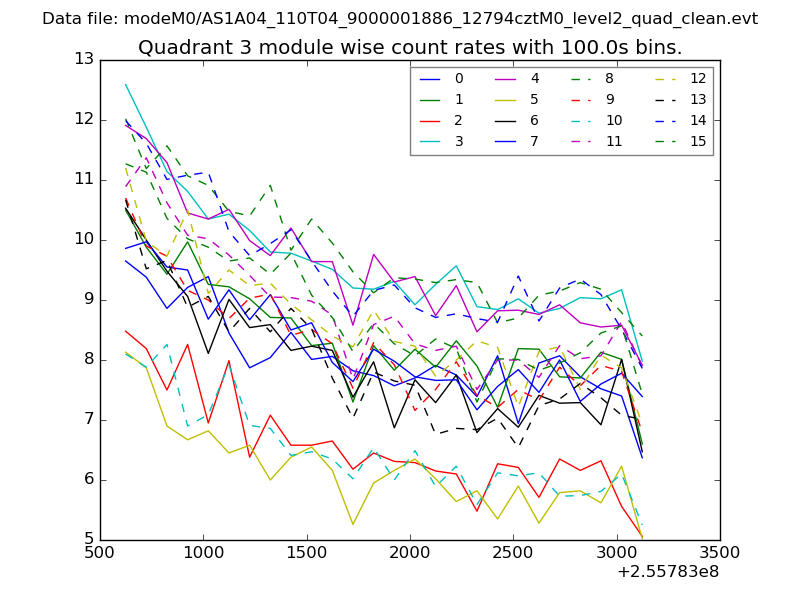
| Module-wise count rates for Quadrant C Data is divided into 100 sec bins |
 |
 |
| Module-wise count rates for Quadrant D Data is divided into 100 sec bins |
 |
 |
| Parameter | Plot |
|---|---|
| CZT HV Monitor | 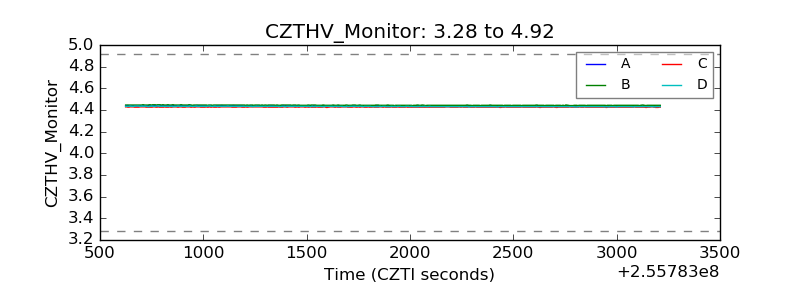 |
| D_VDD | 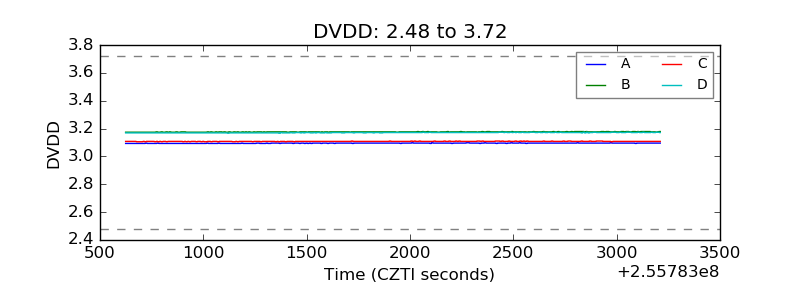 |
| Temperature 1 | 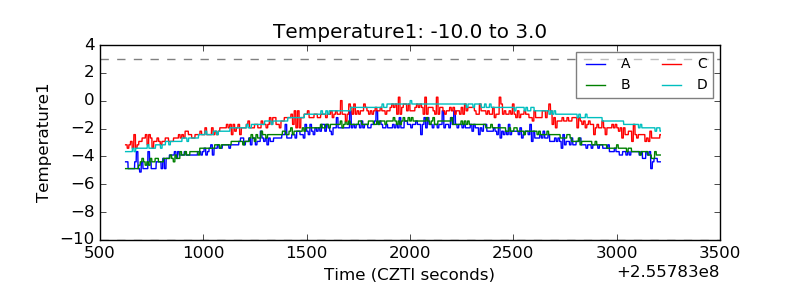 |
| Veto HV Monitor | 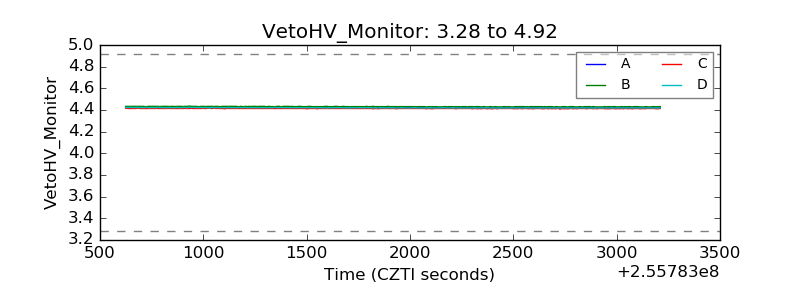 |
| Veto LLD | 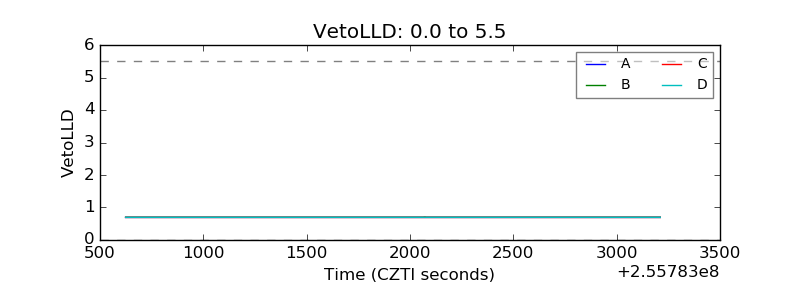 |
| Alpha Counter | 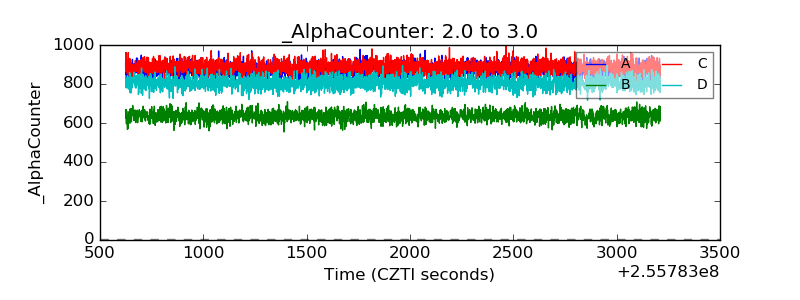 |
| _CPM_Rate | 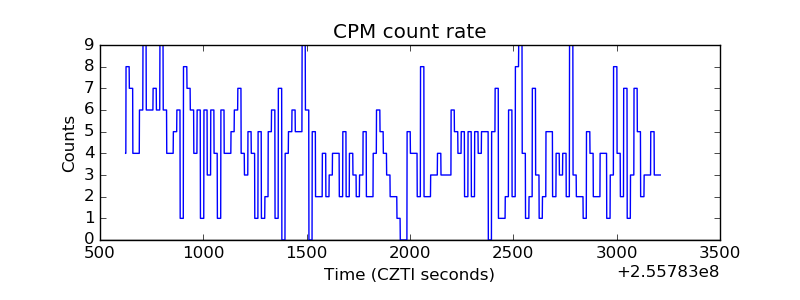 |
| CZT Counter | 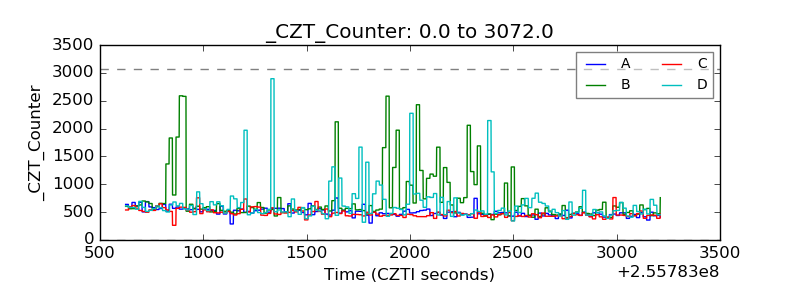 |
| +2.5 Volts monitor |  |
| +5 Volts monitor |  |
| _ROLL_ROT | 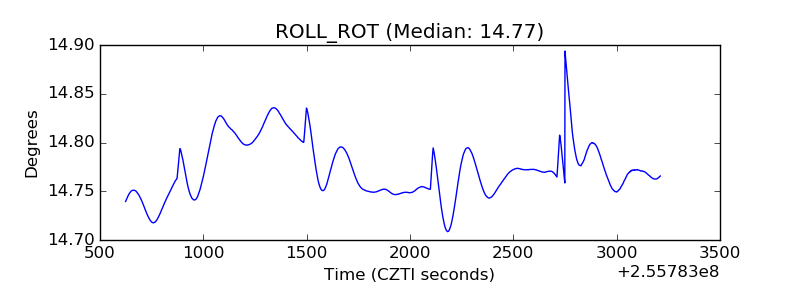 |
| _Roll_DEC | 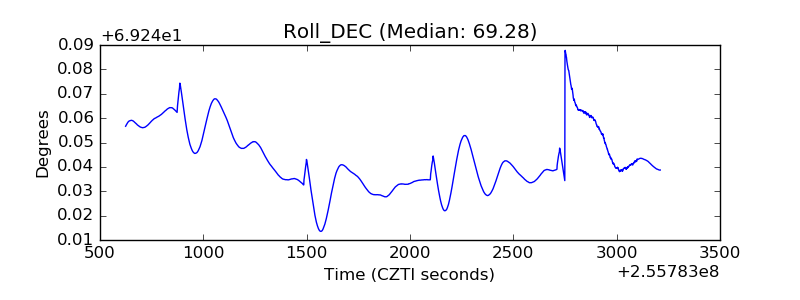 |
| _Roll_RA | 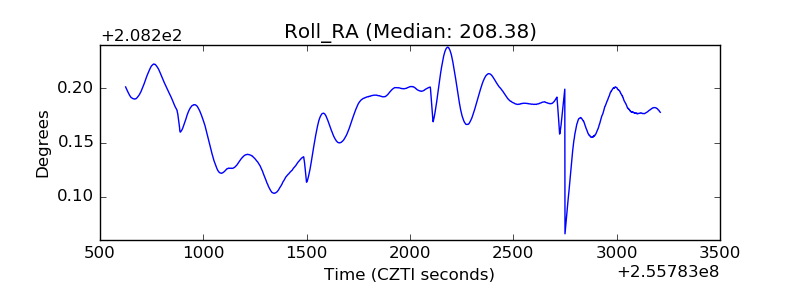 |
| Veto Counter | 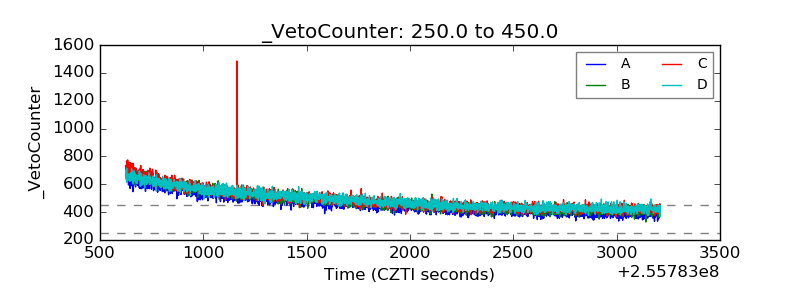 |