| Param | Original file | Final file |
|---|---|---|
| Filename | modeM0/AS1G08_076T01_9000002056_13925cztM0_level2.evt | modeM0/AS1G08_076T01_9000002056_13925cztM0_level2_quad_clean.evt |
| Size (bytes) | 290,643,840 | 51,684,480 |
| Size | 277.2 MB | 49.3 MB |
| Events in quadrant A | 1,861,946 | 311,782 |
| Events in quadrant B | 1,949,144 | 320,589 |
| Events in quadrant C | 1,945,837 | 342,958 |
| Events in quadrant D | 2,779,242 | 314,248 |
| Mode M9 | |||
|---|---|---|---|
| Quadrant | BADHDUFLAG | Total packets | Discarded packets |
| A | 0 | 13 | 0 |
| B | 0 | 13 | 0 |
| C | 0 | 13 | 0 |
| D | 0 | 13 | 0 |
| Mode M0 | |||
|---|---|---|---|
| Quadrant | BADHDUFLAG | Total packets | Discarded packets |
| A | 0 | 8115 | 2 |
| B | 0 | 8411 | 1 |
| C | 0 | 8195 | 1 |
| D | 0 | 10989 | 1 |
| Mode SS | |||
|---|---|---|---|
| Quadrant | BADHDUFLAG | Total packets | Discarded packets |
| A | 0 | 80 | 0 |
| B | 0 | 80 | 0 |
| C | 0 | 80 | 0 |
| D | 0 | 80 | 0 |
| Quadrant | Total seconds | Saturated seconds | Saturation percentage |
|---|---|---|---|
| A | 3898 | 12 | 0.307850% |
| B | 3898 | 31 | 0.795280% |
| C | 3898 | 16 | 0.410467% |
| D | 3898 | 105 | 2.693689% |
Noise dominated data is calculated using 1-second bins in cleaned event files. If a bin has >2000 counts, and if more than 50% of those come from <1% of pixels, then it is considered to be noise-dominated and hence unusable.
| Quadrant | # 1 sec bins | Bins with >0 counts | Bins with >2000 counts | High rate bins dominated by noise | Noise dominated (total time) | Noise dominated (detector-on time) | Marked lightcurve |
|---|---|---|---|---|---|---|---|
| A | 5184 | 3900 | 0 | 0 | 0.00% | 0.00% | 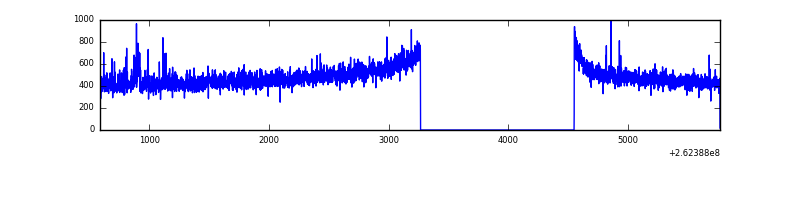 |
| B | 5184 | 3900 | 0 | 0 | 0.00% | 0.00% | 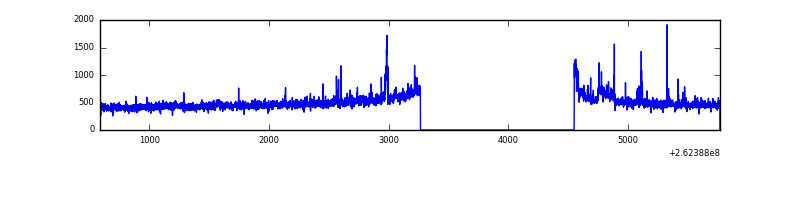 |
| C | 5184 | 3900 | 0 | 0 | 0.00% | 0.00% | 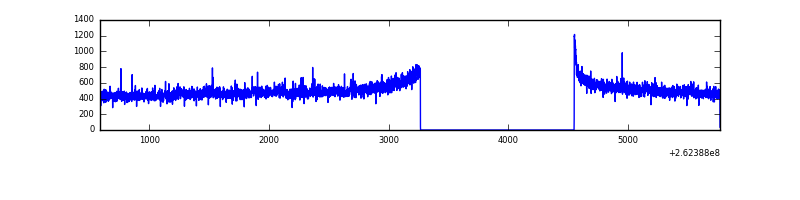 |
| D | 5184 | 3900 | 74 | 74 | 1.43% | 1.90% | 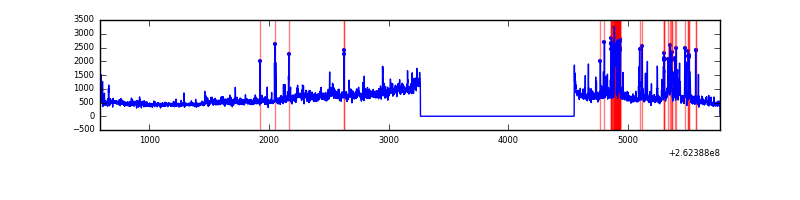 |
Top three noisy pixels from each quadrant. If the there are fewer than three noisy pixels in the level2.evt file, extra rows are filled as -1
| Pixel properties | Quadrant properties | ||||||
|---|---|---|---|---|---|---|---|
| Quadrant | DetID | PixID | Counts | Sigma | Mean | Median | Sigma |
| A | 1 | 162 | 16056 | 162.67 | 470 | 461 | 95.9 |
| A | 11 | 29 | 14568 | 147.15 | 470 | 461 | 95.9 |
| A | 15 | 69 | 5788 | 55.57 | 470 | 461 | 95.9 |
| B | 0 | 189 | 20724 | 224.11 | 473 | 460 | 90.4 |
| B | 12 | 0 | 19376 | 209.2 | 473 | 460 | 90.4 |
| B | 0 | 214 | 15915 | 170.92 | 473 | 460 | 90.4 |
| C | 3 | 233 | 118014 | 1084.21 | 469 | 472 | 108.4 |
| C | 13 | 61 | 3417 | 27.16 | 469 | 472 | 108.4 |
| C | 14 | 234 | 1459 | 9.1 | 469 | 472 | 108.4 |
| D | 13 | 122 | 379748 | 3528.44 | 453 | 443 | 107.5 |
| D | 1 | 52 | 232123 | 2155.18 | 453 | 443 | 107.5 |
| D | 12 | 110 | 109034 | 1010.16 | 453 | 443 | 107.5 |
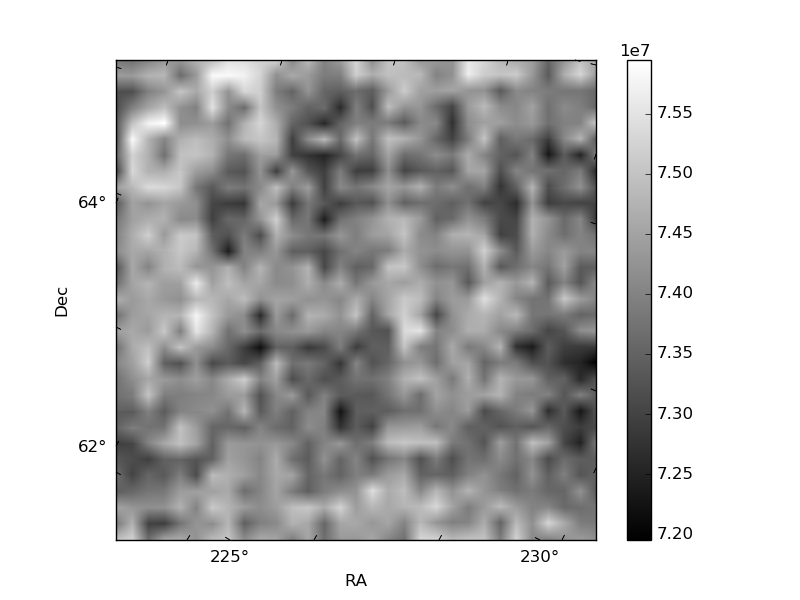
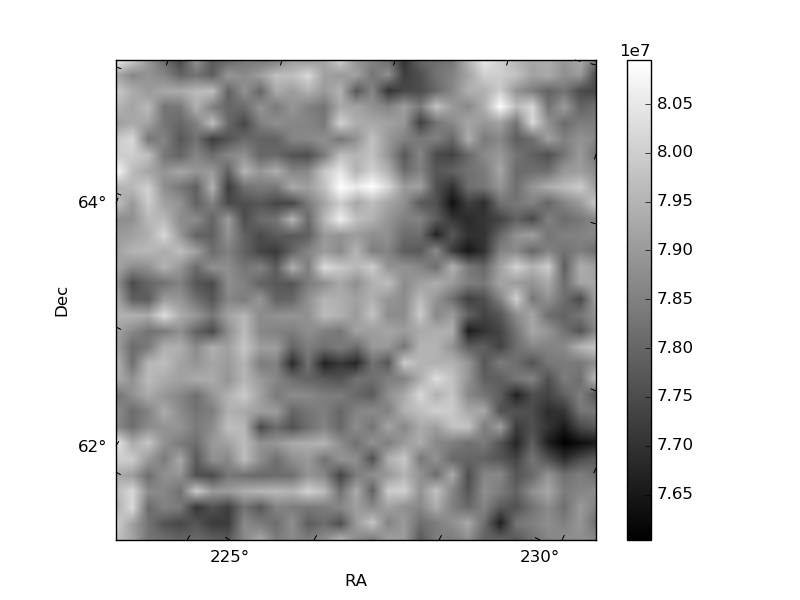
Histogram calculated using DETX and DETY for each event in the final _common_clean file
| Quadrant A | 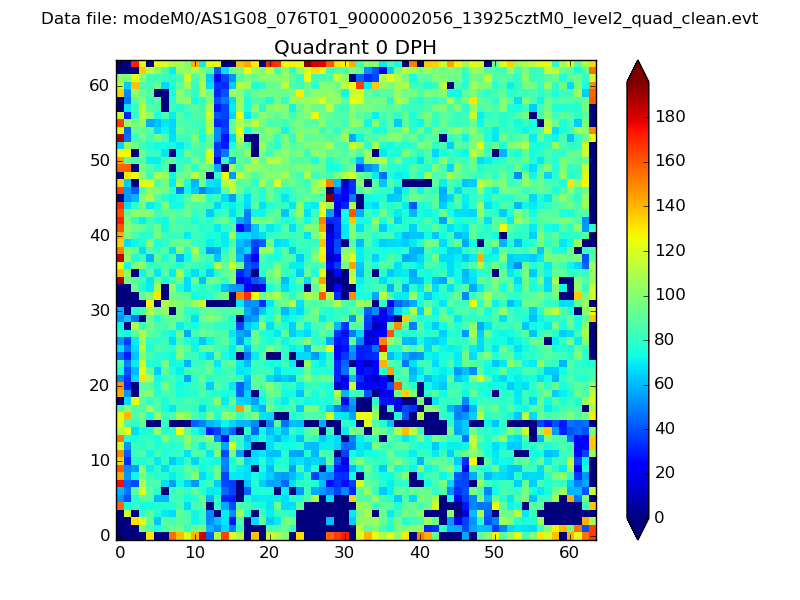 |
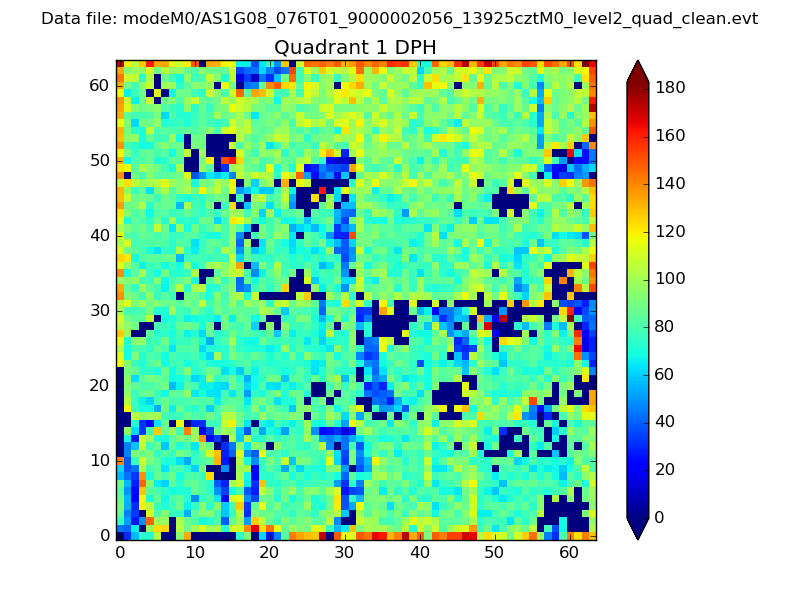 |
Quadrant B |
|---|---|---|---|
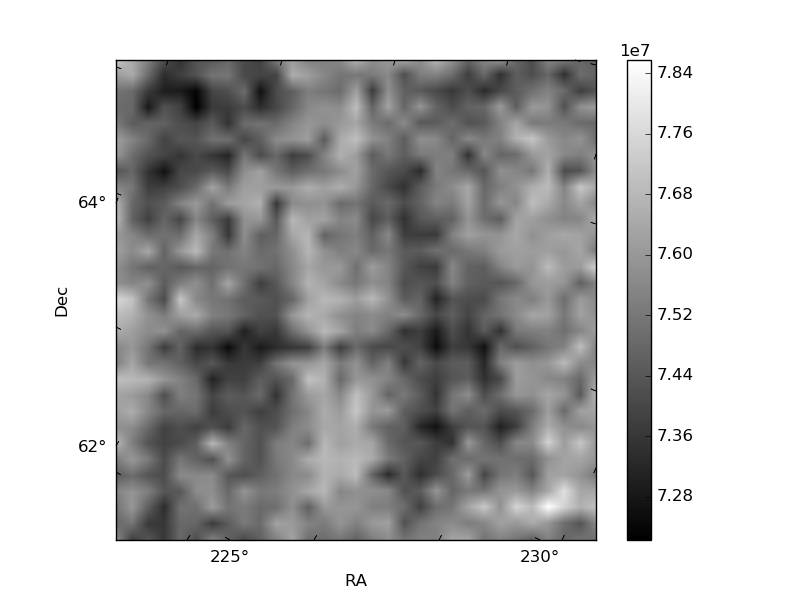
| Quadrant D | 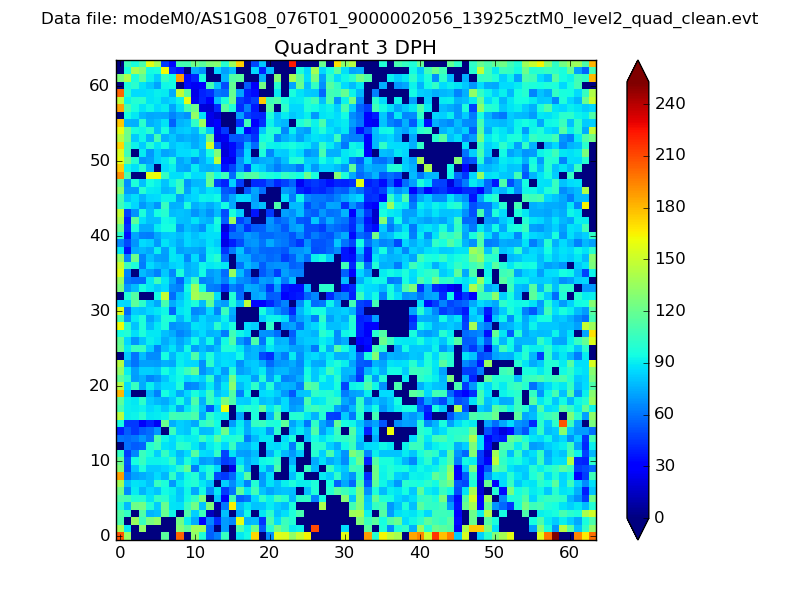 |
 |
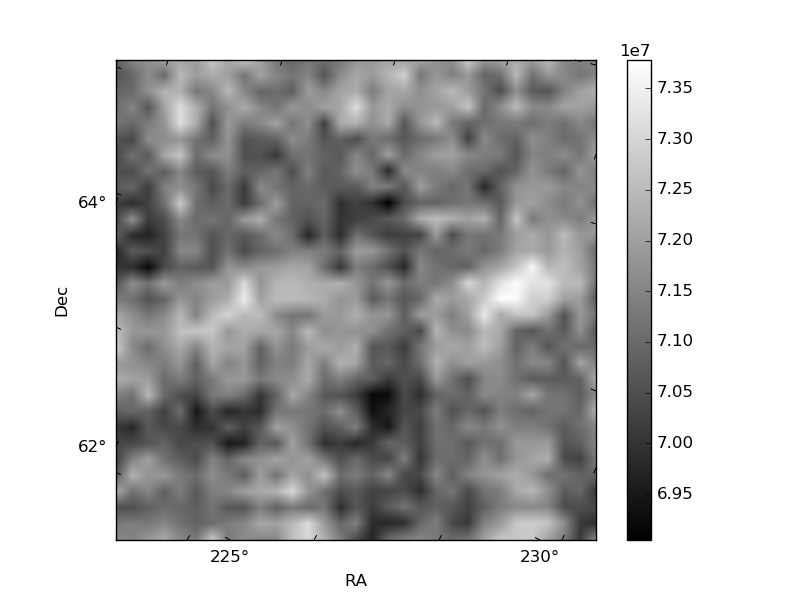
Quadrant C |
| Plot type | Count rate plots | Images |
|---|---|---|
| Comparison with Poisson distribution Blue bars denote a histogram of data divided into 1 sec bins. Red curve is a Poisson curve with rate = median count rate of data. |
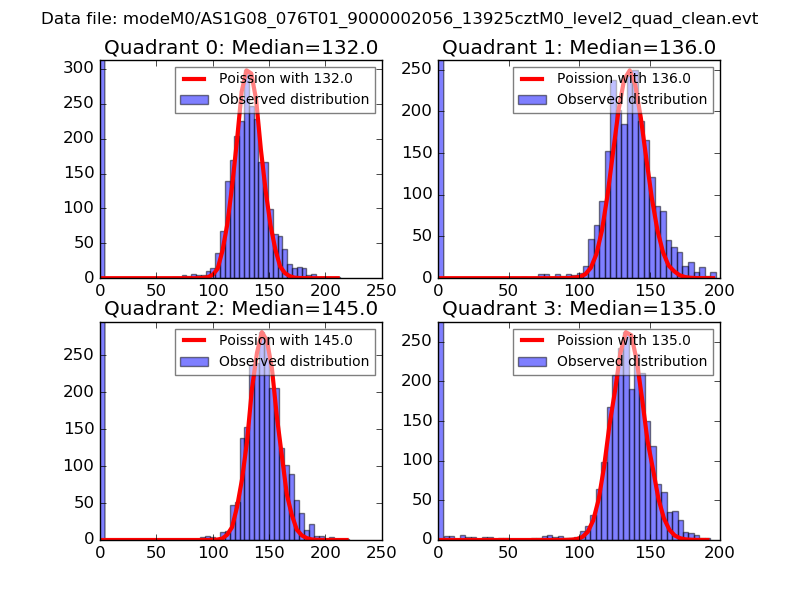 |
 |
| Quadrant-wise count rates Data is divided into 100 sec bins |
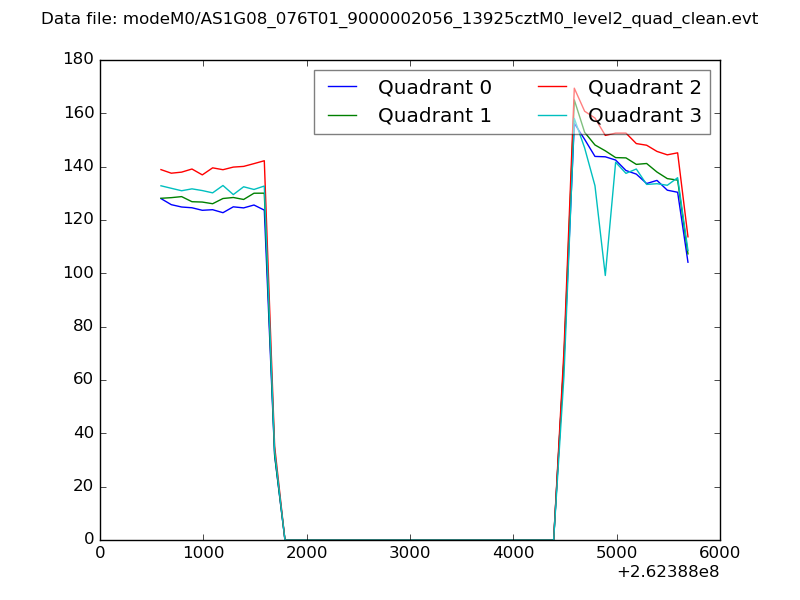 |
|
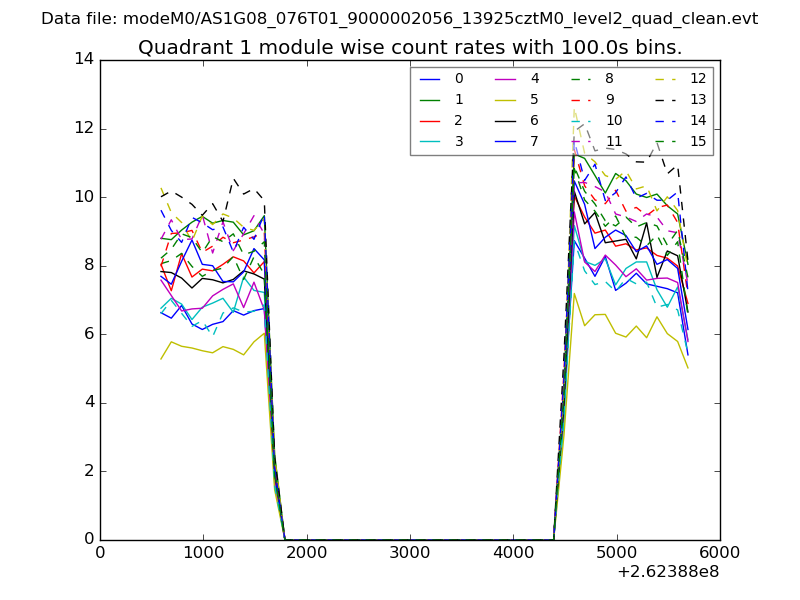
| Module-wise count rates for Quadrant A Data is divided into 100 sec bins |
 |
 |
| Module-wise count rates for Quadrant B Data is divided into 100 sec bins |
 |
 |
| Module-wise count rates for Quadrant C Data is divided into 100 sec bins |
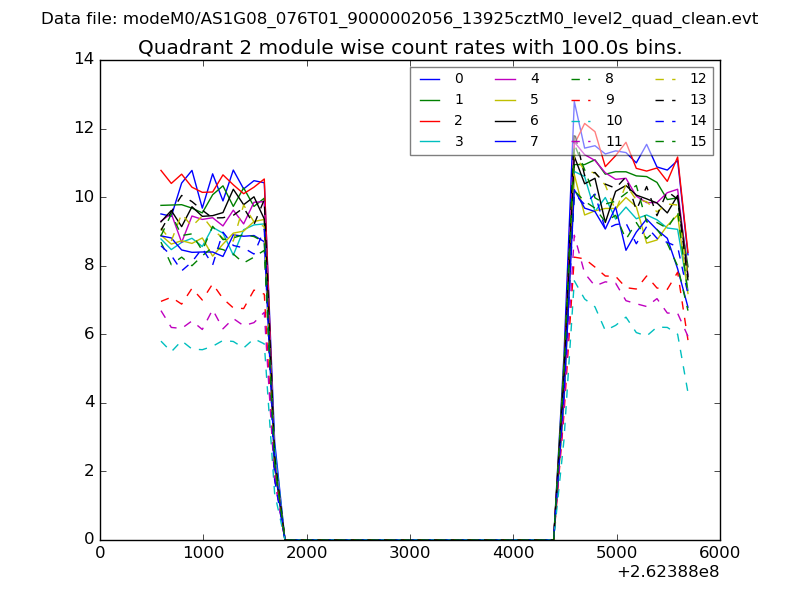 |
 |
| Module-wise count rates for Quadrant D Data is divided into 100 sec bins |
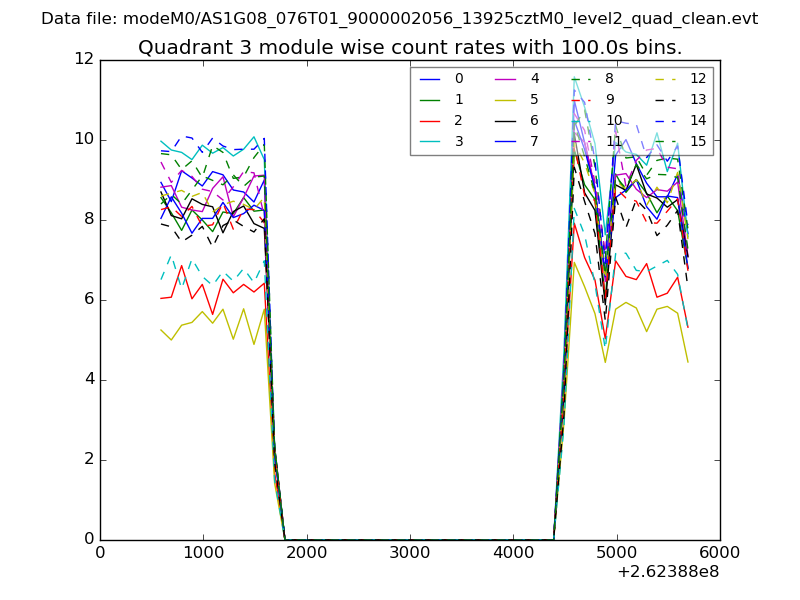 |
 |
| Parameter | Plot |
|---|---|
| CZT HV Monitor | 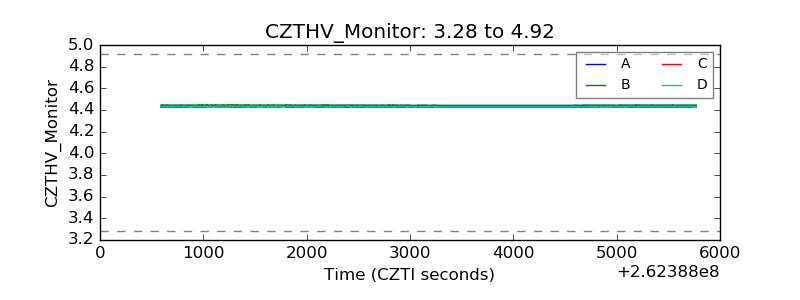 |
| D_VDD | 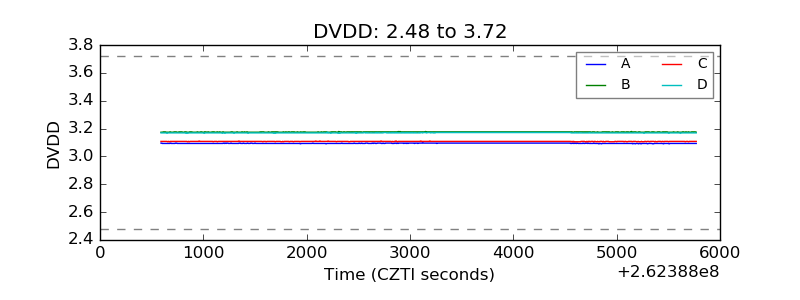 |
| Temperature 1 | 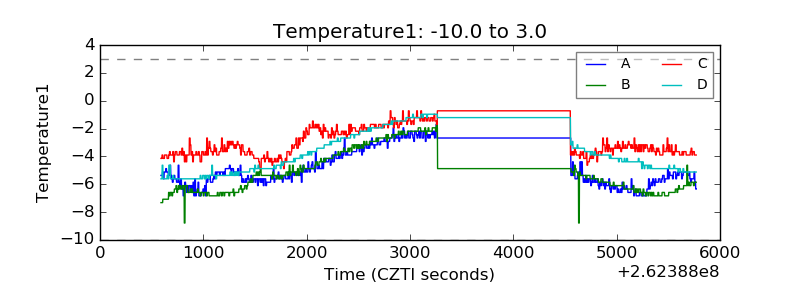 |
| Veto HV Monitor | 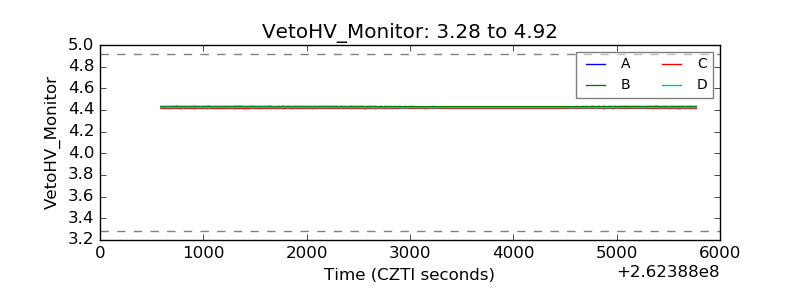 |
| Veto LLD | 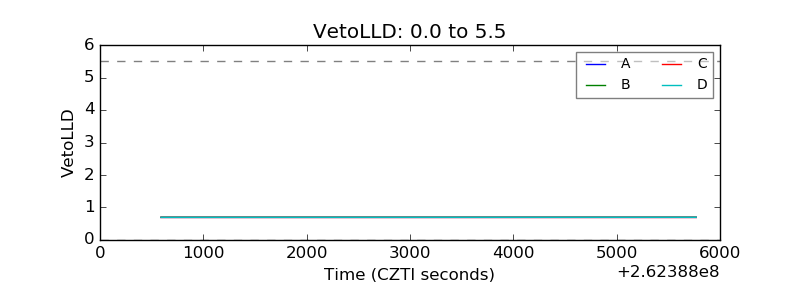 |
| Alpha Counter | 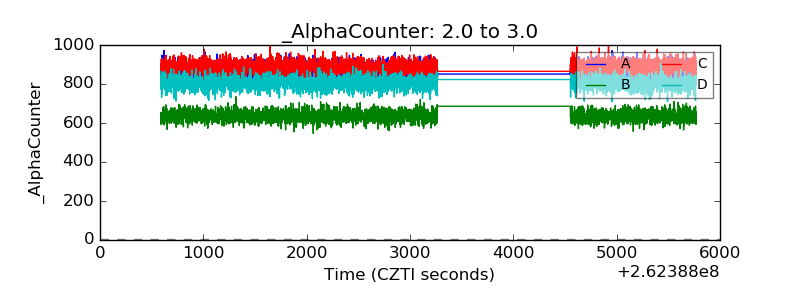 |
| _CPM_Rate | 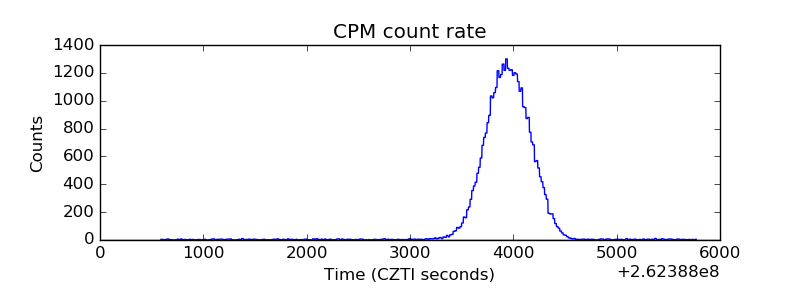 |
| CZT Counter |  |
| +2.5 Volts monitor |  |
| +5 Volts monitor | 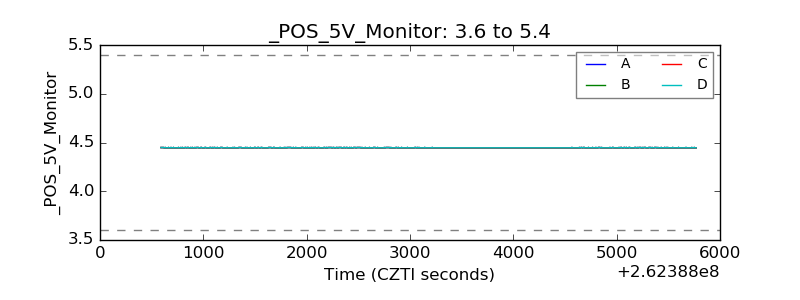 |
| _ROLL_ROT | 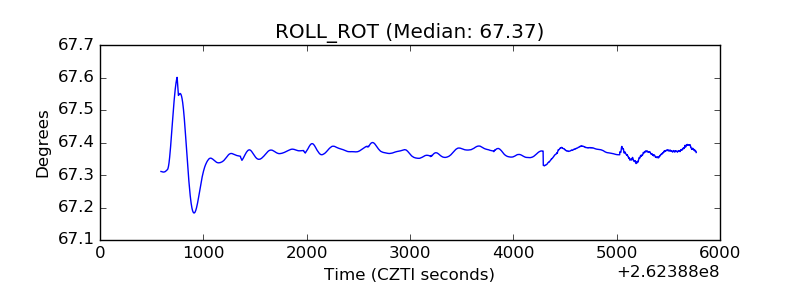 |
| _Roll_DEC | 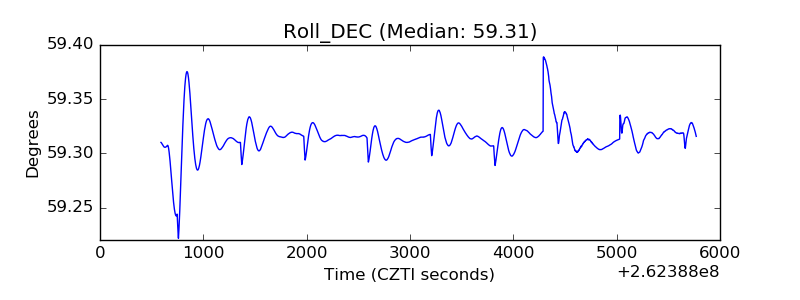 |
| _Roll_RA |  |
| Veto Counter | 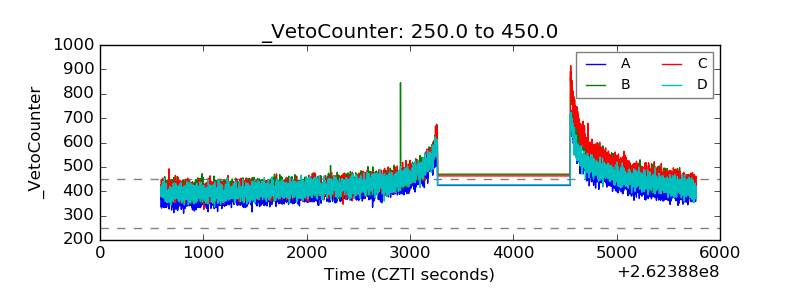 |