| Param | Original file | Final file |
|---|---|---|
| Filename | modeM0/AS1G08_076T01_9000002056_13930cztM0_level2.evt | modeM0/AS1G08_076T01_9000002056_13930cztM0_level2_quad_clean.evt |
| Size (bytes) | 324,898,560 | 55,961,280 |
| Size | 309.8 MB | 53.4 MB |
| Events in quadrant A | 2,050,562 | 337,813 |
| Events in quadrant B | 2,151,783 | 342,162 |
| Events in quadrant C | 2,097,962 | 357,046 |
| Events in quadrant D | 3,226,301 | 334,817 |
| Mode M9 | |||
|---|---|---|---|
| Quadrant | BADHDUFLAG | Total packets | Discarded packets |
| A | 0 | 2 | 0 |
| B | 0 | 2 | 0 |
| C | 0 | 2 | 0 |
| D | 0 | 2 | 0 |
| Mode M0 | |||
|---|---|---|---|
| Quadrant | BADHDUFLAG | Total packets | Discarded packets |
| A | 0 | 9429 | 1 |
| B | 0 | 9595 | 1 |
| C | 0 | 9455 | 1 |
| D | 0 | 12637 | 1 |
| Mode SS | |||
|---|---|---|---|
| Quadrant | BADHDUFLAG | Total packets | Discarded packets |
| A | 0 | 94 | 0 |
| B | 0 | 94 | 0 |
| C | 0 | 94 | 0 |
| D | 0 | 94 | 0 |
| Quadrant | Total seconds | Saturated seconds | Saturation percentage |
|---|---|---|---|
| A | 4590 | 147 | 3.202614% |
| B | 4590 | 166 | 3.616558% |
| C | 4590 | 98 | 2.135076% |
| D | 4590 | 243 | 5.294118% |
Noise dominated data is calculated using 1-second bins in cleaned event files. If a bin has >2000 counts, and if more than 50% of those come from <1% of pixels, then it is considered to be noise-dominated and hence unusable.
| Quadrant | # 1 sec bins | Bins with >0 counts | Bins with >2000 counts | High rate bins dominated by noise | Noise dominated (total time) | Noise dominated (detector-on time) | Marked lightcurve |
|---|---|---|---|---|---|---|---|
| A | 4721 | 4592 | 0 | 0 | 0.00% | 0.00% | 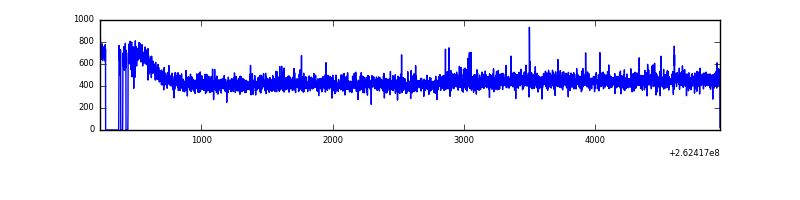 |
| B | 4721 | 4592 | 0 | 0 | 0.00% | 0.00% | 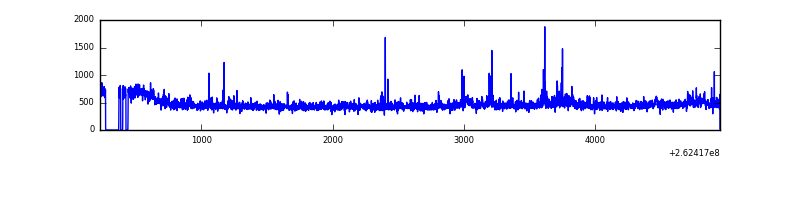 |
| C | 4721 | 4592 | 0 | 0 | 0.00% | 0.00% | 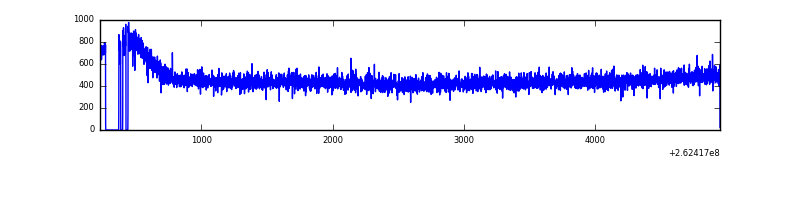 |
| D | 4721 | 4592 | 120 | 120 | 2.54% | 2.61% | 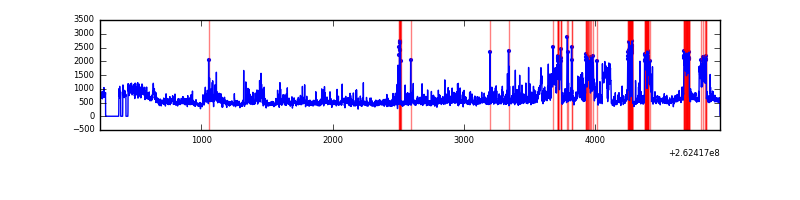 |
Top three noisy pixels from each quadrant. If the there are fewer than three noisy pixels in the level2.evt file, extra rows are filled as -1
| Pixel properties | Quadrant properties | ||||||
|---|---|---|---|---|---|---|---|
| Quadrant | DetID | PixID | Counts | Sigma | Mean | Median | Sigma |
| A | 1 | 162 | 11447 | 99.99 | 527 | 514 | 109.3 |
| A | 0 | 226 | 4785 | 39.06 | 527 | 514 | 109.3 |
| A | 12 | 194 | 4115 | 32.93 | 527 | 514 | 109.3 |
| B | 0 | 189 | 31230 | 303.07 | 525 | 510 | 101.4 |
| B | 10 | 245 | 20878 | 200.94 | 525 | 510 | 101.4 |
| B | 0 | 214 | 19378 | 186.15 | 525 | 510 | 101.4 |
| C | 3 | 233 | 80875 | 665.94 | 517 | 518 | 120.7 |
| C | 13 | 61 | 3676 | 26.17 | 517 | 518 | 120.7 |
| C | 12 | 4 | 1206 | 5.7 | 517 | 518 | 120.7 |
| D | 1 | 52 | 727893 | 5963.2 | 509 | 494 | 122.0 |
| D | 12 | 110 | 294982 | 2414.21 | 509 | 494 | 122.0 |
| D | 13 | 189 | 107088 | 873.86 | 509 | 494 | 122.0 |
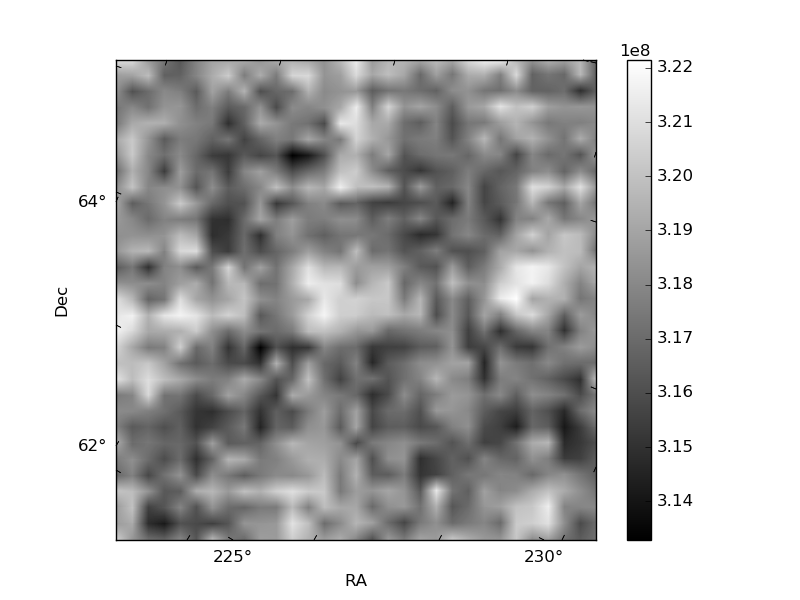
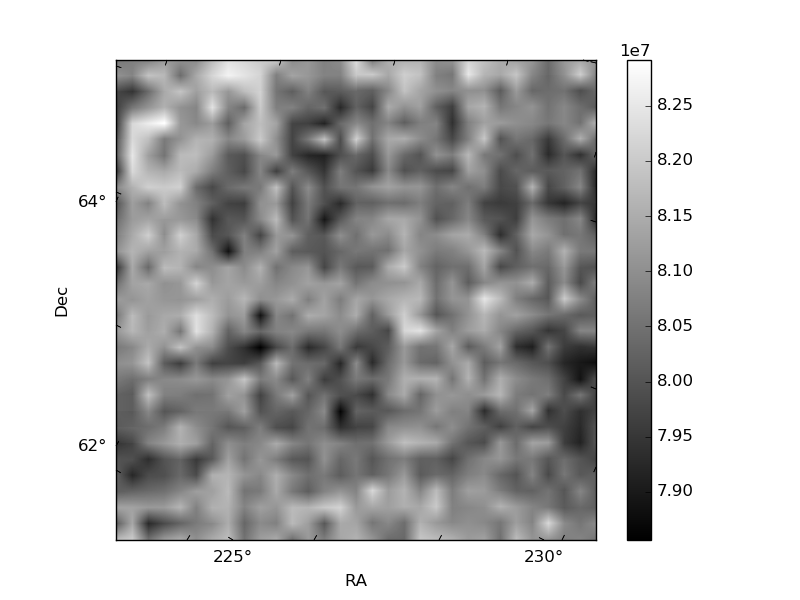
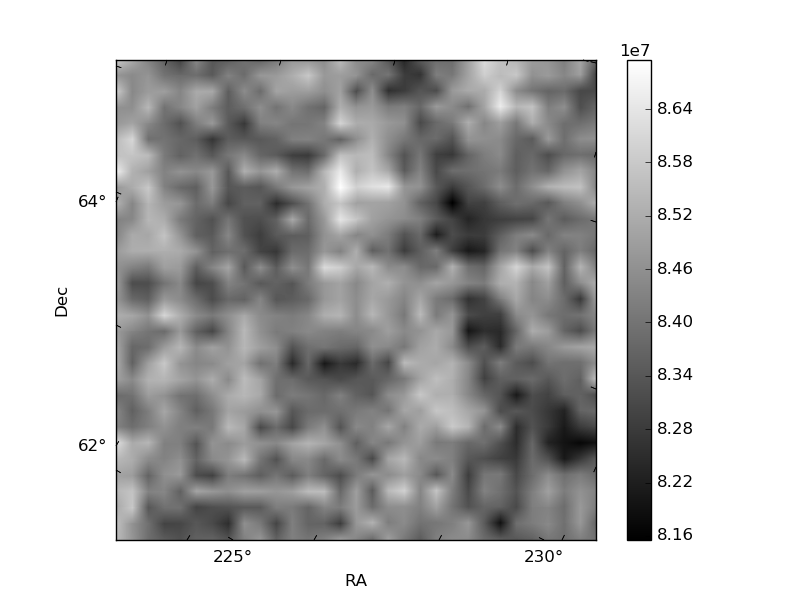
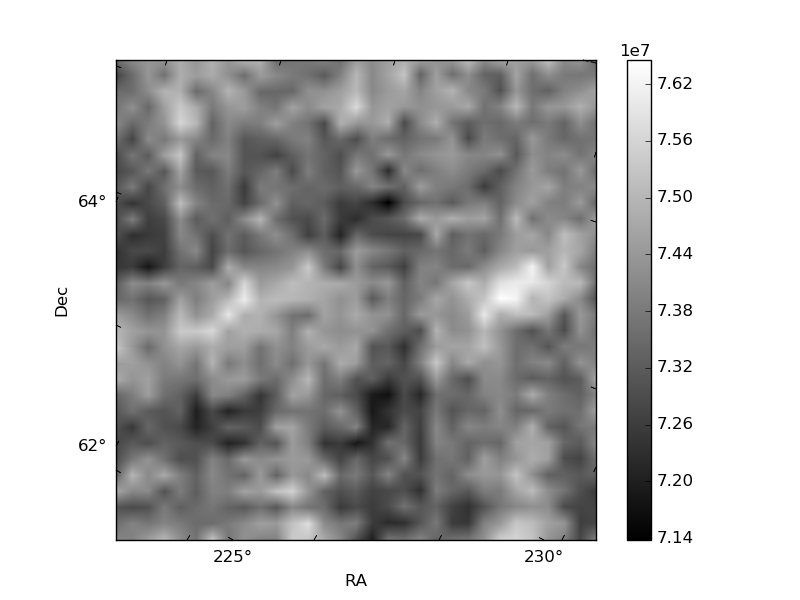
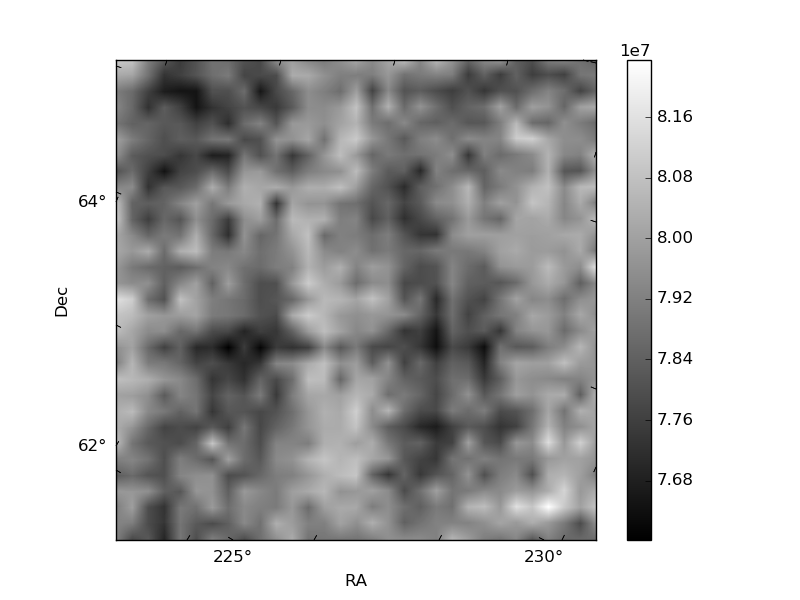
Histogram calculated using DETX and DETY for each event in the final _common_clean file
| Quadrant A | 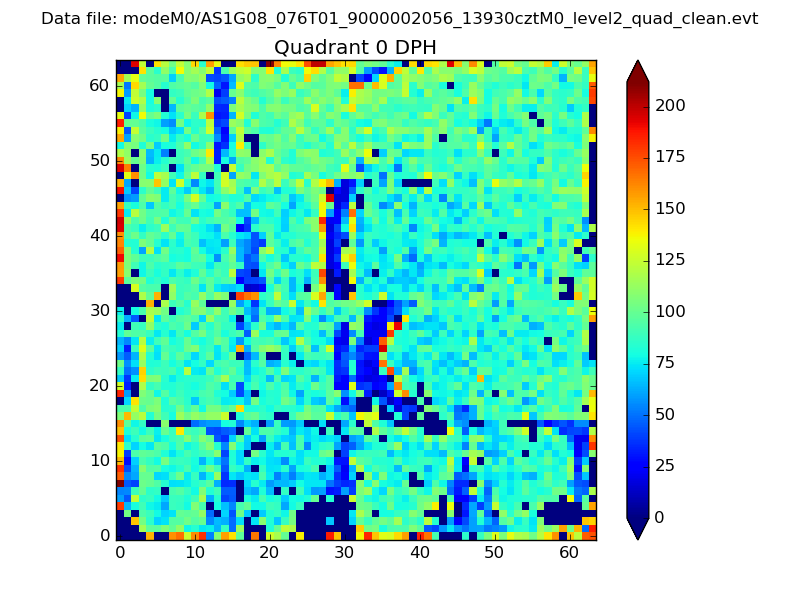 |
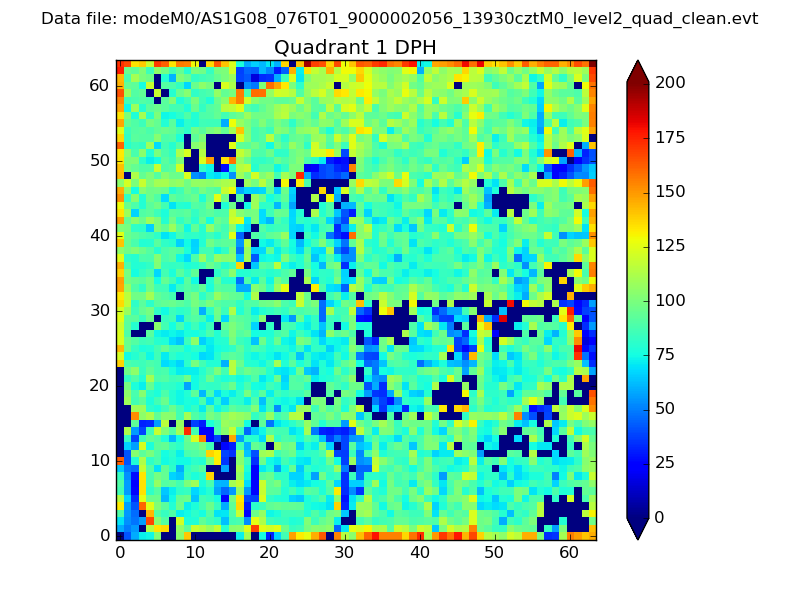 |
Quadrant B |
|---|---|---|---|
| Quadrant D | 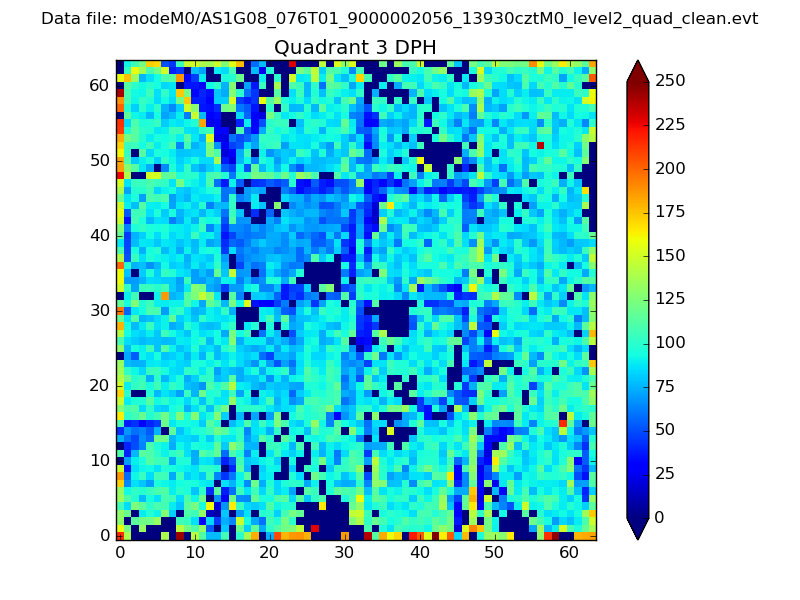 |
 |
Quadrant C |
| Plot type | Count rate plots | Images |
|---|---|---|
| Comparison with Poisson distribution Blue bars denote a histogram of data divided into 1 sec bins. Red curve is a Poisson curve with rate = median count rate of data. |
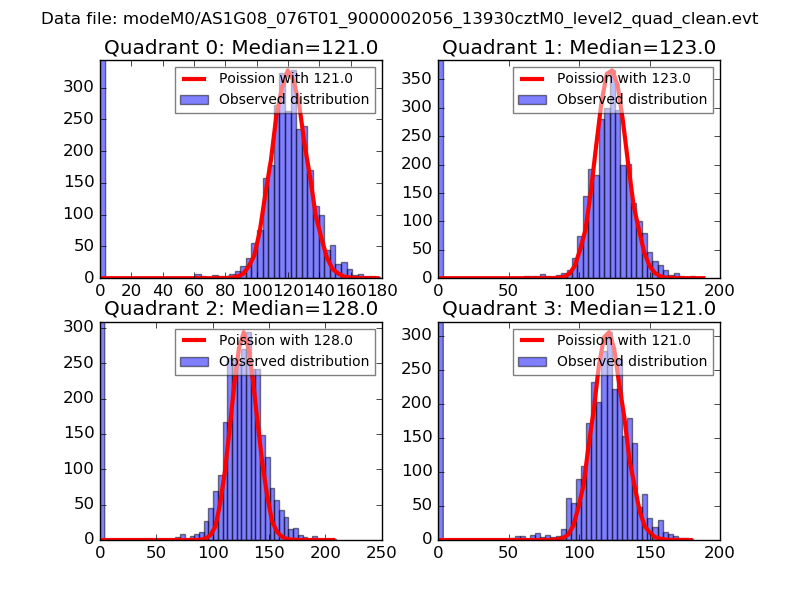 |
 |
| Quadrant-wise count rates Data is divided into 100 sec bins |
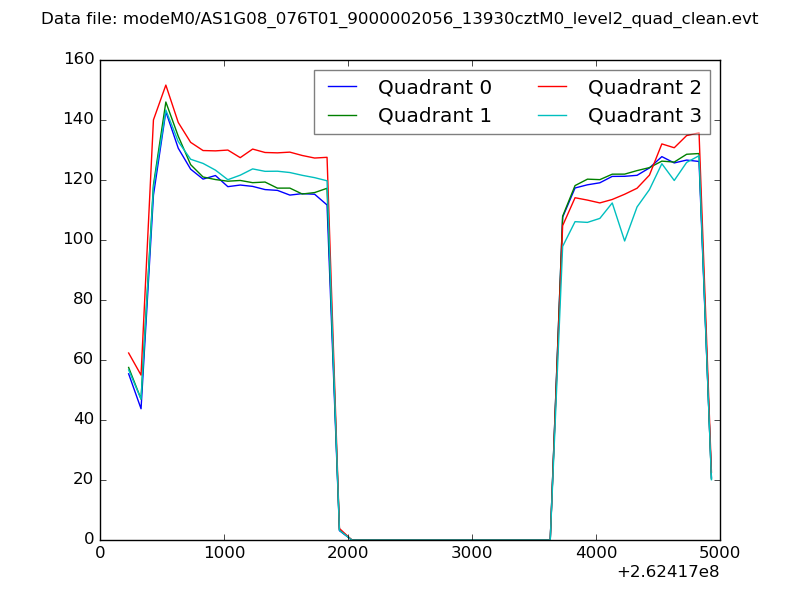 |
|
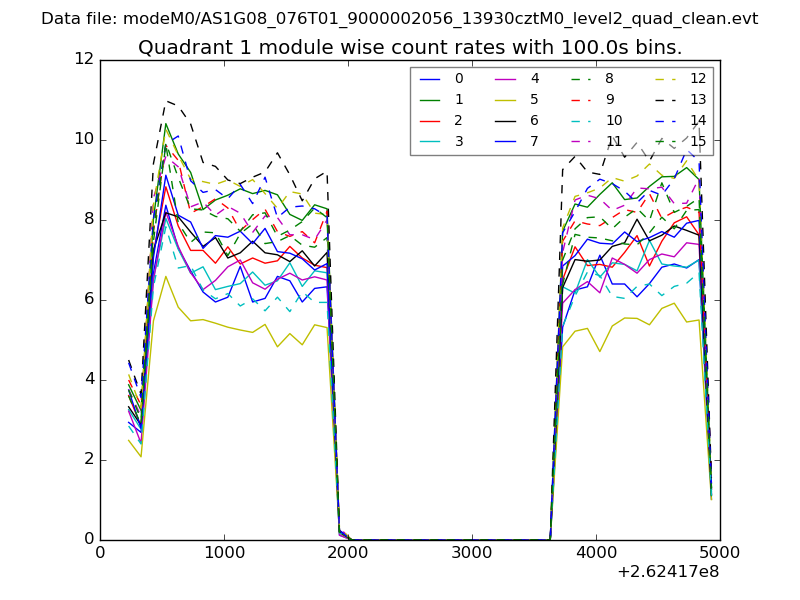
| Module-wise count rates for Quadrant A Data is divided into 100 sec bins |
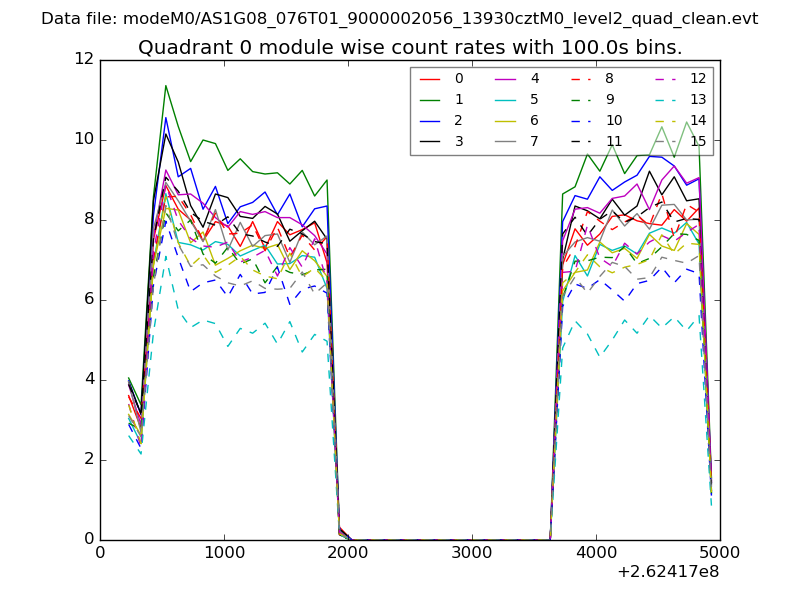 |
 |
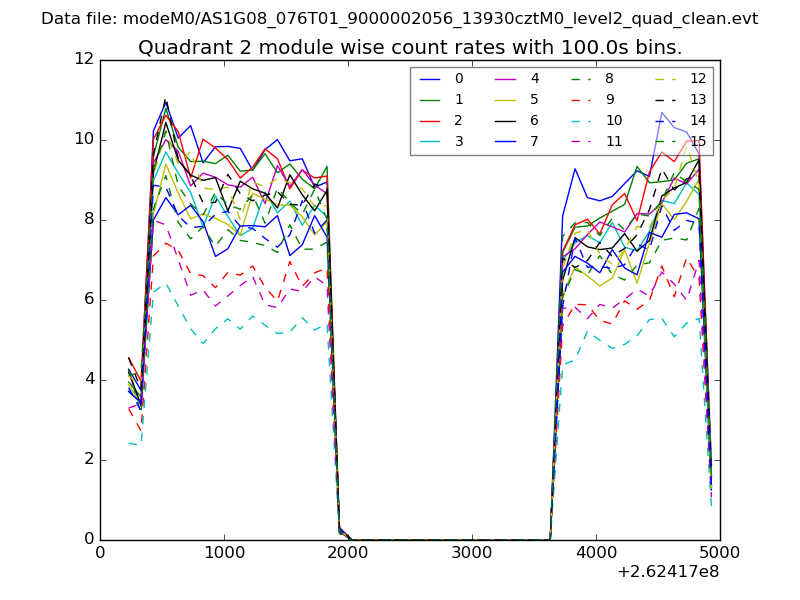
| Module-wise count rates for Quadrant B Data is divided into 100 sec bins |
 |
 |
| Module-wise count rates for Quadrant C Data is divided into 100 sec bins |
 |
 |
| Module-wise count rates for Quadrant D Data is divided into 100 sec bins |
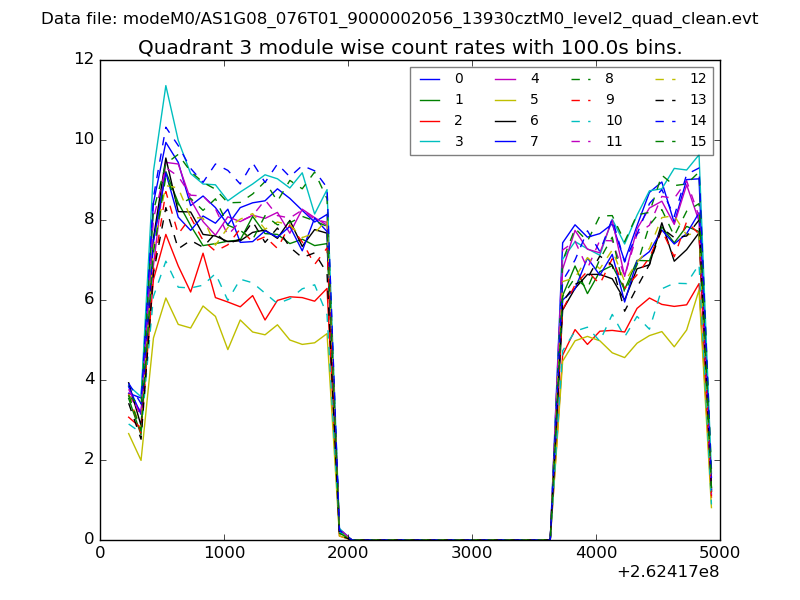 |
 |
| Parameter | Plot |
|---|---|
| CZT HV Monitor | 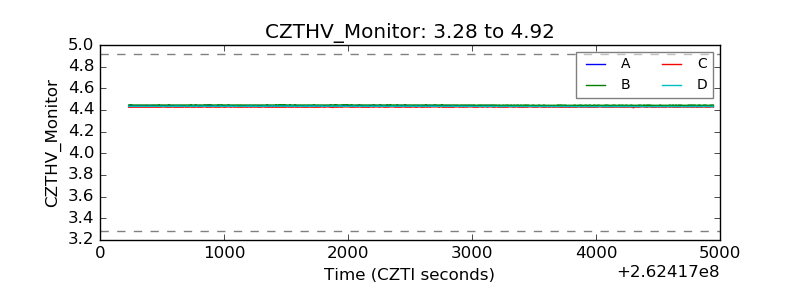 |
| D_VDD | 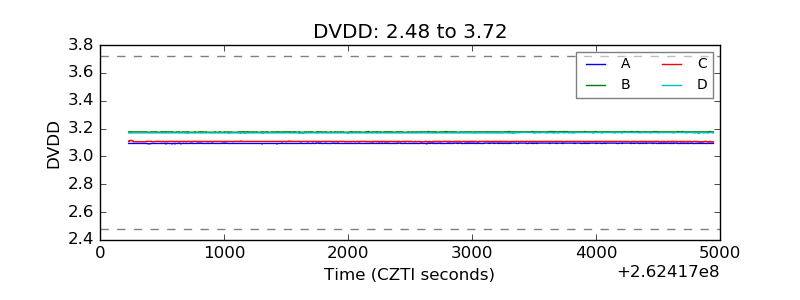 |
| Temperature 1 |  |
| Veto HV Monitor | 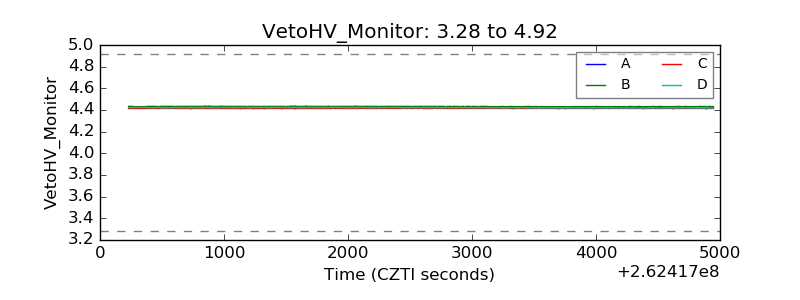 |
| Veto LLD |  |
| Alpha Counter | 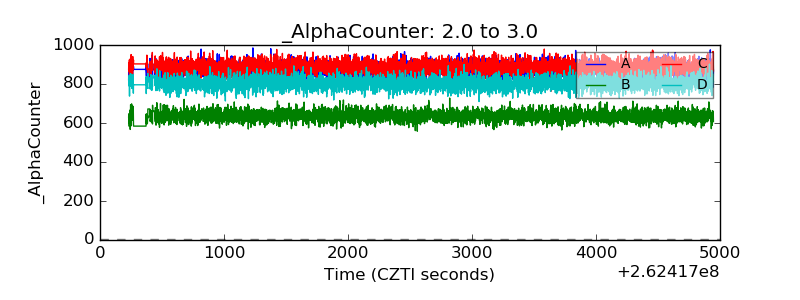 |
| _CPM_Rate | 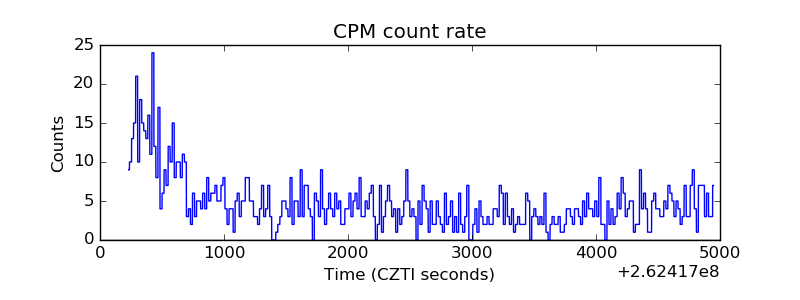 |
| CZT Counter | 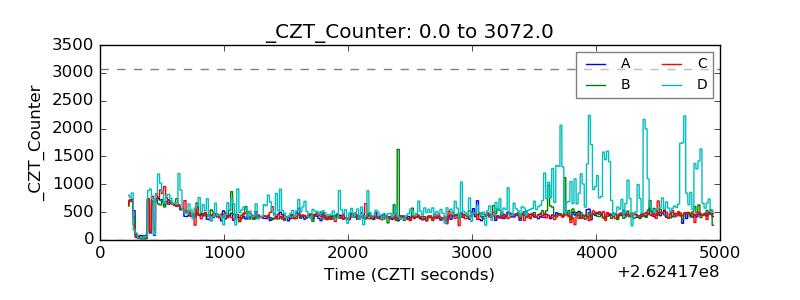 |
| +2.5 Volts monitor |  |
| +5 Volts monitor | 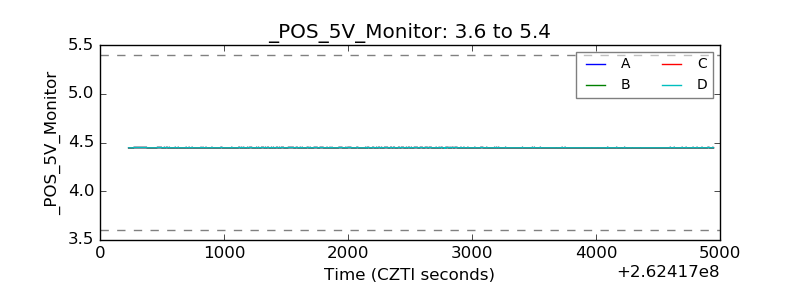 |
| _ROLL_ROT | 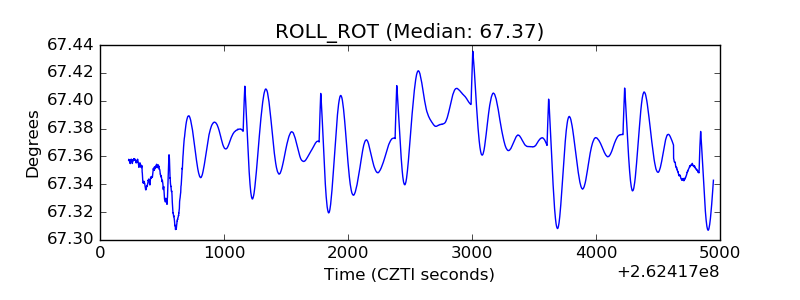 |
| _Roll_DEC | 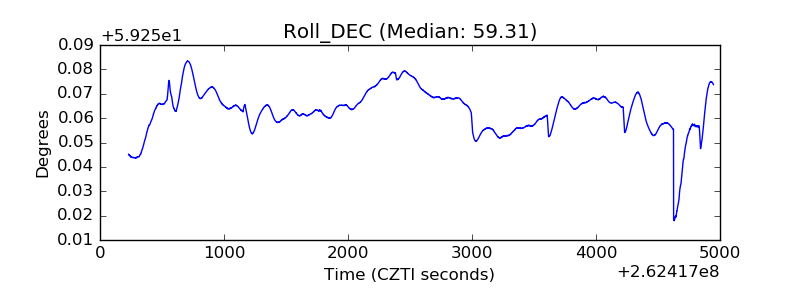 |
| _Roll_RA |  |
| Veto Counter | 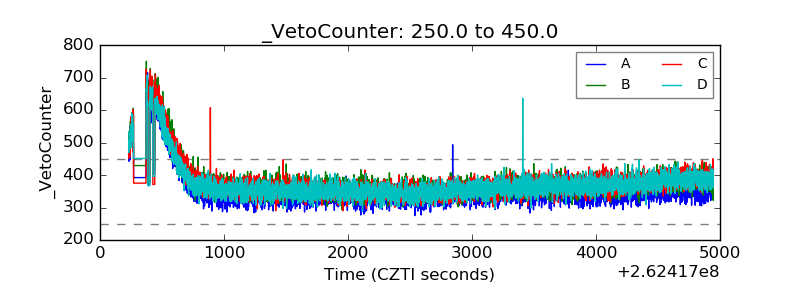 |