| Param | Original file | Final file |
|---|---|---|
| Filename | modeM0/AS1G08_002T01_9000002072_14038cztM0_level2.evt | modeM0/AS1G08_002T01_9000002072_14038cztM0_level2_quad_clean.evt |
| Size (bytes) | 318,781,440 | 67,691,520 |
| Size | 304.0 MB | 64.6 MB |
| Events in quadrant A | 2,158,047 | 444,468 |
| Events in quadrant B | 2,166,437 | 446,501 |
| Events in quadrant C | 2,160,286 | 439,787 |
| Events in quadrant D | 2,883,183 | 423,127 |
| Mode M9 | |||
|---|---|---|---|
| Quadrant | BADHDUFLAG | Total packets | Discarded packets |
| A | 0 | 11 | 0 |
| B | 0 | 11 | 0 |
| C | 0 | 11 | 0 |
| D | 0 | 11 | 0 |
| Mode SS | |||
|---|---|---|---|
| Quadrant | BADHDUFLAG | Total packets | Discarded packets |
| A | 0 | 86 | 0 |
| B | 0 | 86 | 0 |
| C | 0 | 86 | 0 |
| D | 0 | 86 | 0 |
| Mode M0 | |||
|---|---|---|---|
| Quadrant | BADHDUFLAG | Total packets | Discarded packets |
| A | 0 | 9067 | 1 |
| B | 0 | 9061 | 1 |
| C | 0 | 8948 | 1 |
| D | 0 | 11103 | 1 |
| Quadrant | Total seconds | Saturated seconds | Saturation percentage |
|---|---|---|---|
| A | 4200 | 74 | 1.761905% |
| B | 4200 | 75 | 1.785714% |
| C | 4200 | 59 | 1.404762% |
| D | 4200 | 191 | 4.547619% |
Noise dominated data is calculated using 1-second bins in cleaned event files. If a bin has >2000 counts, and if more than 50% of those come from <1% of pixels, then it is considered to be noise-dominated and hence unusable.
| Quadrant | # 1 sec bins | Bins with >0 counts | Bins with >2000 counts | High rate bins dominated by noise | Noise dominated (total time) | Noise dominated (detector-on time) | Marked lightcurve |
|---|---|---|---|---|---|---|---|
| A | 5326 | 4202 | 0 | 0 | 0.00% | 0.00% | 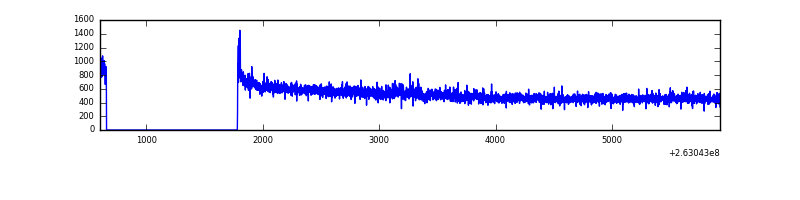 |
| B | 5326 | 4202 | 0 | 0 | 0.00% | 0.00% | 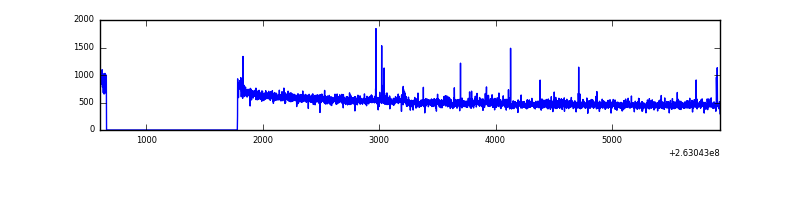 |
| C | 5326 | 4202 | 0 | 0 | 0.00% | 0.00% | 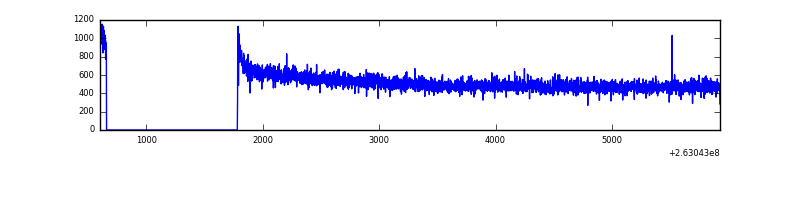 |
| D | 5326 | 4202 | 142 | 142 | 2.67% | 3.38% | 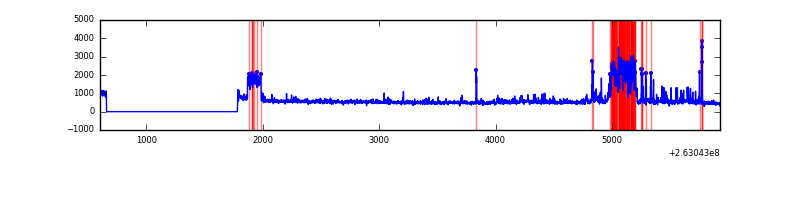 |
Top three noisy pixels from each quadrant. If the there are fewer than three noisy pixels in the level2.evt file, extra rows are filled as -1
| Pixel properties | Quadrant properties | ||||||
|---|---|---|---|---|---|---|---|
| Quadrant | DetID | PixID | Counts | Sigma | Mean | Median | Sigma |
| A | 1 | 162 | 15665 | 134.29 | 552 | 541 | 112.6 |
| A | 1 | 178 | 6502 | 52.93 | 552 | 541 | 112.6 |
| A | 14 | 111 | 6389 | 51.92 | 552 | 541 | 112.6 |
| B | 0 | 214 | 16578 | 154.23 | 542 | 531 | 104.0 |
| B | 3 | 209 | 12737 | 117.31 | 542 | 531 | 104.0 |
| B | 12 | 111 | 12035 | 110.56 | 542 | 531 | 104.0 |
| C | 3 | 233 | 68893 | 547.74 | 536 | 540 | 124.8 |
| C | 13 | 61 | 3778 | 25.95 | 536 | 540 | 124.8 |
| C | 14 | 220 | 2752 | 17.73 | 536 | 540 | 124.8 |
| D | 13 | 104 | 416491 | 3288.99 | 533 | 522 | 126.5 |
| D | 10 | 157 | 279866 | 2208.72 | 533 | 522 | 126.5 |
| D | 1 | 52 | 110470 | 869.34 | 533 | 522 | 126.5 |
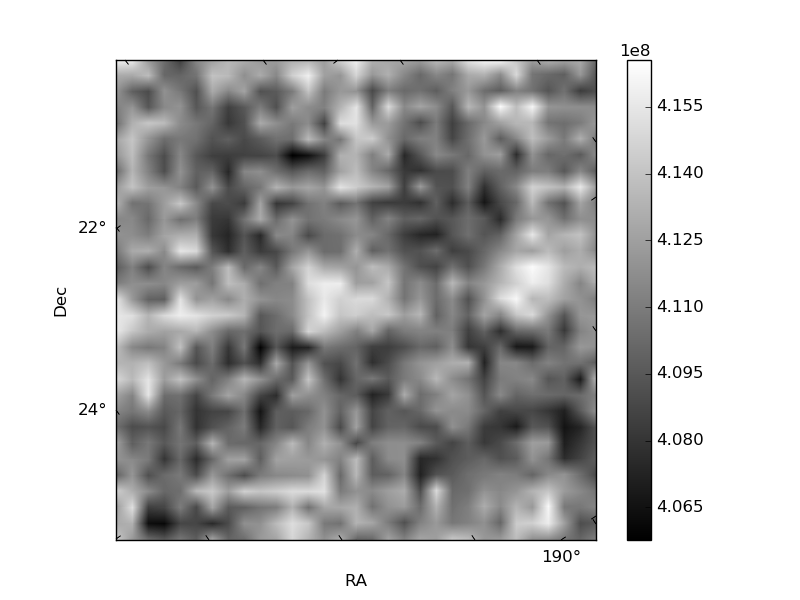
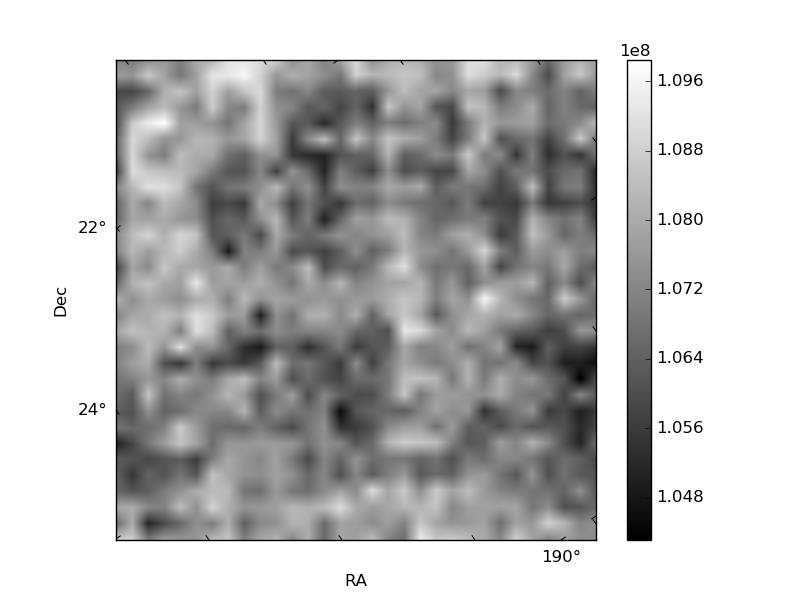
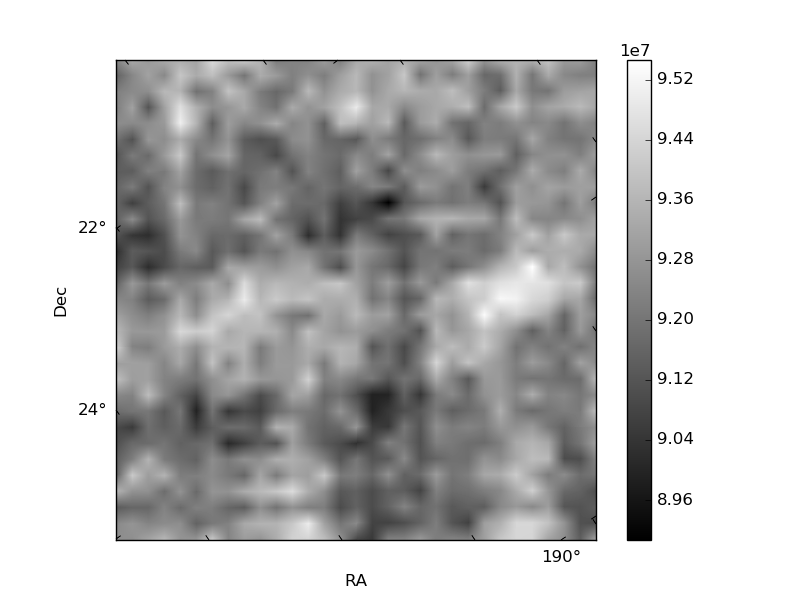
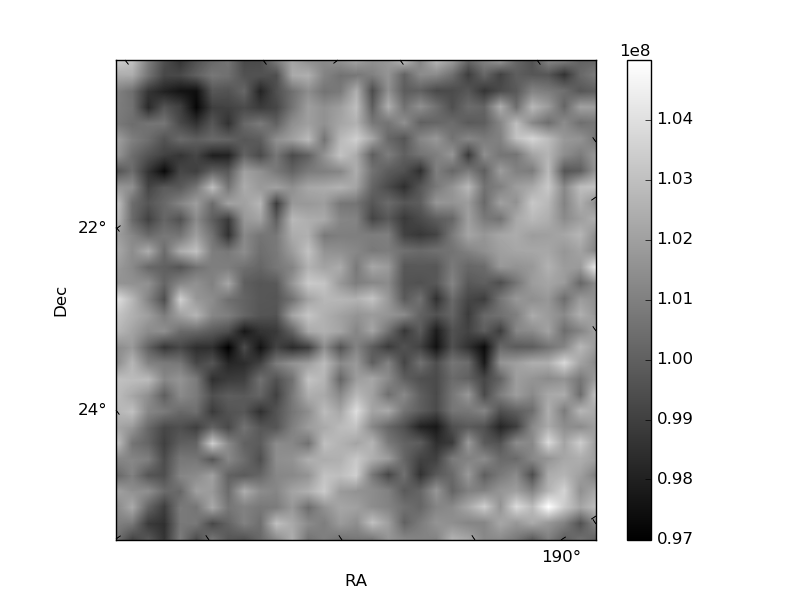
Histogram calculated using DETX and DETY for each event in the final _common_clean file
| Quadrant A | 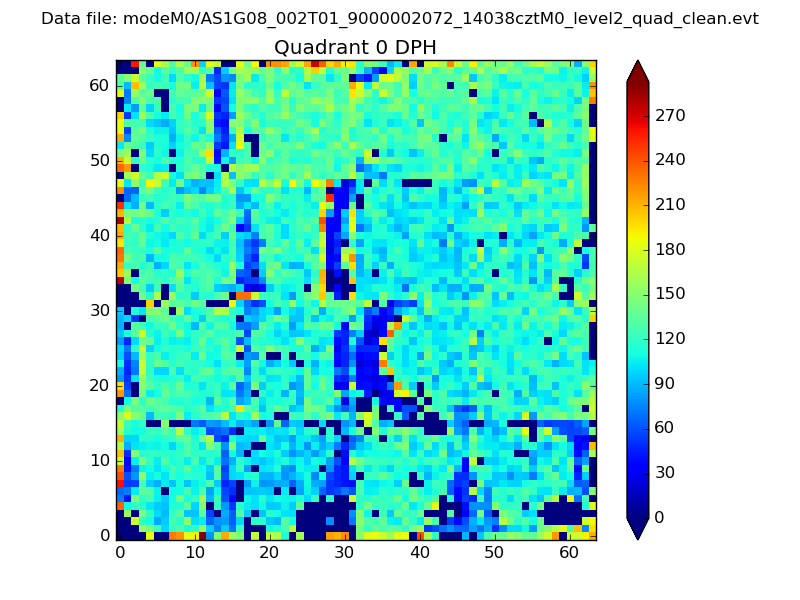 |
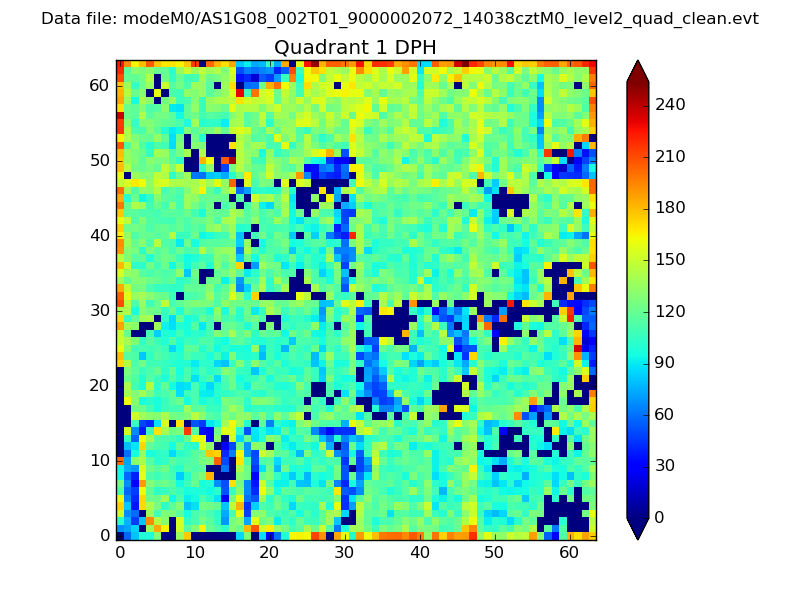 |
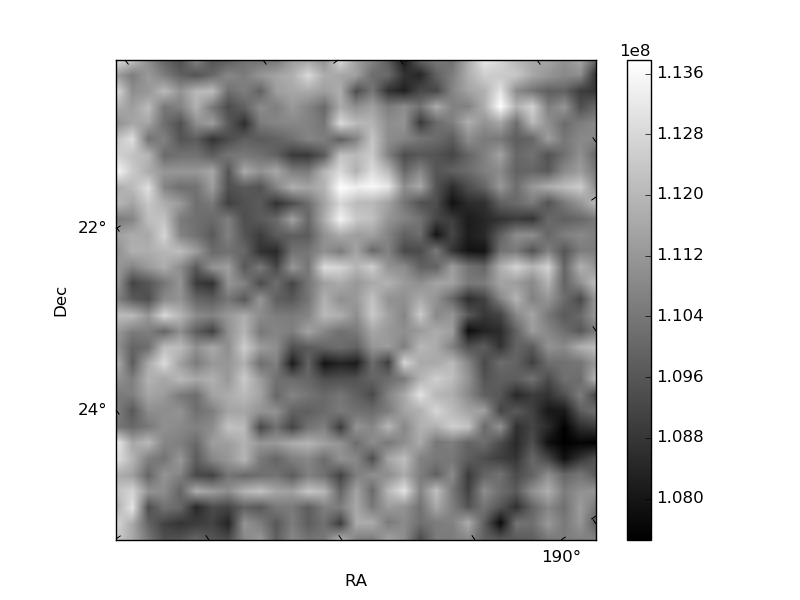
Quadrant B |
|---|---|---|---|
| Quadrant D | 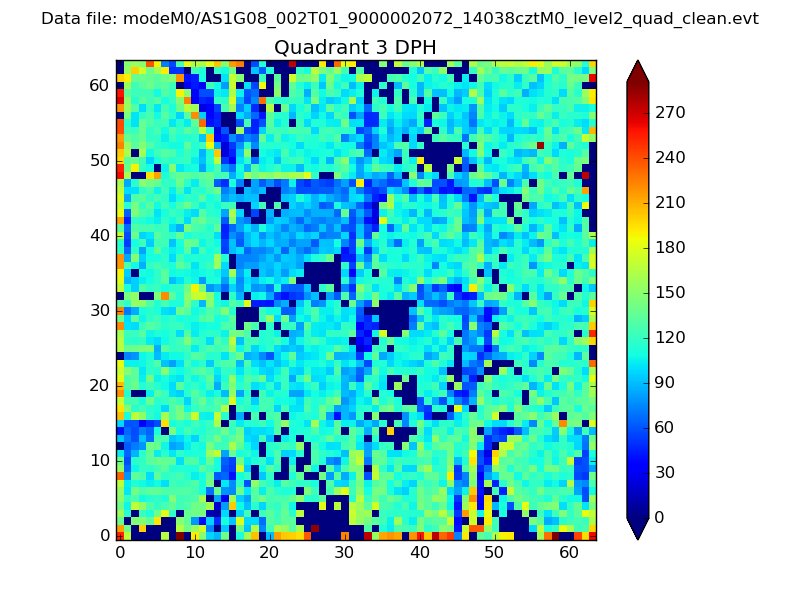 |
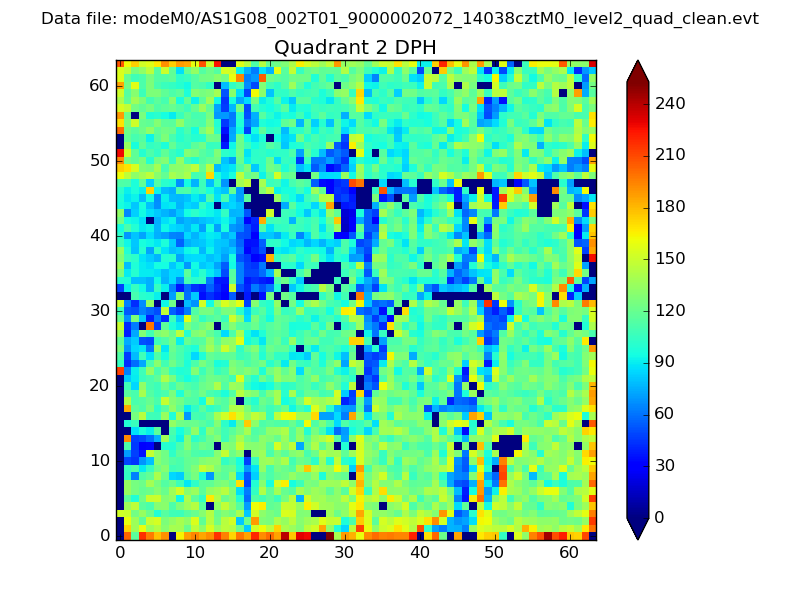 |
Quadrant C |
| Plot type | Count rate plots | Images |
|---|---|---|
| Comparison with Poisson distribution Blue bars denote a histogram of data divided into 1 sec bins. Red curve is a Poisson curve with rate = median count rate of data. |
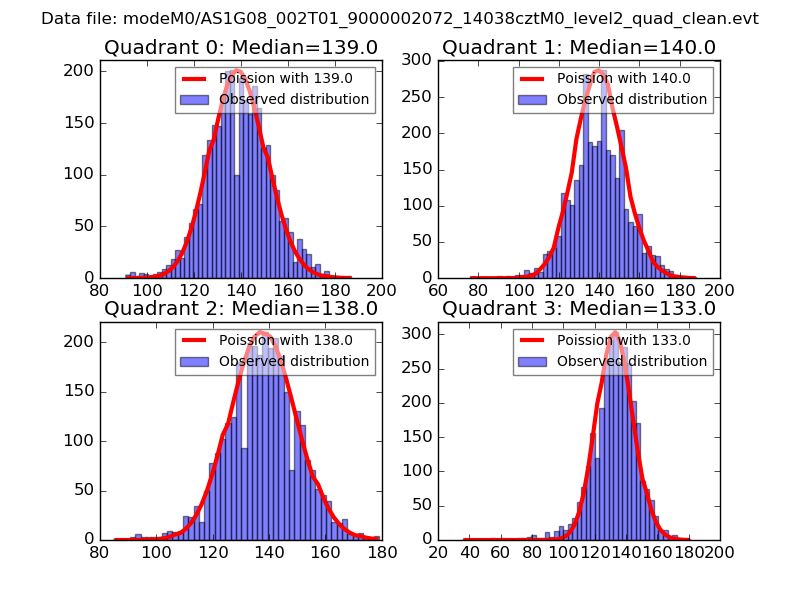 |
 |
| Quadrant-wise count rates Data is divided into 100 sec bins |
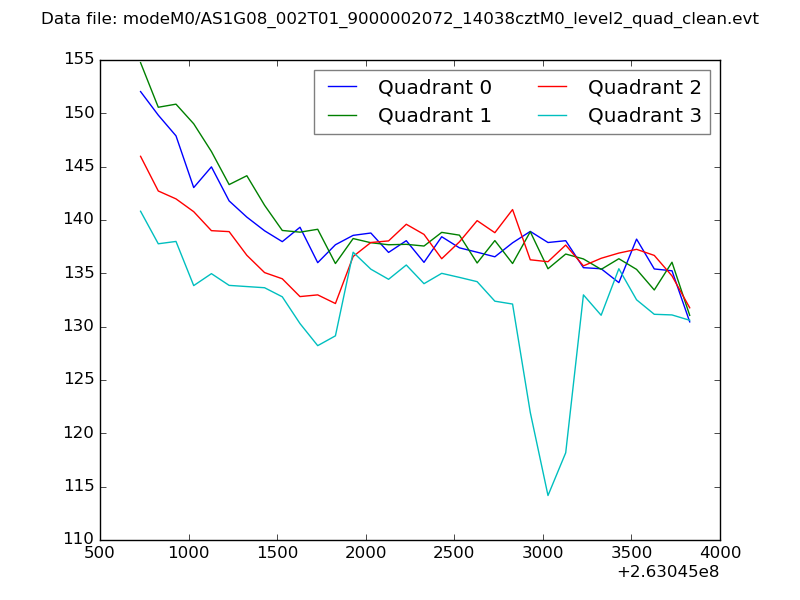 |
|
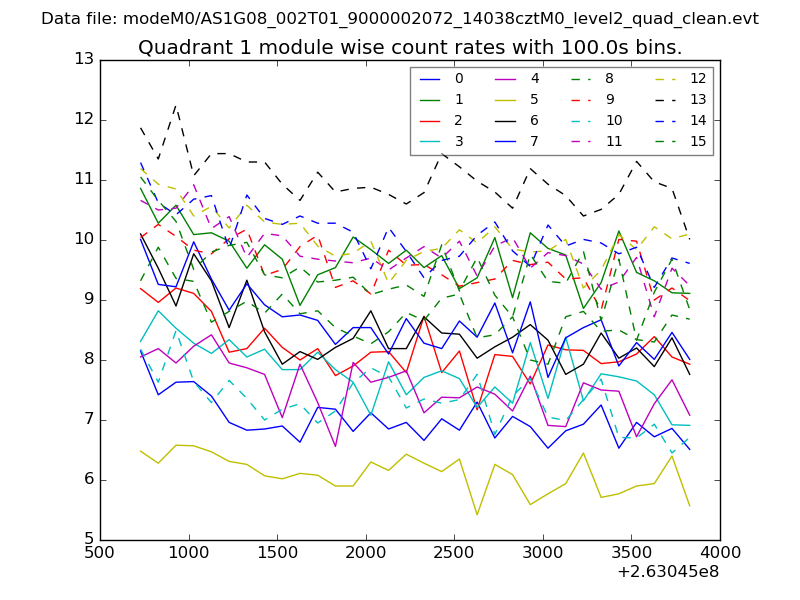
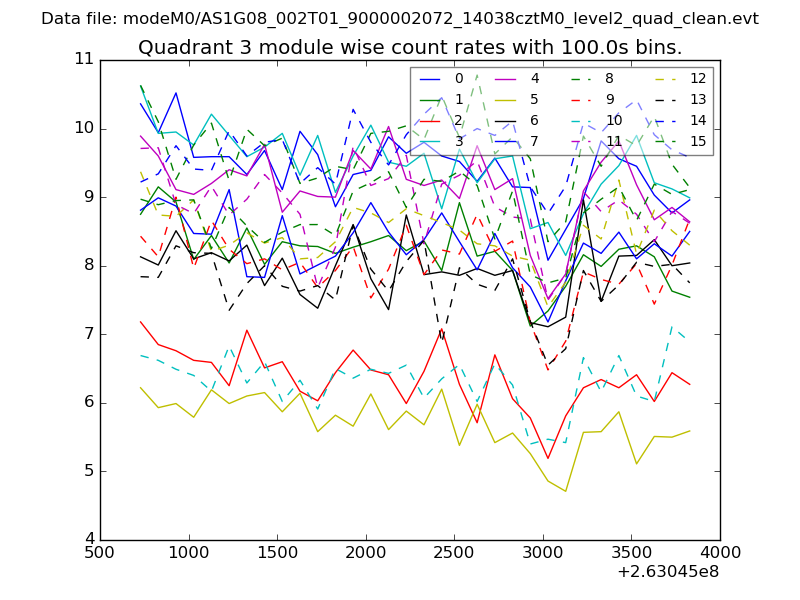
| Module-wise count rates for Quadrant A Data is divided into 100 sec bins |
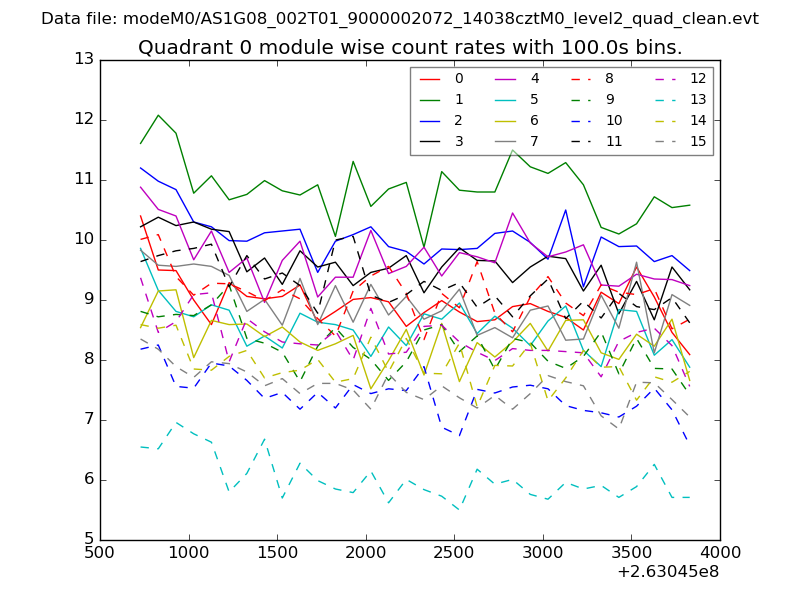 |
 |
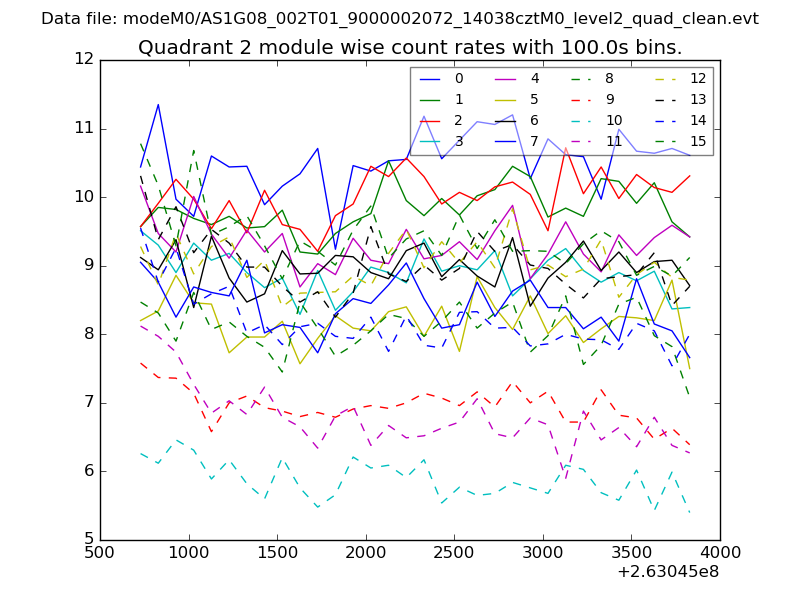
| Module-wise count rates for Quadrant B Data is divided into 100 sec bins |
 |
 |
| Module-wise count rates for Quadrant C Data is divided into 100 sec bins |
 |
 |
| Module-wise count rates for Quadrant D Data is divided into 100 sec bins |
 |
 |
| Parameter | Plot |
|---|---|
| CZT HV Monitor | 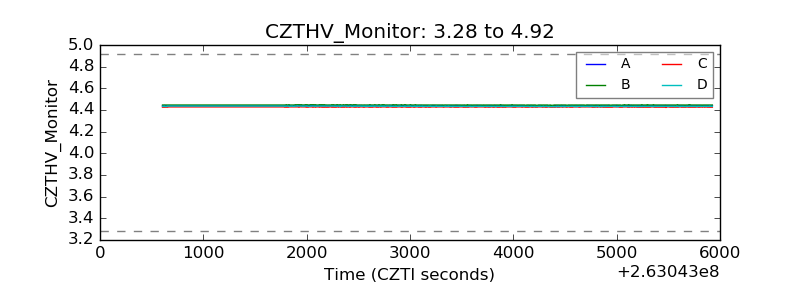 |
| D_VDD | 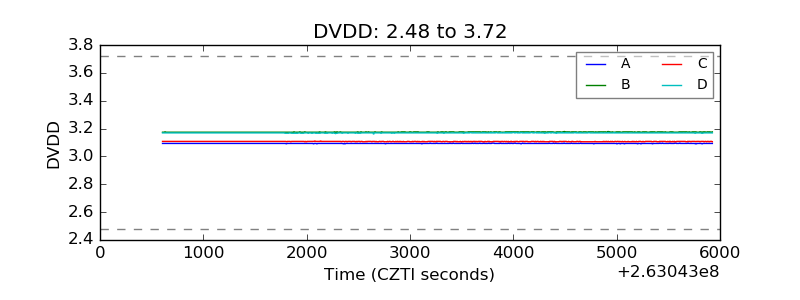 |
| Temperature 1 | 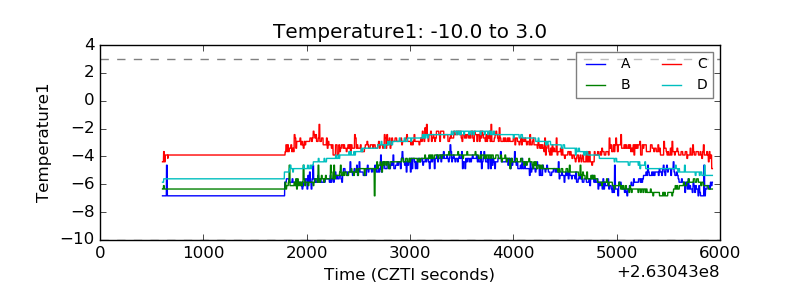 |
| Veto HV Monitor | 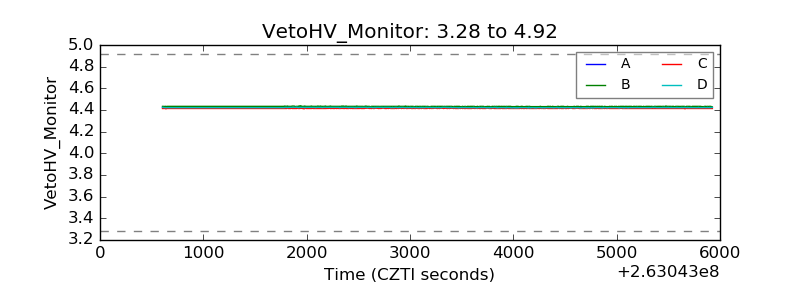 |
| Veto LLD | 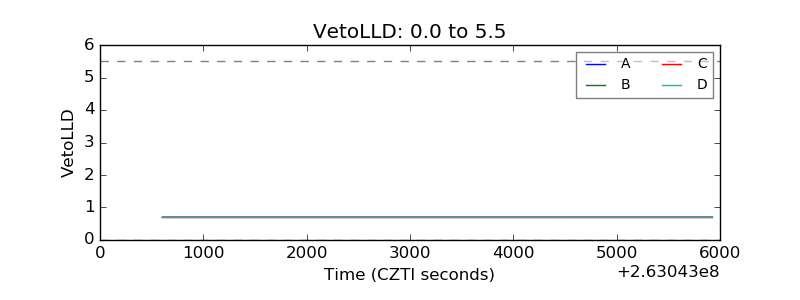 |
| Alpha Counter | 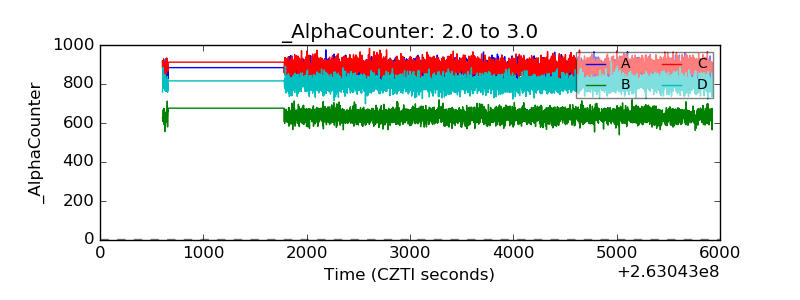 |
| _CPM_Rate | 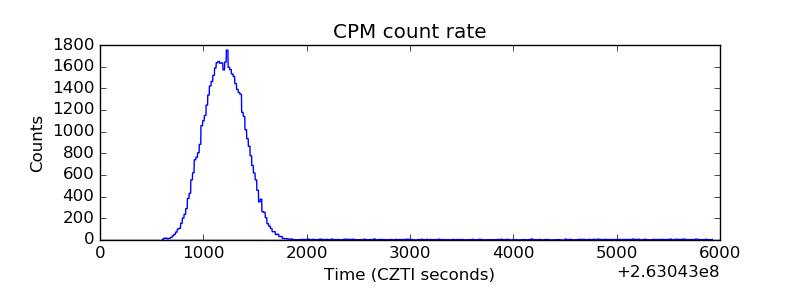 |
| CZT Counter |  |
| +2.5 Volts monitor |  |
| +5 Volts monitor |  |
| _ROLL_ROT | 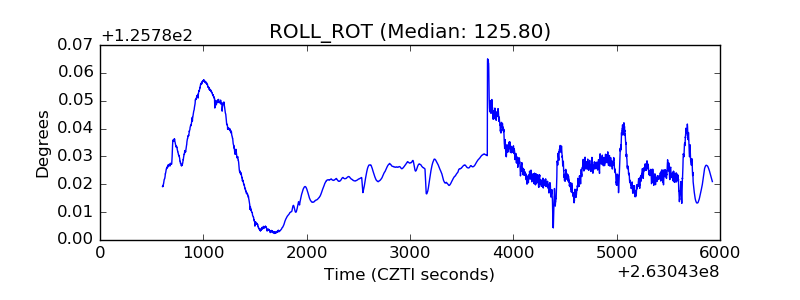 |
| _Roll_DEC | 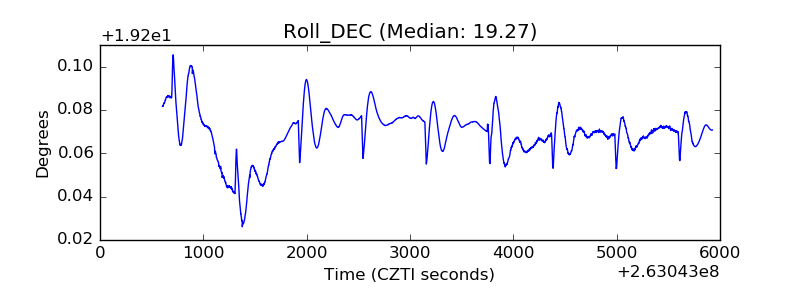 |
| _Roll_RA | 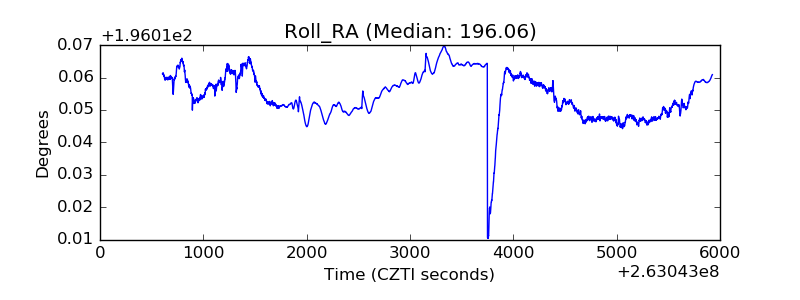 |
| Veto Counter | 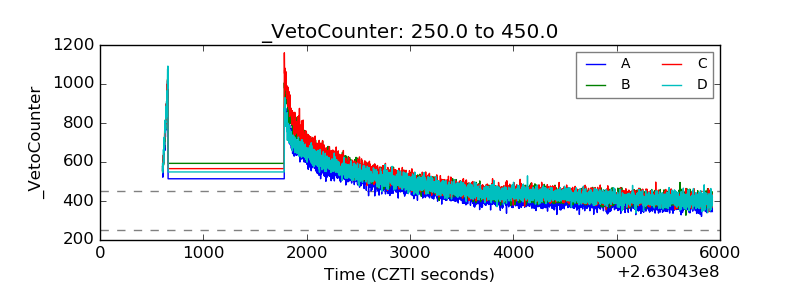 |