| Param | Original file | Final file |
|---|---|---|
| Filename | modeM0/AS1A04_162T01_9000002074_14038cztM0_level2.evt | modeM0/AS1A04_162T01_9000002074_14038cztM0_level2_quad_clean.evt |
| Size (bytes) | 132,978,240 | 38,001,600 |
| Size | 126.8 MB | 36.2 MB |
| Events in quadrant A | 902,759 | 263,716 |
| Events in quadrant B | 982,170 | 268,736 |
| Events in quadrant C | 895,786 | 257,759 |
| Events in quadrant D | 1,136,782 | 243,921 |
| Mode M0 | |||
|---|---|---|---|
| Quadrant | BADHDUFLAG | Total packets | Discarded packets |
| A | 0 | 3712 | 2 |
| B | 0 | 4052 | 1 |
| C | 0 | 3683 | 1 |
| D | 0 | 4428 | 1 |
| Mode M9 | |||
|---|---|---|---|
| Quadrant | BADHDUFLAG | Total packets | Discarded packets |
| A | 0 | 8 | 0 |
| B | 0 | 8 | 0 |
| C | 0 | 8 | 0 |
| D | 0 | 8 | 0 |
| Mode SS | |||
|---|---|---|---|
| Quadrant | BADHDUFLAG | Total packets | Discarded packets |
| A | 0 | 32 | 0 |
| B | 0 | 32 | 0 |
| C | 0 | 32 | 0 |
| D | 0 | 32 | 0 |
| Quadrant | Total seconds | Saturated seconds | Saturation percentage |
|---|---|---|---|
| A | 1576 | 11 | 0.697970% |
| B | 1576 | 9 | 0.571066% |
| C | 1576 | 2 | 0.126904% |
| D | 1576 | 63 | 3.997462% |
Noise dominated data is calculated using 1-second bins in cleaned event files. If a bin has >2000 counts, and if more than 50% of those come from <1% of pixels, then it is considered to be noise-dominated and hence unusable.
| Quadrant | # 1 sec bins | Bins with >0 counts | Bins with >2000 counts | High rate bins dominated by noise | Noise dominated (total time) | Noise dominated (detector-on time) | Marked lightcurve |
|---|---|---|---|---|---|---|---|
| A | 1577 | 1577 | 0 | 0 | 0.00% | 0.00% | 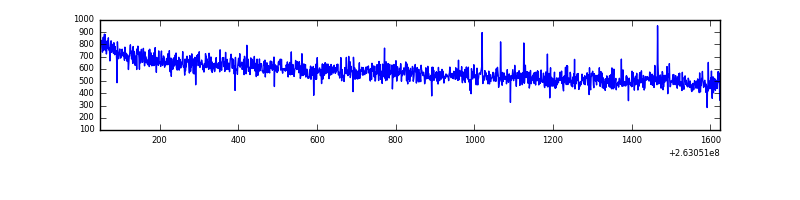 |
| B | 1577 | 1577 | 1 | 1 | 0.06% | 0.06% | 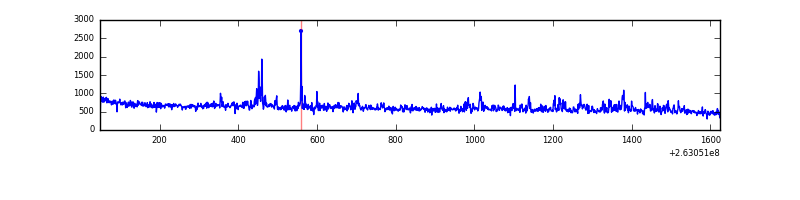 |
| C | 1577 | 1577 | 1 | 1 | 0.06% | 0.06% | 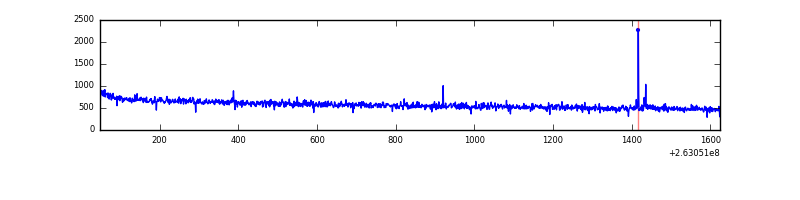 |
| D | 1577 | 1577 | 50 | 50 | 3.17% | 3.17% | 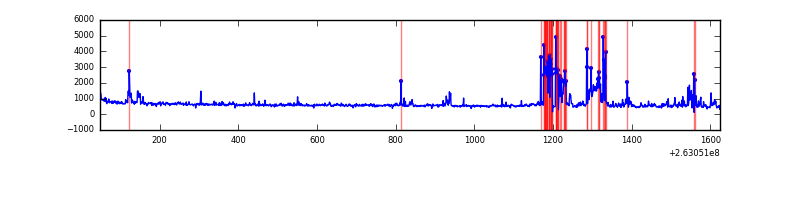 |
Top three noisy pixels from each quadrant. If the there are fewer than three noisy pixels in the level2.evt file, extra rows are filled as -1
| Pixel properties | Quadrant properties | ||||||
|---|---|---|---|---|---|---|---|
| Quadrant | DetID | PixID | Counts | Sigma | Mean | Median | Sigma |
| A | 1 | 162 | 4118 | 82.35 | 233 | 229 | 47.2 |
| A | 0 | 226 | 2108 | 39.79 | 233 | 229 | 47.2 |
| A | 12 | 194 | 1776 | 32.76 | 233 | 229 | 47.2 |
| B | 0 | 189 | 43670 | 983.71 | 228 | 224 | 44.2 |
| B | 3 | 209 | 12848 | 285.83 | 228 | 224 | 44.2 |
| B | 0 | 214 | 11184 | 248.16 | 228 | 224 | 44.2 |
| C | 3 | 233 | 37745 | 737.98 | 218 | 219 | 50.8 |
| C | 0 | 207 | 5521 | 104.27 | 218 | 219 | 50.8 |
| C | 13 | 61 | 1592 | 27.0 | 218 | 219 | 50.8 |
| D | 10 | 157 | 193772 | 3628.56 | 217 | 212 | 53.3 |
| D | 1 | 52 | 86113 | 1610.34 | 217 | 212 | 53.3 |
| D | 13 | 122 | 7711 | 140.58 | 217 | 212 | 53.3 |
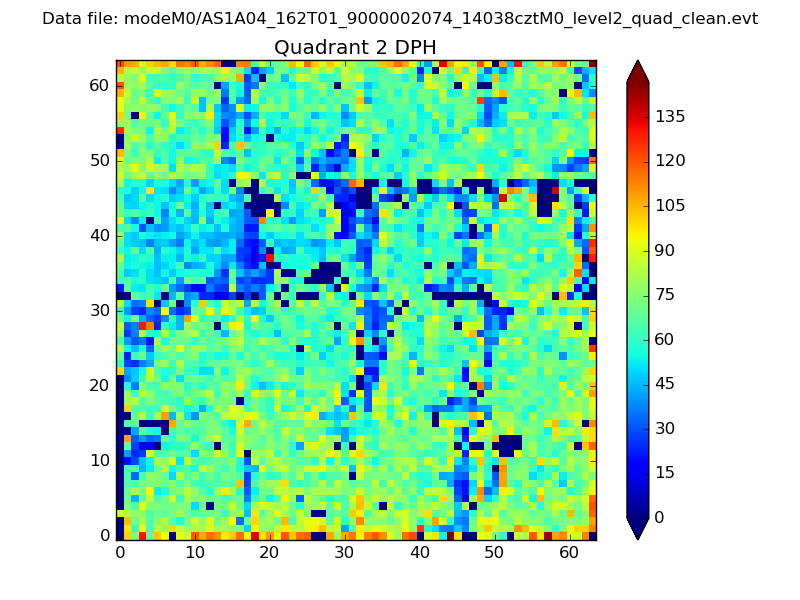
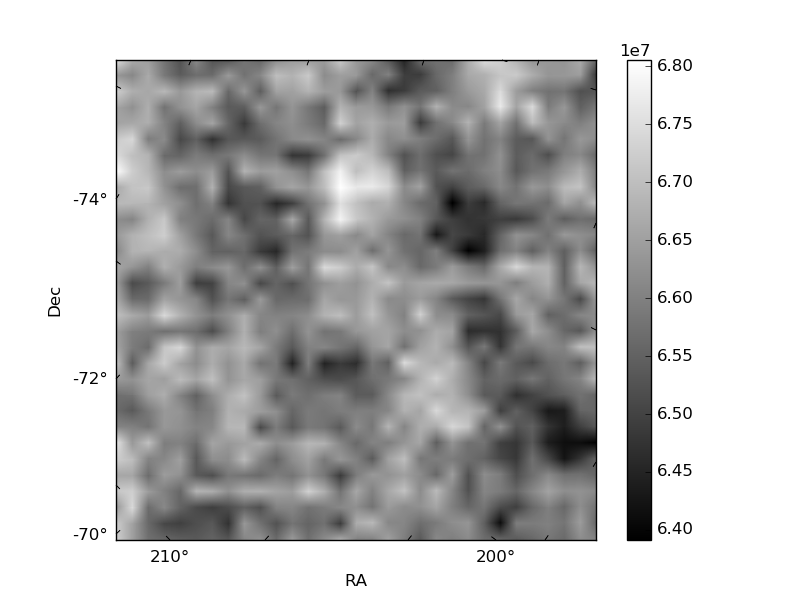
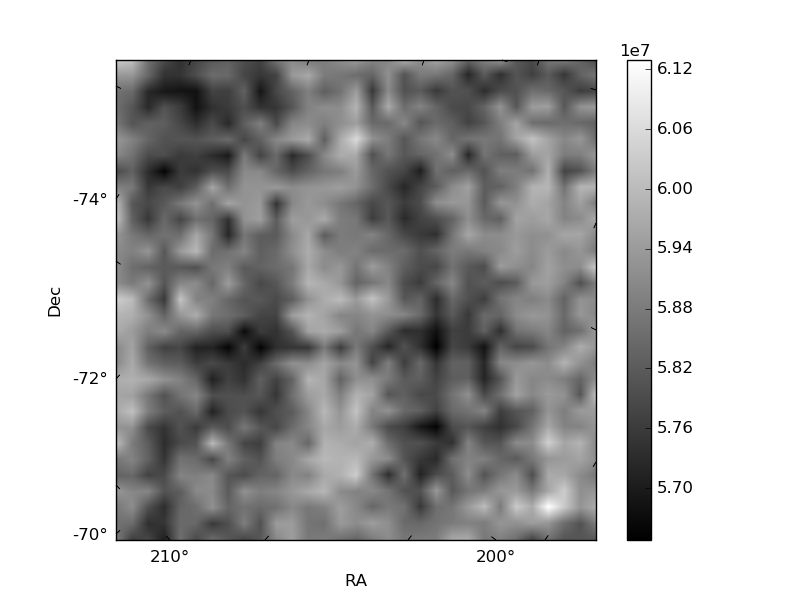
Histogram calculated using DETX and DETY for each event in the final _common_clean file
| Quadrant A | 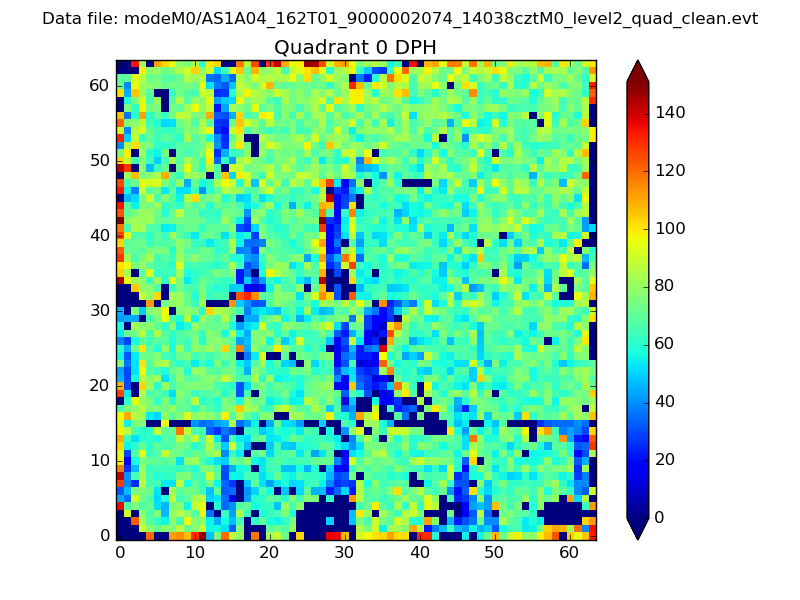 |
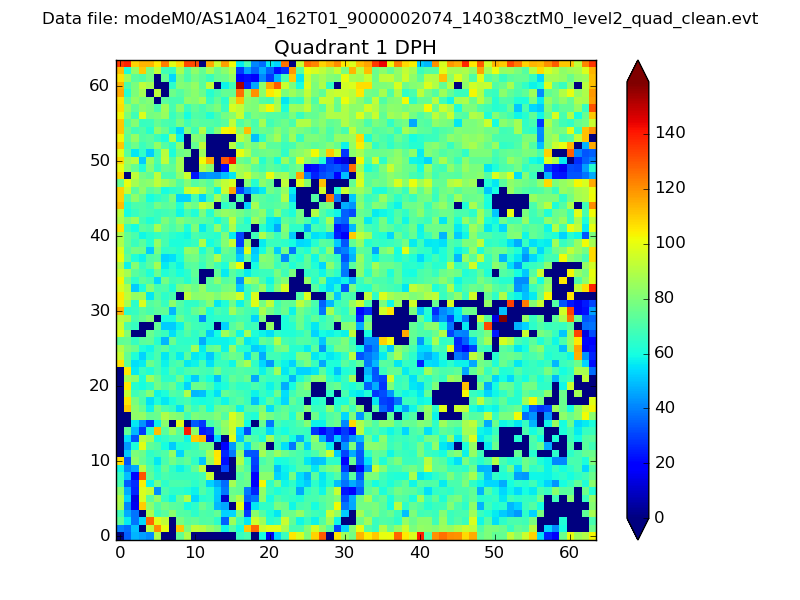 |
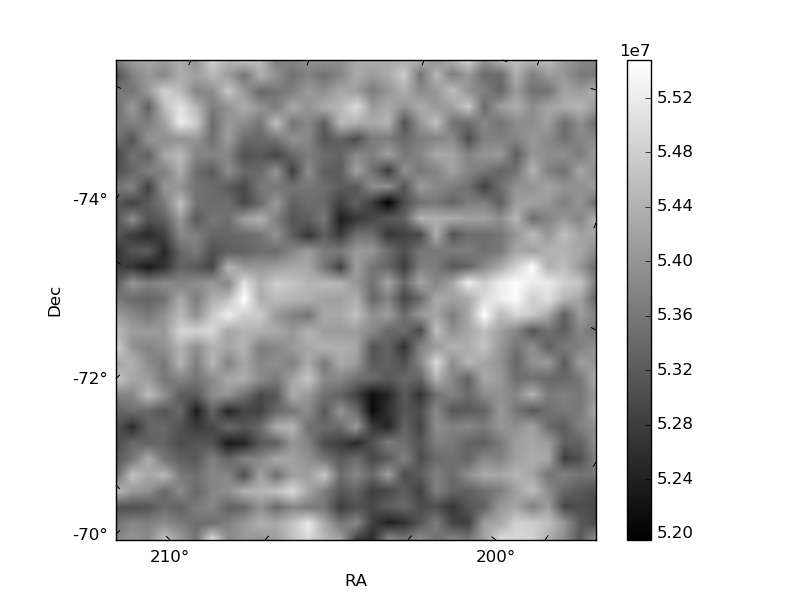
Quadrant B |
|---|---|---|---|
| Quadrant D | 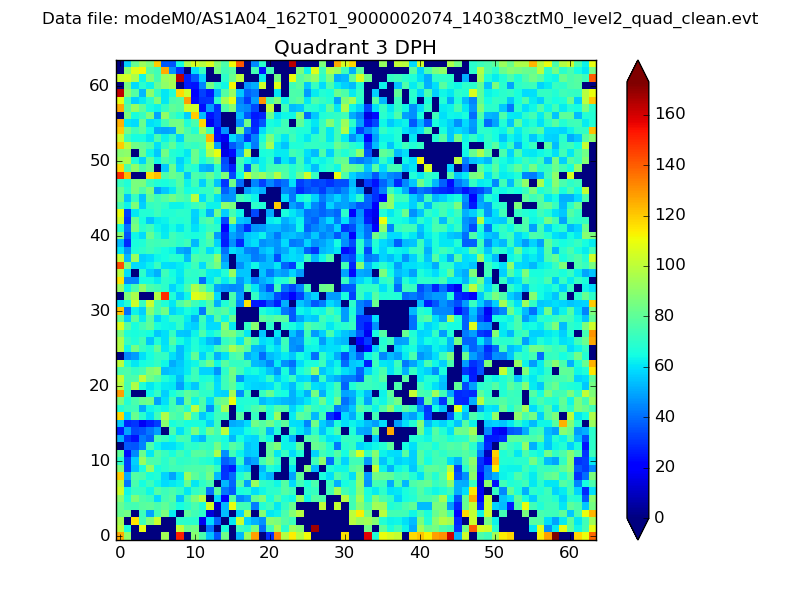 |
 |
Quadrant C |
| Plot type | Count rate plots | Images |
|---|---|---|
| Comparison with Poisson distribution Blue bars denote a histogram of data divided into 1 sec bins. Red curve is a Poisson curve with rate = median count rate of data. |
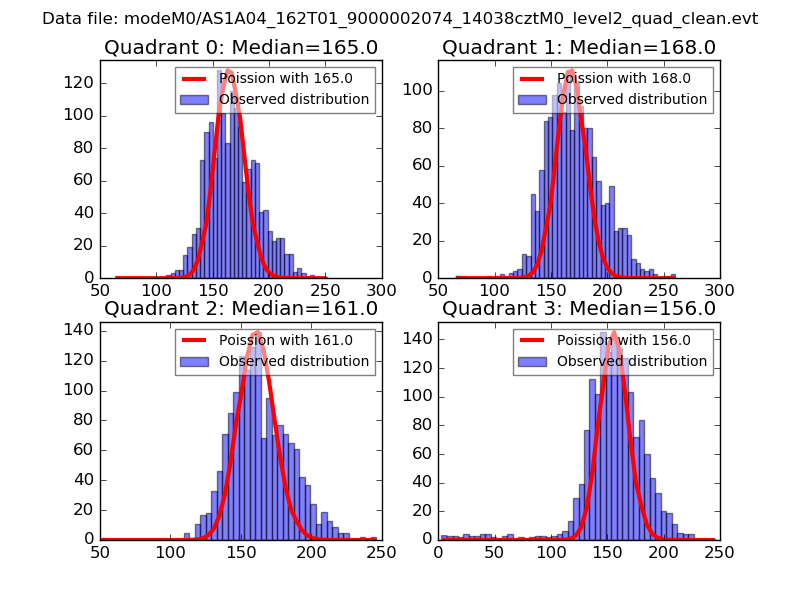 |
 |
| Quadrant-wise count rates Data is divided into 100 sec bins |
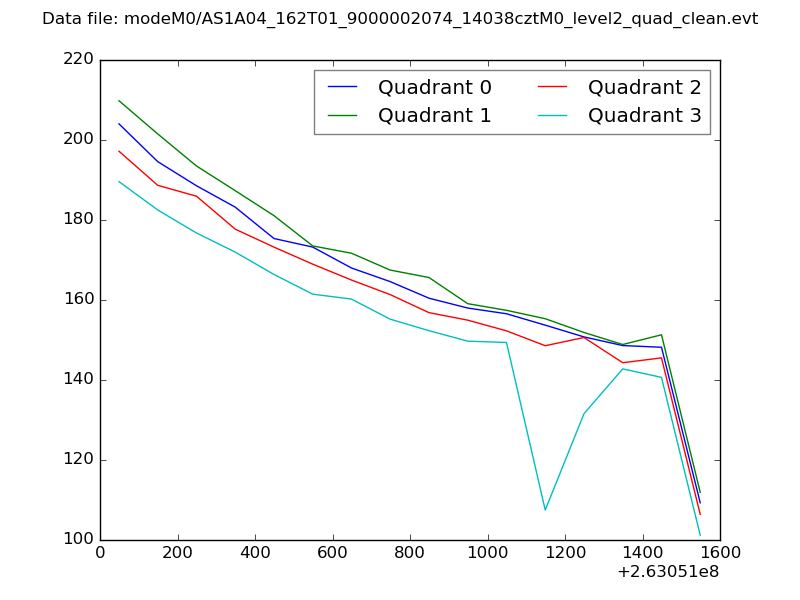 |
|
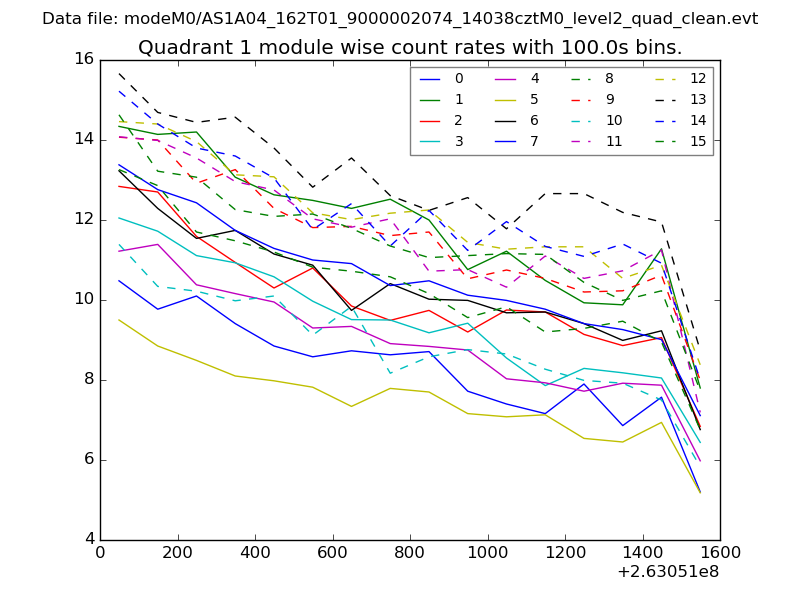
| Module-wise count rates for Quadrant A Data is divided into 100 sec bins |
 |
 |
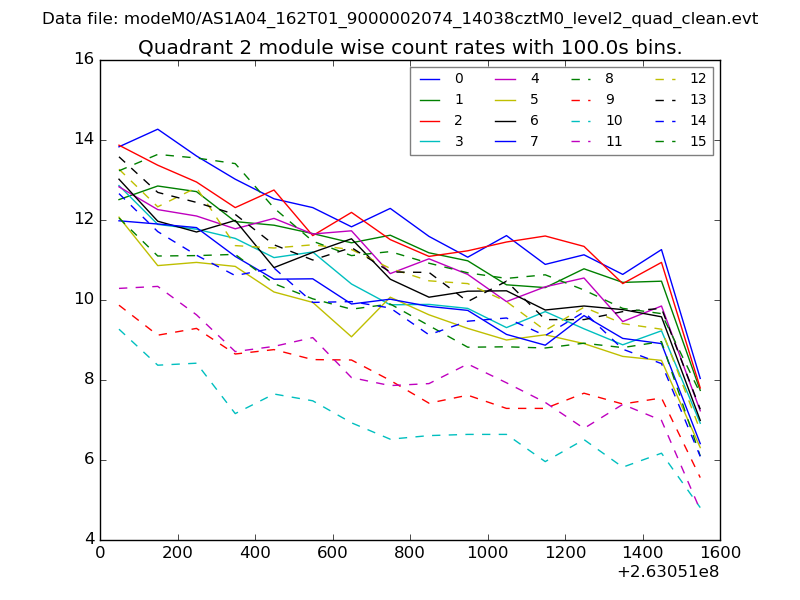
| Module-wise count rates for Quadrant B Data is divided into 100 sec bins |
 |
 |
| Module-wise count rates for Quadrant C Data is divided into 100 sec bins |
 |
 |
| Module-wise count rates for Quadrant D Data is divided into 100 sec bins |
 |
 |
| Parameter | Plot |
|---|---|
| CZT HV Monitor | 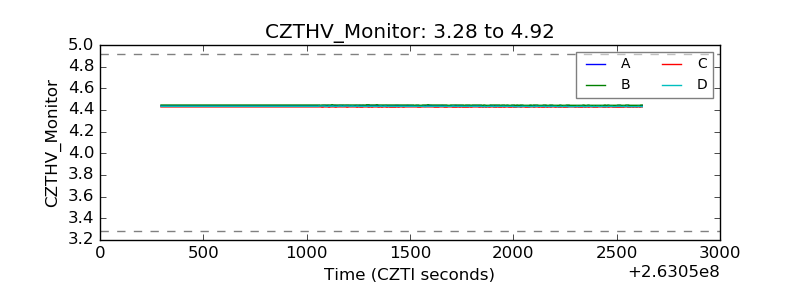 |
| D_VDD |  |
| Temperature 1 | 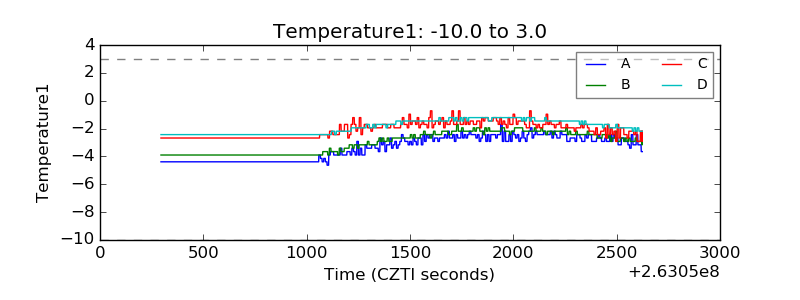 |
| Veto HV Monitor | 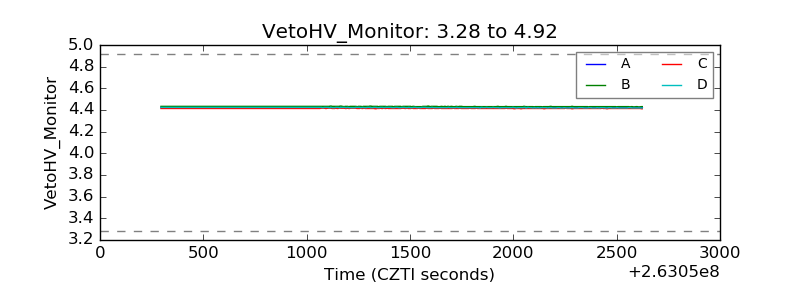 |
| Veto LLD | 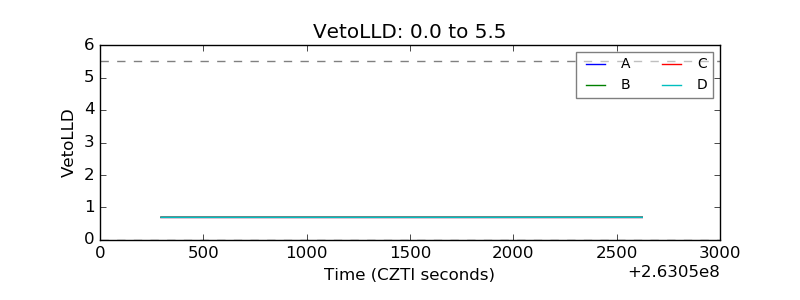 |
| Alpha Counter | 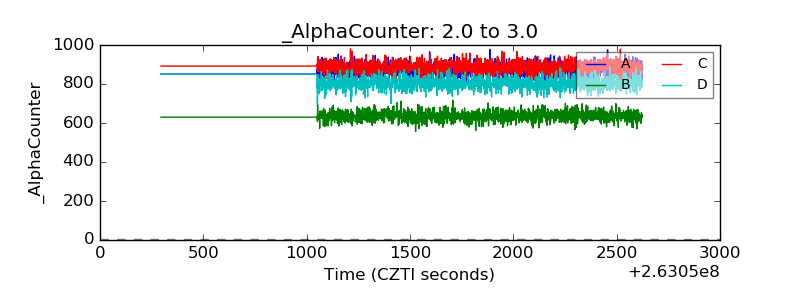 |
| _CPM_Rate |  |
| CZT Counter | 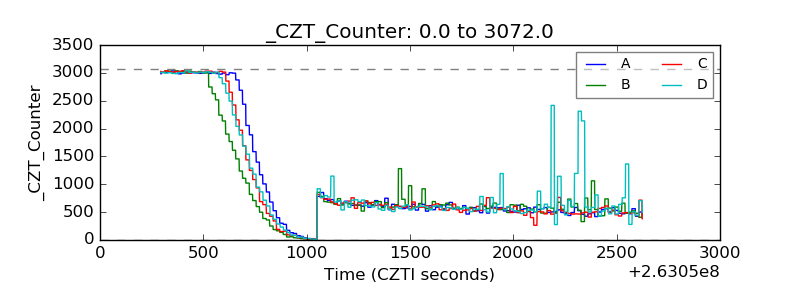 |
| +2.5 Volts monitor |  |
| +5 Volts monitor |  |
| _ROLL_ROT | 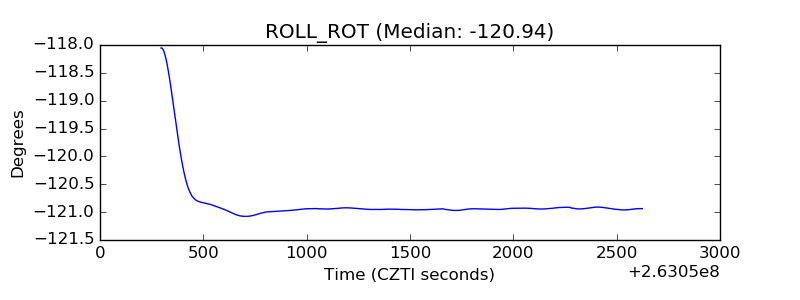 |
| _Roll_DEC |  |
| _Roll_RA | 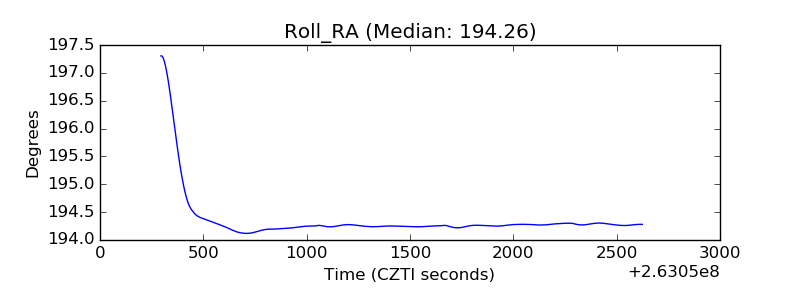 |
| Veto Counter | 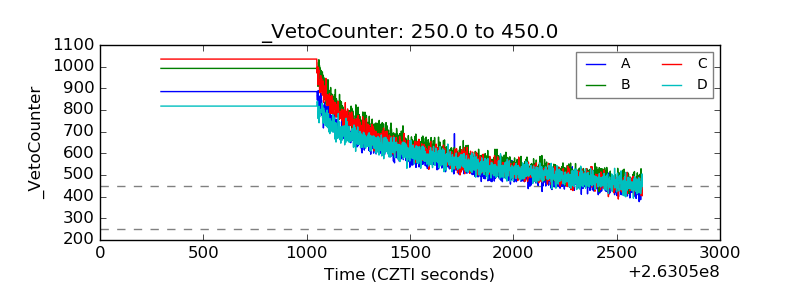 |