| Param | Original file | Final file |
|---|---|---|
| Filename | modeM0/AS1G08_025T01_9000002130_14433cztM0_level2.evt | modeM0/AS1G08_025T01_9000002130_14433cztM0_level2_quad_clean.evt |
| Size (bytes) | 435,199,680 | 81,446,400 |
| Size | 415.0 MB | 77.7 MB |
| Events in quadrant A | 2,905,260 | 521,635 |
| Events in quadrant B | 3,457,307 | 509,879 |
| Events in quadrant C | 3,140,053 | 508,400 |
| Events in quadrant D | 3,262,544 | 500,231 |
| Mode M0 | |||
|---|---|---|---|
| Quadrant | BADHDUFLAG | Total packets | Discarded packets |
| A | 0 | 12701 | 138 |
| B | 0 | 14418 | 145 |
| C | 0 | 12990 | 140 |
| D | 0 | 14090 | 181 |
| Mode SS | |||
|---|---|---|---|
| Quadrant | BADHDUFLAG | Total packets | Discarded packets |
| A | 0 | 126 | 0 |
| B | 0 | 126 | 2 |
| C | 0 | 126 | 0 |
| D | 0 | 126 | 0 |
| Mode M9 | |||
|---|---|---|---|
| Quadrant | BADHDUFLAG | Total packets | Discarded packets |
| A | 0 | 9 | 0 |
| B | 0 | 9 | 0 |
| C | 0 | 9 | 0 |
| D | 0 | 9 | 0 |
| Quadrant | Total seconds | Saturated seconds | Saturation percentage |
|---|---|---|---|
| A | 6100 | 45 | 0.737705% |
| B | 6099 | 215 | 3.525168% |
| C | 6099 | 26 | 0.426299% |
| D | 6097 | 100 | 1.640151% |
Noise dominated data is calculated using 1-second bins in cleaned event files. If a bin has >2000 counts, and if more than 50% of those come from <1% of pixels, then it is considered to be noise-dominated and hence unusable.
| Quadrant | # 1 sec bins | Bins with >0 counts | Bins with >2000 counts | High rate bins dominated by noise | Noise dominated (total time) | Noise dominated (detector-on time) | Marked lightcurve |
|---|---|---|---|---|---|---|---|
| A | 7104 | 6127 | 0 | 0 | 0.00% | 0.00% | 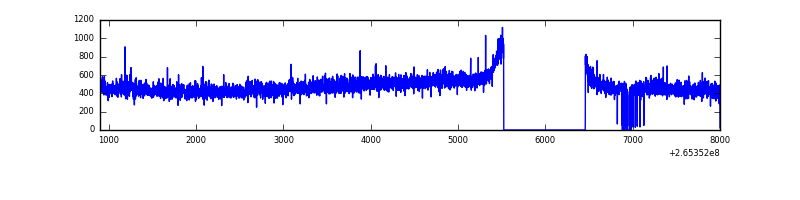 |
| B | 7104 | 6138 | 149 | 149 | 2.10% | 2.43% | 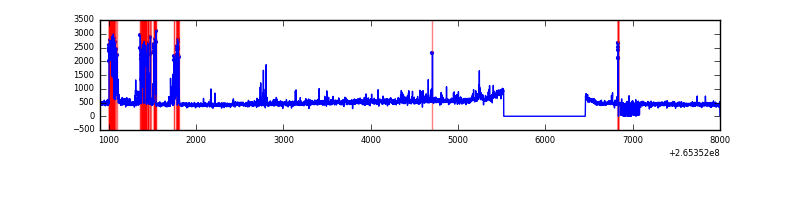 |
| C | 7104 | 6131 | 0 | 0 | 0.00% | 0.00% | 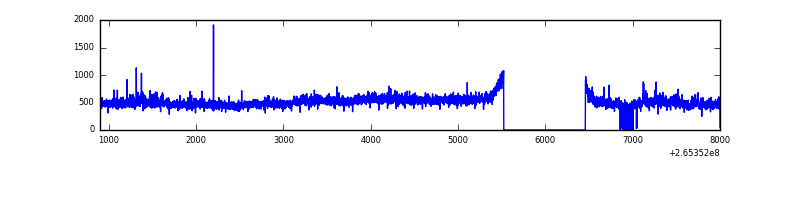 |
| D | 7104 | 6140 | 90 | 90 | 1.27% | 1.47% | 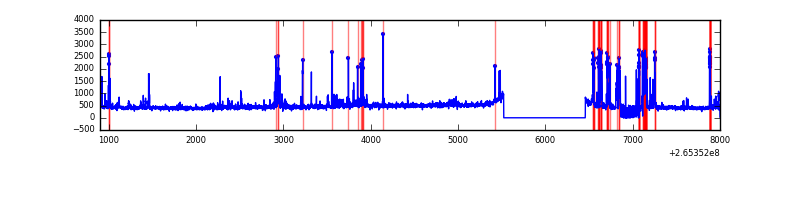 |
Top three noisy pixels from each quadrant. If the there are fewer than three noisy pixels in the level2.evt file, extra rows are filled as -1
| Pixel properties | Quadrant properties | ||||||
|---|---|---|---|---|---|---|---|
| Quadrant | DetID | PixID | Counts | Sigma | Mean | Median | Sigma |
| A | 8 | 15 | 33376 | 214.35 | 739 | 723 | 152.3 |
| A | 12 | 189 | 25914 | 165.37 | 739 | 723 | 152.3 |
| A | 0 | 226 | 6711 | 39.31 | 739 | 723 | 152.3 |
| B | 15 | 222 | 462623 | 3350.01 | 725 | 707 | 137.9 |
| B | 0 | 219 | 43666 | 311.55 | 725 | 707 | 137.9 |
| B | 3 | 209 | 31732 | 225.0 | 725 | 707 | 137.9 |
| C | 3 | 233 | 386828 | 2369.06 | 705 | 709 | 163.0 |
| C | 13 | 61 | 5021 | 26.46 | 705 | 709 | 163.0 |
| C | 12 | 4 | 4814 | 25.19 | 705 | 709 | 163.0 |
| D | 2 | 120 | 318379 | 1882.23 | 706 | 690 | 168.8 |
| D | 13 | 122 | 152271 | 898.08 | 706 | 690 | 168.8 |
| D | 10 | 199 | 51953 | 303.72 | 706 | 690 | 168.8 |
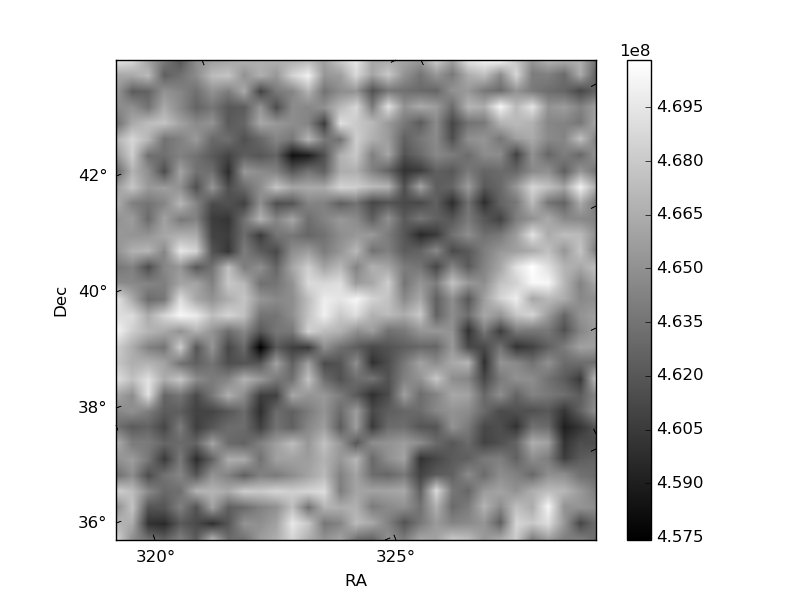
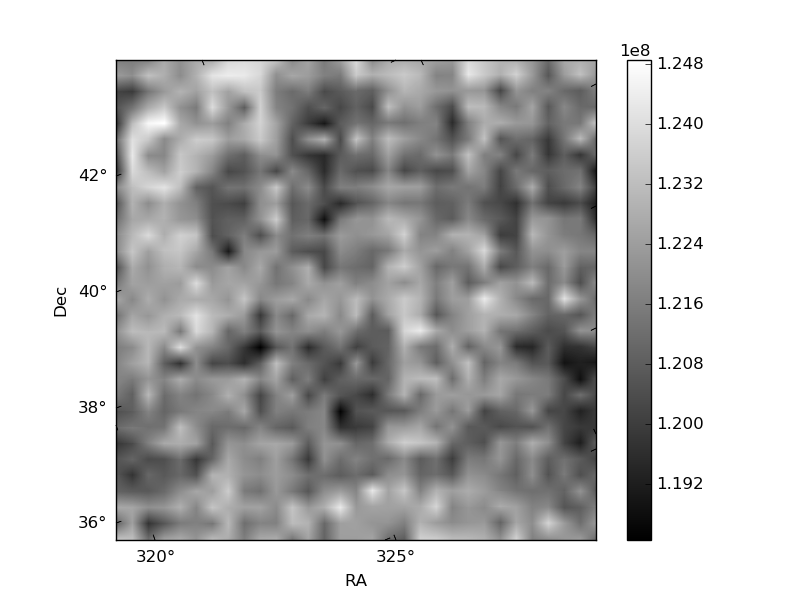
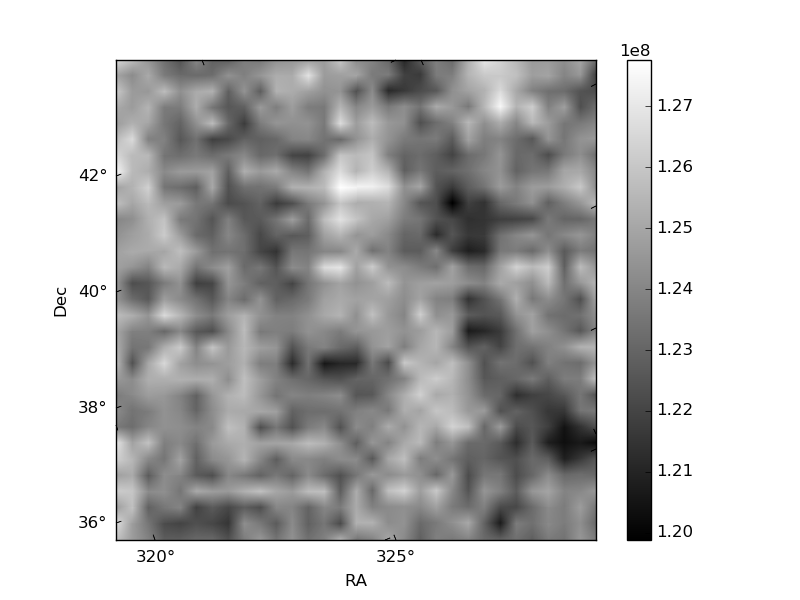
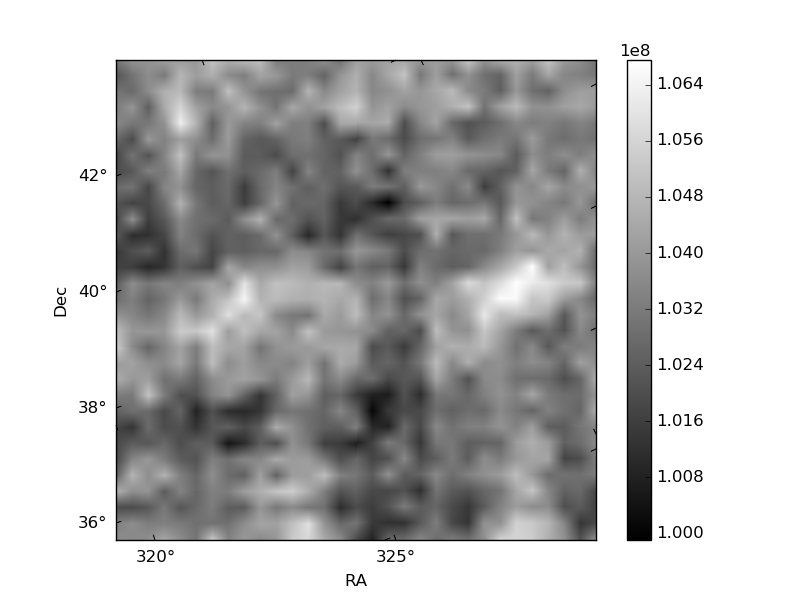
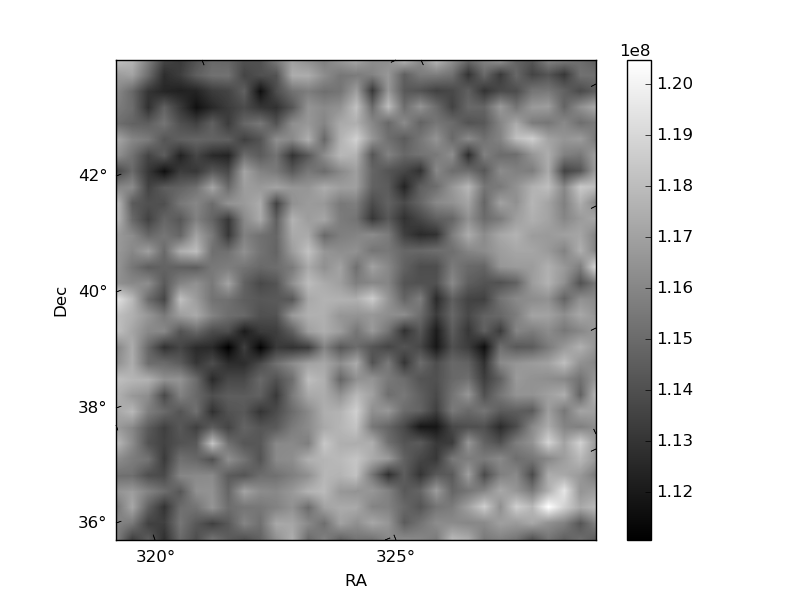
Histogram calculated using DETX and DETY for each event in the final _common_clean file
| Quadrant A | 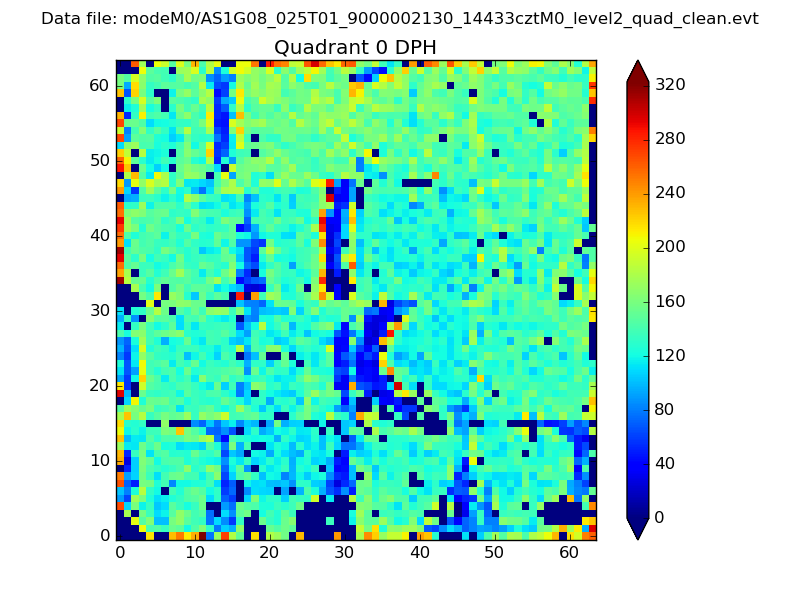 |
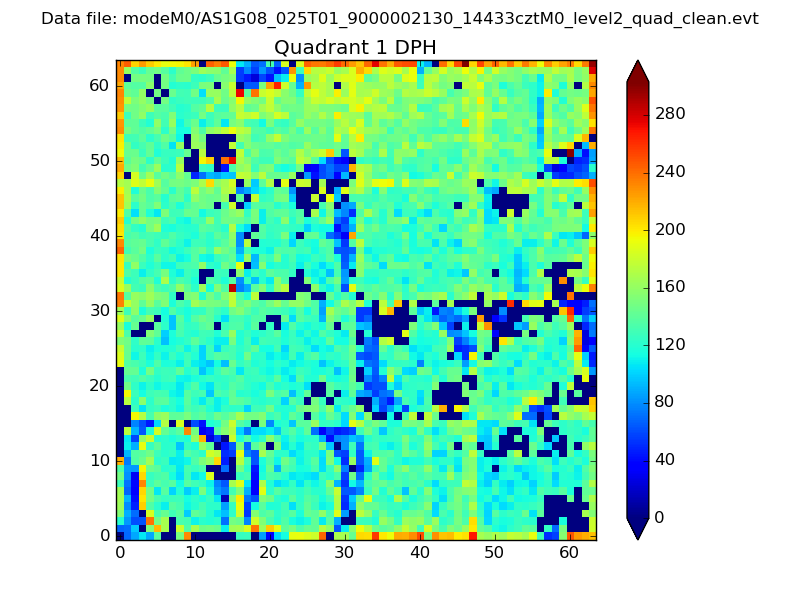 |
Quadrant B |
|---|---|---|---|
| Quadrant D |  |
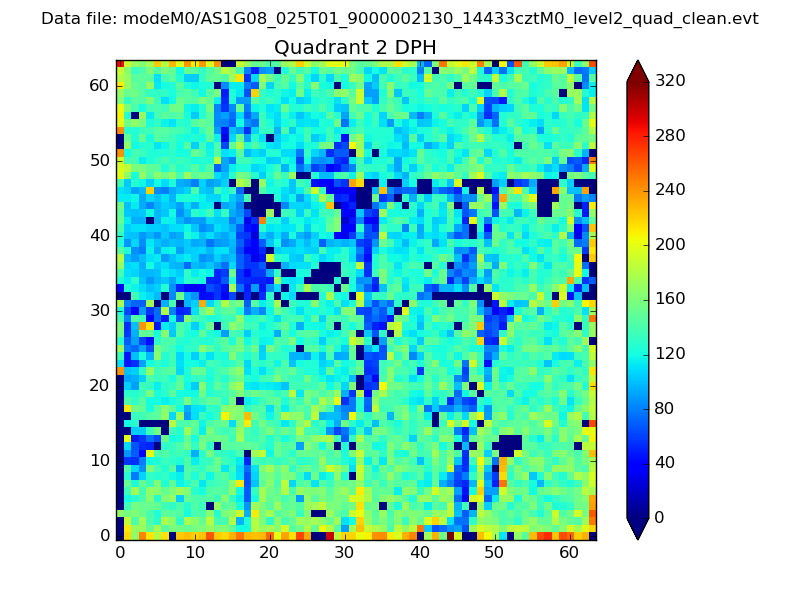 |
Quadrant C |
| Plot type | Count rate plots | Images |
|---|---|---|
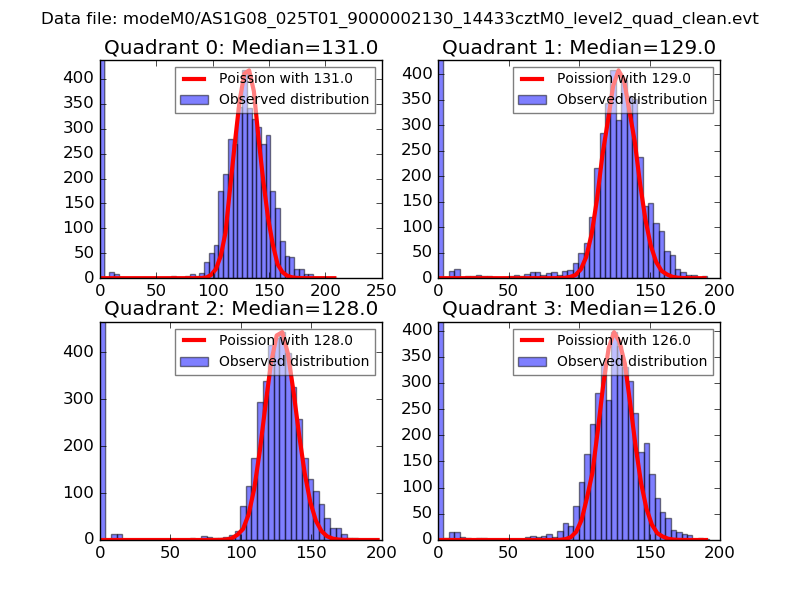
| Comparison with Poisson distribution Blue bars denote a histogram of data divided into 1 sec bins. Red curve is a Poisson curve with rate = median count rate of data. |
 |
 |
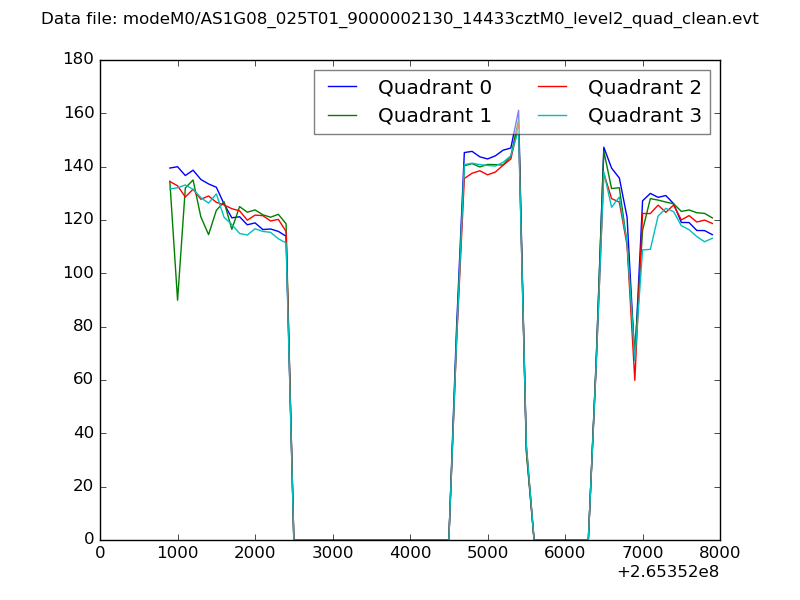
| Quadrant-wise count rates Data is divided into 100 sec bins |
 |
|
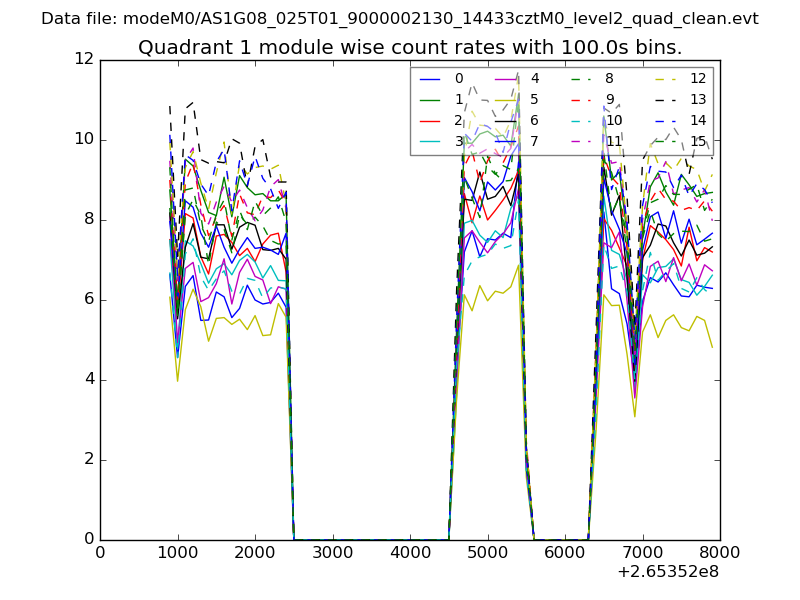
| Module-wise count rates for Quadrant A Data is divided into 100 sec bins |
 |
 |
| Module-wise count rates for Quadrant B Data is divided into 100 sec bins |
 |
 |
| Module-wise count rates for Quadrant C Data is divided into 100 sec bins |
 |
 |
| Module-wise count rates for Quadrant D Data is divided into 100 sec bins |
 |
 |
| Parameter | Plot |
|---|---|
| CZT HV Monitor | 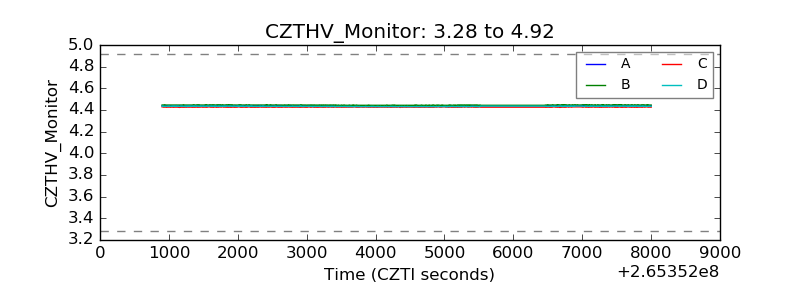 |
| D_VDD | 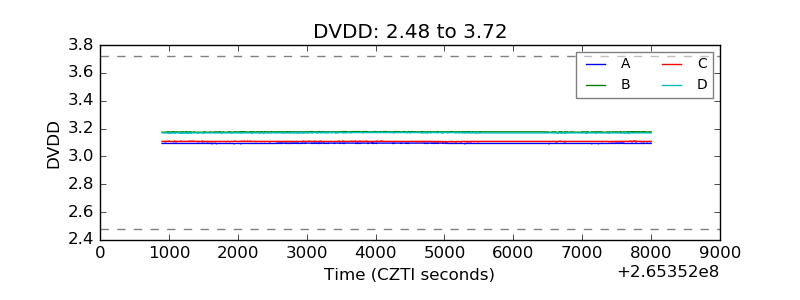 |
| Temperature 1 | 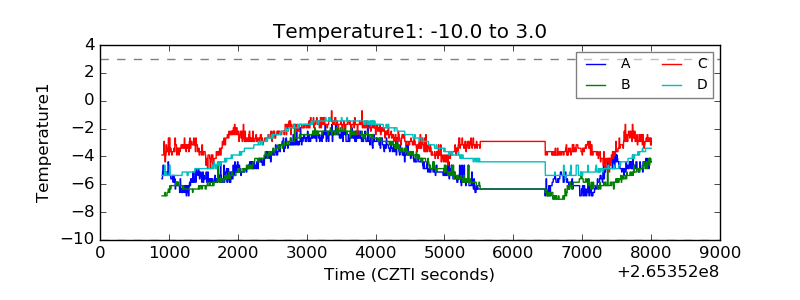 |
| Veto HV Monitor | 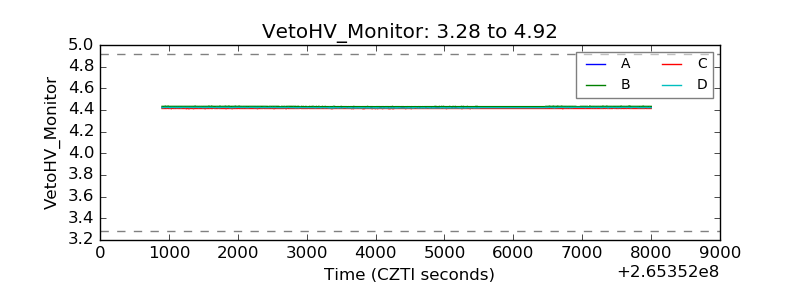 |
| Veto LLD | 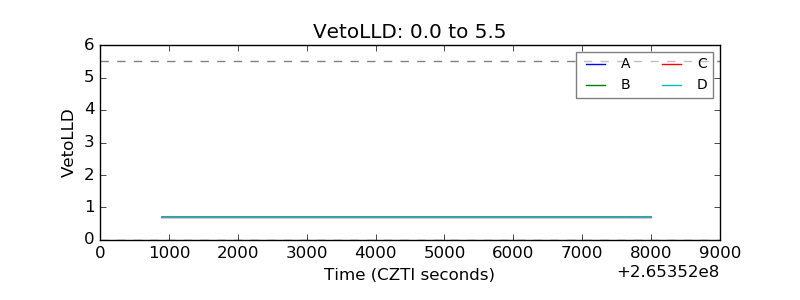 |
| Alpha Counter | 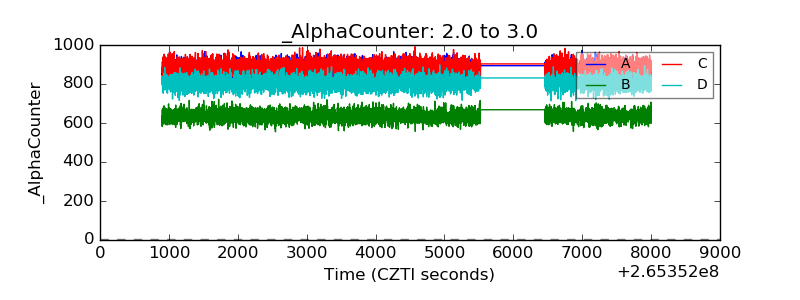 |
| _CPM_Rate | 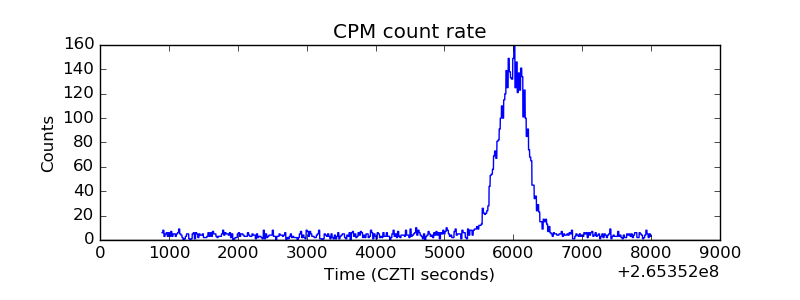 |
| CZT Counter | 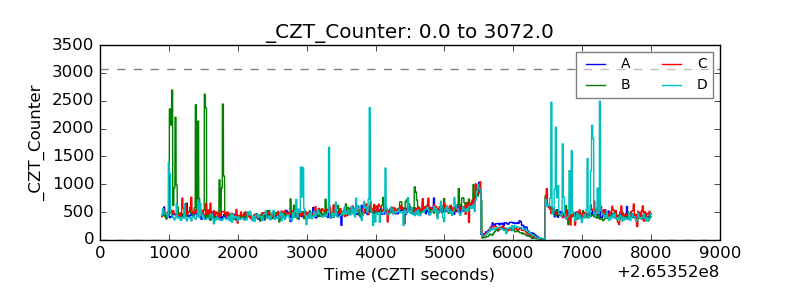 |
| +2.5 Volts monitor |  |
| +5 Volts monitor |  |
| _ROLL_ROT | 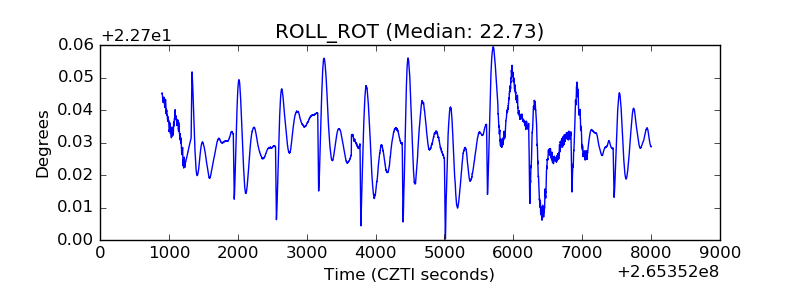 |
| _Roll_DEC | 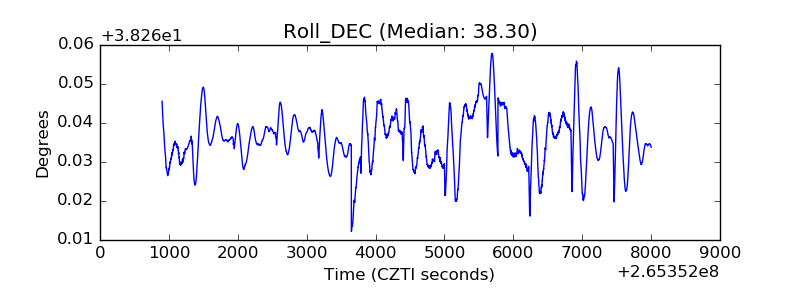 |
| _Roll_RA | 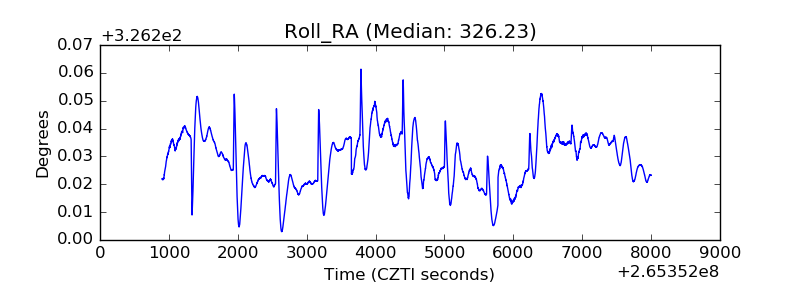 |
| Veto Counter | 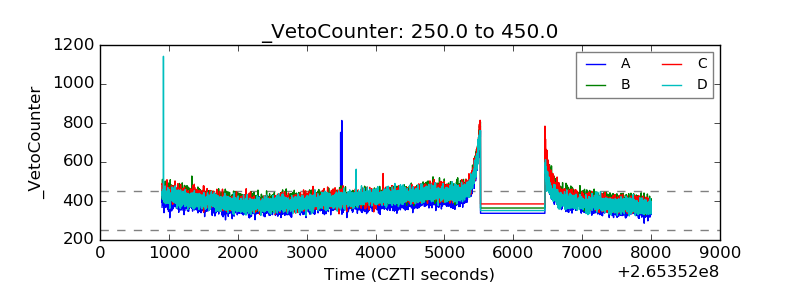 |