| Param | Original file | Final file |
|---|---|---|
| Filename | modeM0/AS1G08_020T01_9000002168_14665cztM0_level2.evt | modeM0/AS1G08_020T01_9000002168_14665cztM0_level2_quad_clean.evt |
| Size (bytes) | 552,657,600 | 102,536,640 |
| Size | 527.1 MB | 97.8 MB |
| Events in quadrant A | 3,862,865 | 656,410 |
| Events in quadrant B | 3,850,020 | 655,731 |
| Events in quadrant C | 4,289,601 | 645,347 |
| Events in quadrant D | 4,228,207 | 627,953 |
| Mode SS | |||
|---|---|---|---|
| Quadrant | BADHDUFLAG | Total packets | Discarded packets |
| A | 0 | 152 | 0 |
| B | 0 | 152 | 0 |
| C | 0 | 152 | 0 |
| D | 0 | 152 | 0 |
| Mode M0 | |||
|---|---|---|---|
| Quadrant | BADHDUFLAG | Total packets | Discarded packets |
| A | 0 | 16118 | 3 |
| B | 0 | 16337 | 2 |
| C | 0 | 17367 | 2 |
| D | 0 | 17670 | 2 |
| Mode M9 | |||
|---|---|---|---|
| Quadrant | BADHDUFLAG | Total packets | Discarded packets |
| A | 0 | 20 | 0 |
| B | 0 | 20 | 0 |
| C | 0 | 20 | 0 |
| D | 0 | 20 | 0 |
| Quadrant | Total seconds | Saturated seconds | Saturation percentage |
|---|---|---|---|
| A | 7474 | 56 | 0.749264% |
| B | 7474 | 118 | 1.578807% |
| C | 7474 | 57 | 0.762644% |
| D | 7474 | 262 | 3.505486% |
Noise dominated data is calculated using 1-second bins in cleaned event files. If a bin has >2000 counts, and if more than 50% of those come from <1% of pixels, then it is considered to be noise-dominated and hence unusable.
| Quadrant | # 1 sec bins | Bins with >0 counts | Bins with >2000 counts | High rate bins dominated by noise | Noise dominated (total time) | Noise dominated (detector-on time) | Marked lightcurve |
|---|---|---|---|---|---|---|---|
| A | 9405 | 7477 | 0 | 0 | 0.00% | 0.00% | 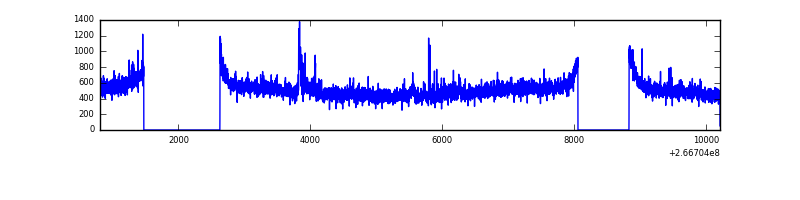 |
| B | 9405 | 7477 | 1 | 1 | 0.01% | 0.01% | 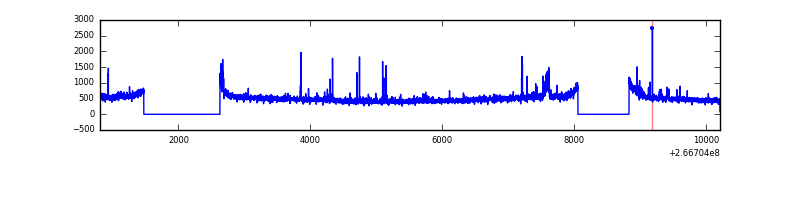 |
| C | 9405 | 7477 | 0 | 0 | 0.00% | 0.00% | 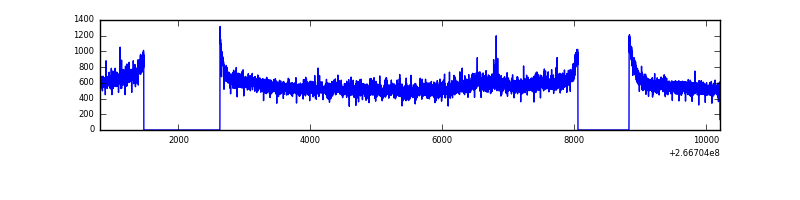 |
| D | 9405 | 7477 | 211 | 211 | 2.24% | 2.82% | 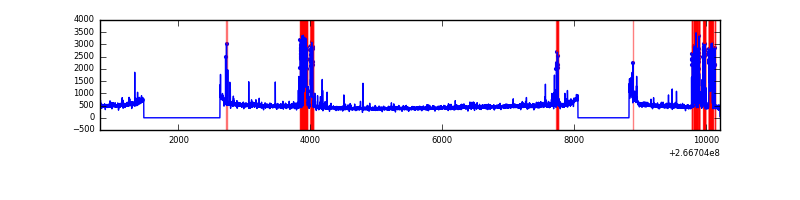 |
Top three noisy pixels from each quadrant. If the there are fewer than three noisy pixels in the level2.evt file, extra rows are filled as -1
| Pixel properties | Quadrant properties | ||||||
|---|---|---|---|---|---|---|---|
| Quadrant | DetID | PixID | Counts | Sigma | Mean | Median | Sigma |
| A | 1 | 162 | 90174 | 468.68 | 932 | 912 | 190.5 |
| A | 12 | 189 | 56235 | 290.48 | 932 | 912 | 190.5 |
| A | 8 | 15 | 40192 | 206.24 | 932 | 912 | 190.5 |
| B | 0 | 230 | 67843 | 374.25 | 932 | 909 | 178.8 |
| B | 0 | 219 | 31437 | 170.69 | 932 | 909 | 178.8 |
| B | 0 | 205 | 29002 | 157.08 | 932 | 909 | 178.8 |
| C | 3 | 233 | 730180 | 3437.02 | 913 | 916 | 212.2 |
| C | 13 | 61 | 6618 | 26.87 | 913 | 916 | 212.2 |
| C | 3 | 234 | 2501 | 7.47 | 913 | 916 | 212.2 |
| D | 10 | 199 | 647366 | 3024.03 | 899 | 877 | 213.8 |
| D | 10 | 70 | 59053 | 272.12 | 899 | 877 | 213.8 |
| D | 5 | 222 | 44261 | 202.93 | 899 | 877 | 213.8 |
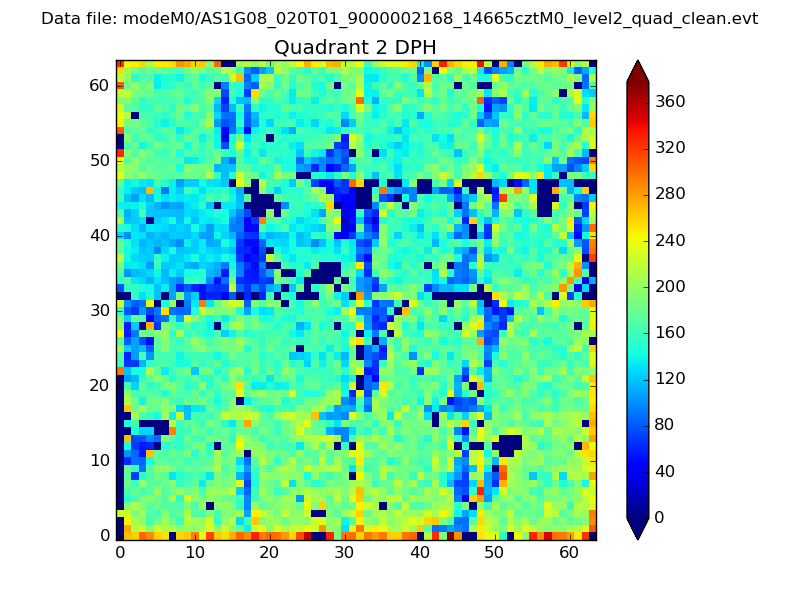
Histogram calculated using DETX and DETY for each event in the final _common_clean file
| Quadrant A | 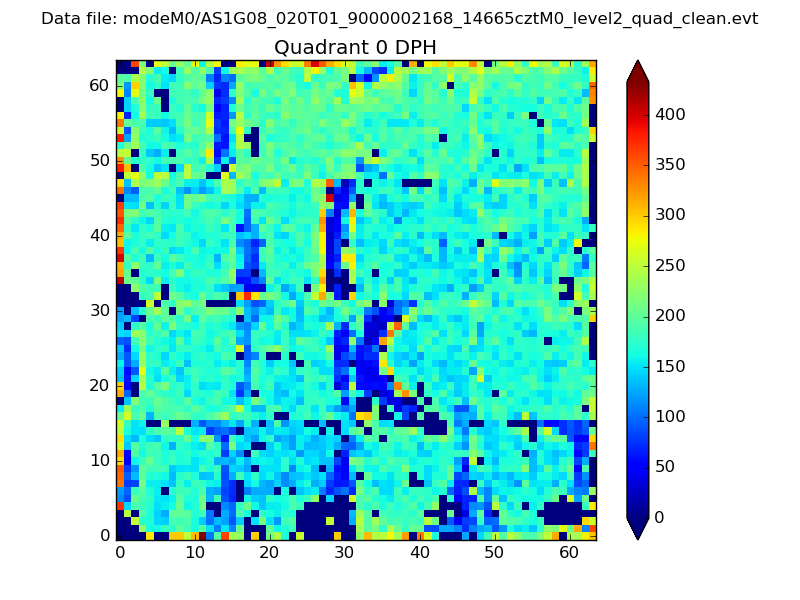 |
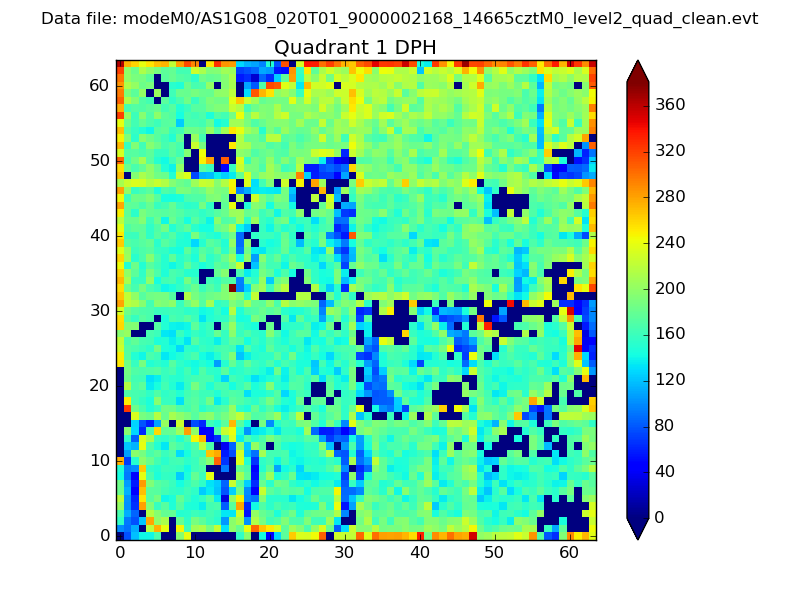 |
Quadrant B |
|---|---|---|---|
| Quadrant D | 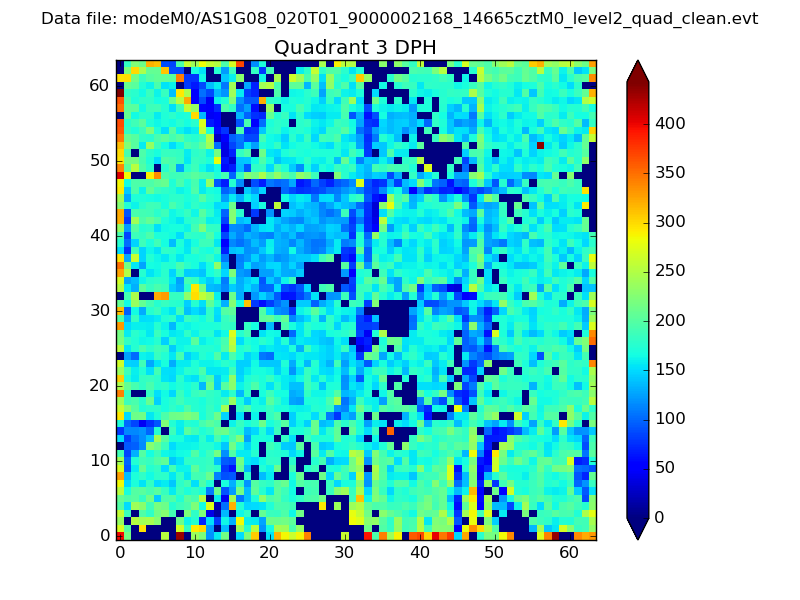 |
 |
Quadrant C |
| Plot type | Count rate plots | Images |
|---|---|---|
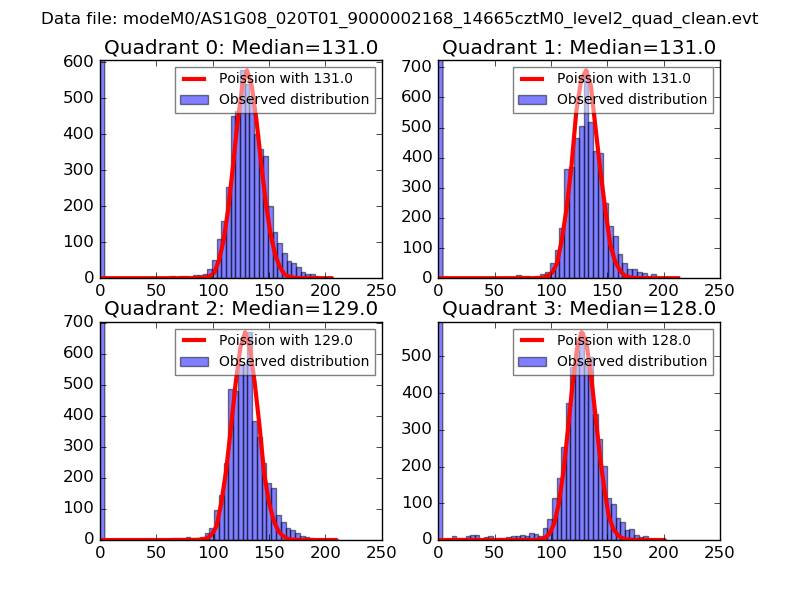
| Comparison with Poisson distribution Blue bars denote a histogram of data divided into 1 sec bins. Red curve is a Poisson curve with rate = median count rate of data. |
 |
 |
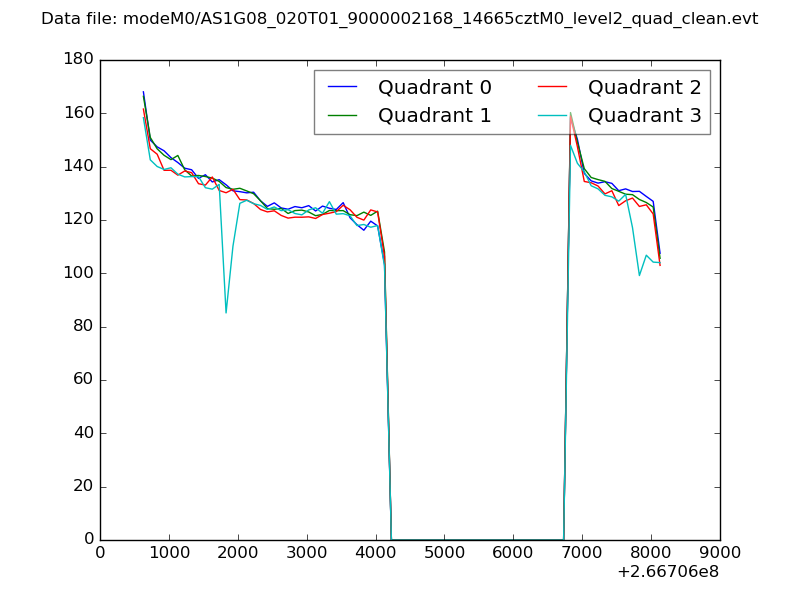
| Quadrant-wise count rates Data is divided into 100 sec bins |
 |
|
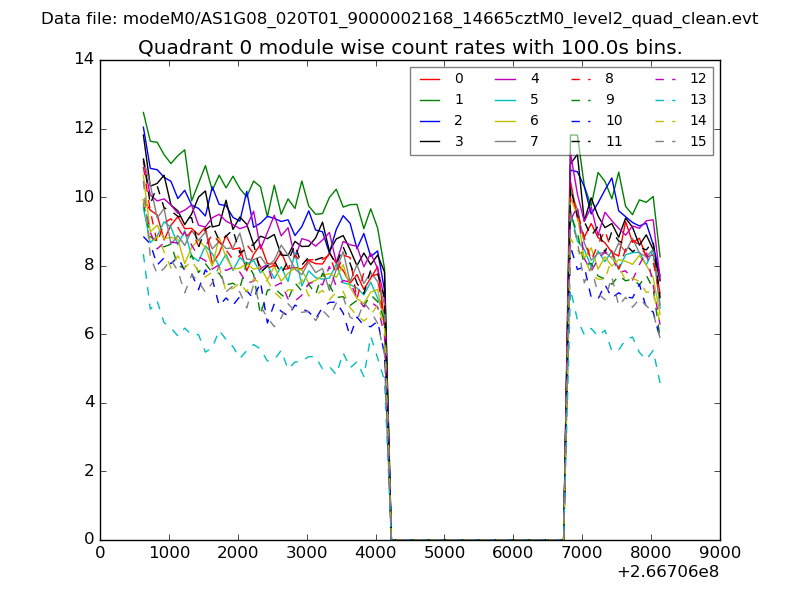
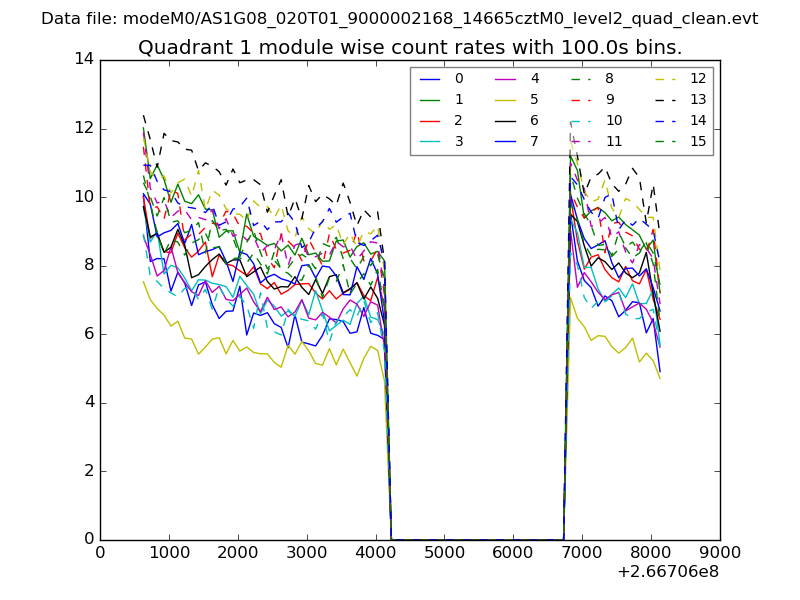
| Module-wise count rates for Quadrant A Data is divided into 100 sec bins |
 |
 |
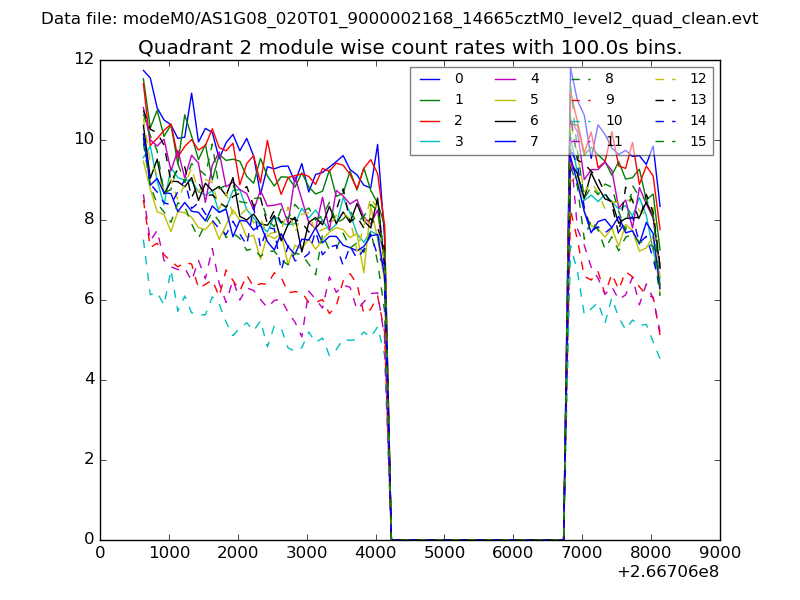
| Module-wise count rates for Quadrant B Data is divided into 100 sec bins |
 |
 |
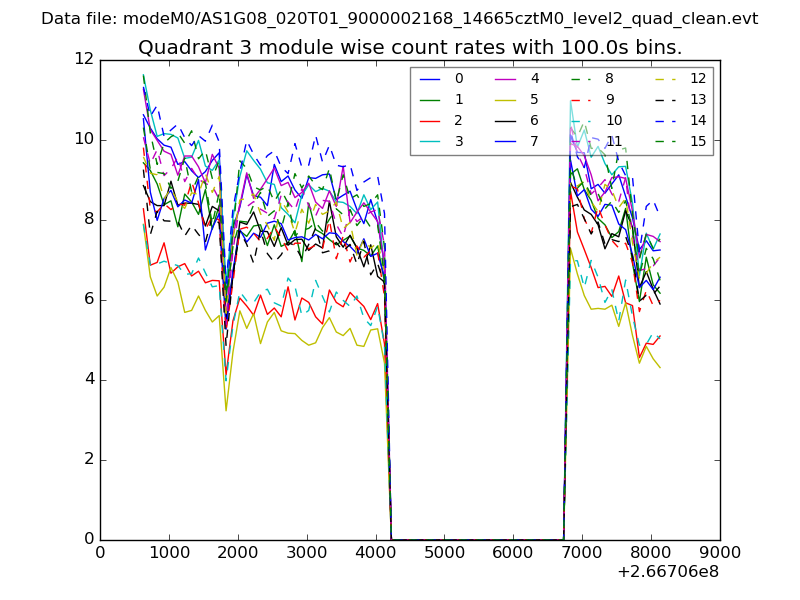
| Module-wise count rates for Quadrant C Data is divided into 100 sec bins |
 |
 |
| Module-wise count rates for Quadrant D Data is divided into 100 sec bins |
 |
 |
| Parameter | Plot |
|---|---|
| CZT HV Monitor | 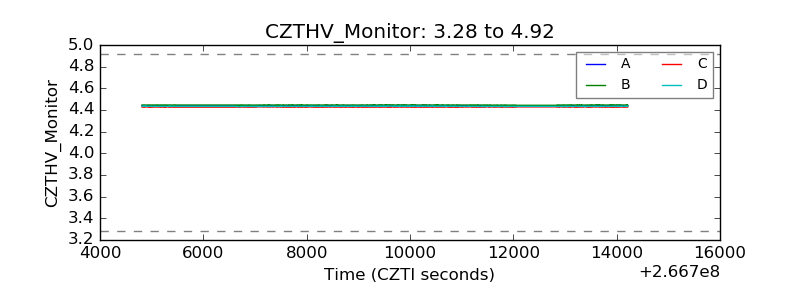 |
| D_VDD | 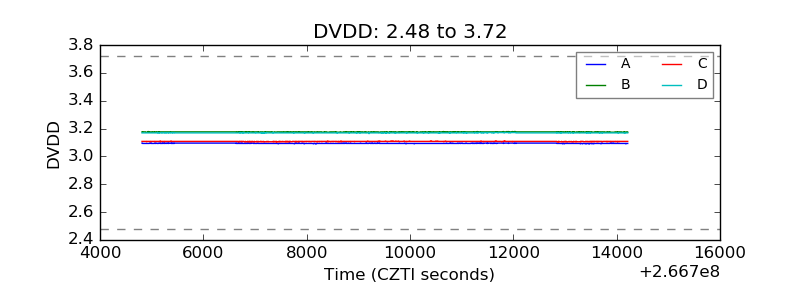 |
| Temperature 1 | 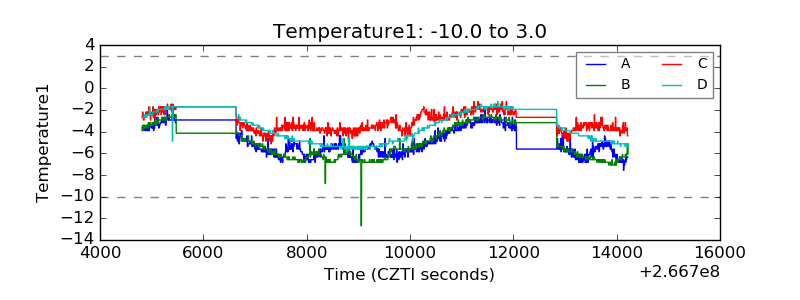 |
| Veto HV Monitor | 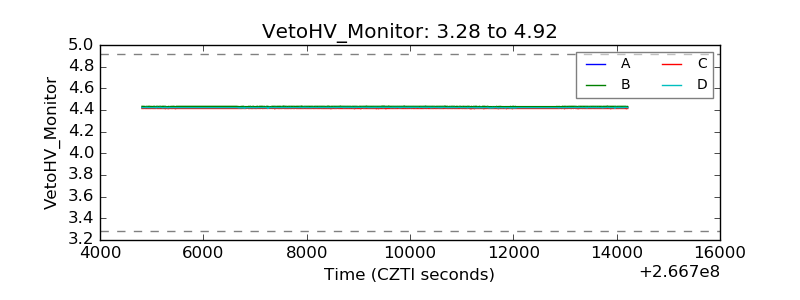 |
| Veto LLD | 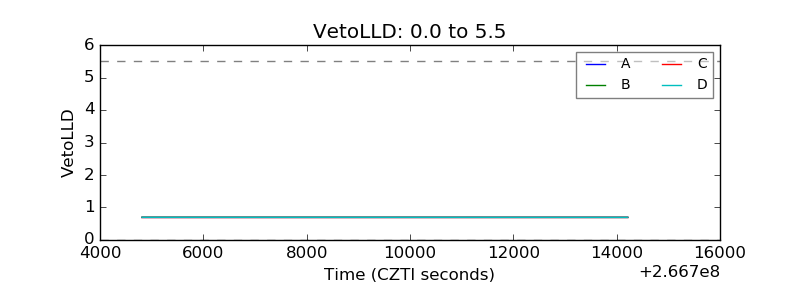 |
| Alpha Counter | 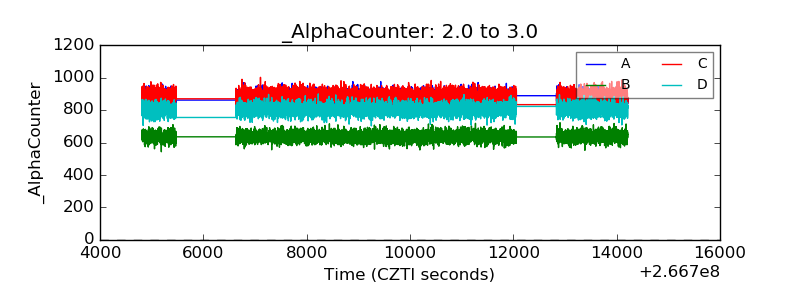 |
| _CPM_Rate | 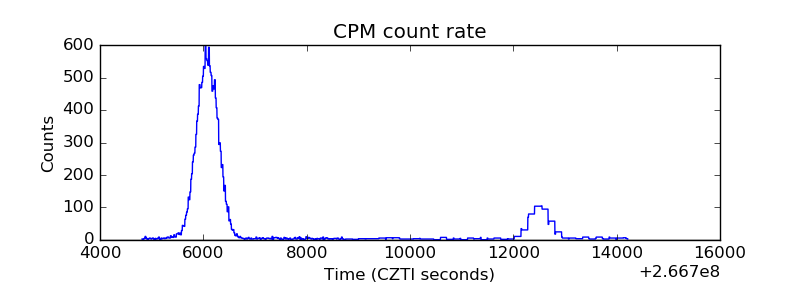 |
| CZT Counter |  |
| +2.5 Volts monitor | 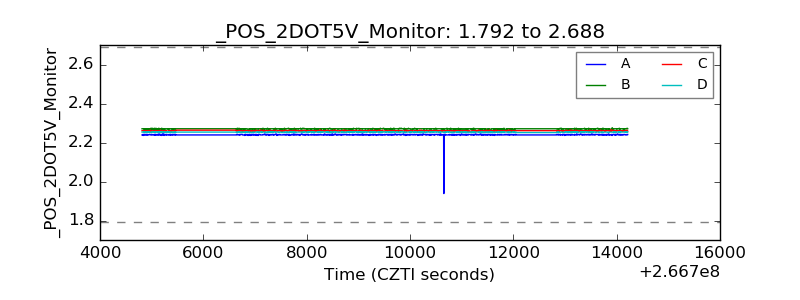 |
| +5 Volts monitor |  |
| _ROLL_ROT | 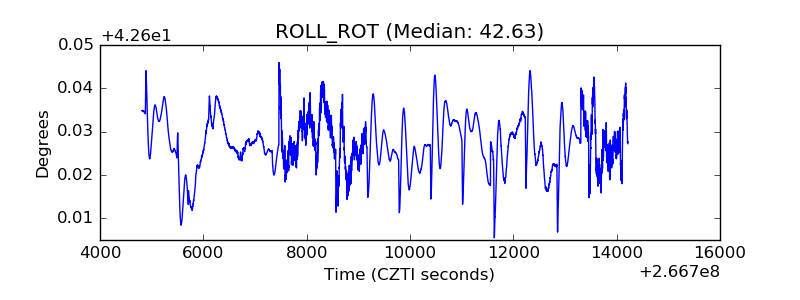 |
| _Roll_DEC | 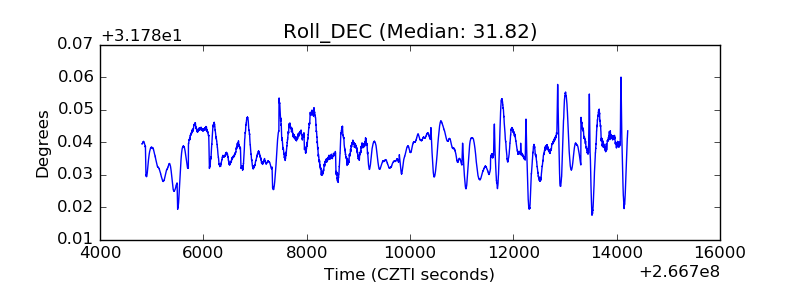 |
| _Roll_RA | 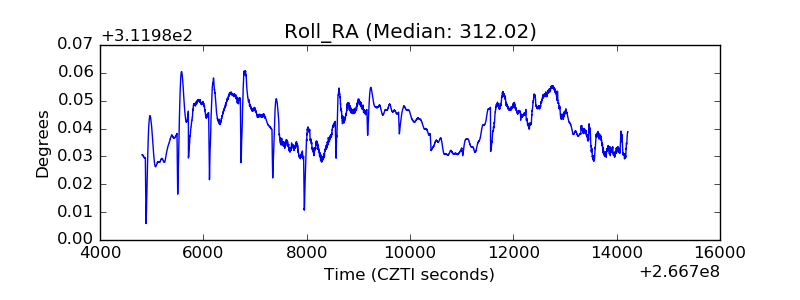 |
| Veto Counter |  |