| Param | Original file | Final file |
|---|---|---|
| Filename | modeM0/AS1T02_065T01_9000002218_15081cztM0_level2.evt | modeM0/AS1T02_065T01_9000002218_15081cztM0_level2_quad_clean.evt |
| Size (bytes) | 499,613,760 | 88,807,680 |
| Size | 476.5 MB | 84.7 MB |
| Events in quadrant A | 3,085,432 | 573,707 |
| Events in quadrant B | 3,183,665 | 590,301 |
| Events in quadrant C | 4,010,435 | 558,532 |
| Events in quadrant D | 4,428,720 | 532,115 |
| Mode M0 | |||
|---|---|---|---|
| Quadrant | BADHDUFLAG | Total packets | Discarded packets |
| A | 0 | 12953 | 3 |
| B | 0 | 13181 | 2 |
| C | 0 | 16151 | 2 |
| D | 0 | 17201 | 2 |
| Mode M9 | |||
|---|---|---|---|
| Quadrant | BADHDUFLAG | Total packets | Discarded packets |
| A | 0 | 24 | 0 |
| B | 0 | 24 | 0 |
| C | 0 | 24 | 0 |
| D | 0 | 25 | 0 |
| Mode SS | |||
|---|---|---|---|
| Quadrant | BADHDUFLAG | Total packets | Discarded packets |
| A | 0 | 128 | 0 |
| B | 0 | 128 | 0 |
| C | 0 | 128 | 0 |
| D | 0 | 128 | 0 |
| Quadrant | Total seconds | Saturated seconds | Saturation percentage |
|---|---|---|---|
| A | 6224 | 11 | 0.176735% |
| B | 6224 | 17 | 0.273136% |
| C | 6224 | 38 | 0.610540% |
| D | 6224 | 532 | 8.547558% |
Noise dominated data is calculated using 1-second bins in cleaned event files. If a bin has >2000 counts, and if more than 50% of those come from <1% of pixels, then it is considered to be noise-dominated and hence unusable.
| Quadrant | # 1 sec bins | Bins with >0 counts | Bins with >2000 counts | High rate bins dominated by noise | Noise dominated (total time) | Noise dominated (detector-on time) | Marked lightcurve |
|---|---|---|---|---|---|---|---|
| A | 7570 | 6226 | 0 | 0 | 0.00% | 0.00% | 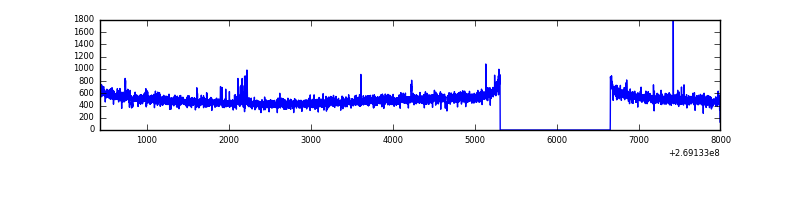 |
| B | 7570 | 6226 | 0 | 0 | 0.00% | 0.00% | 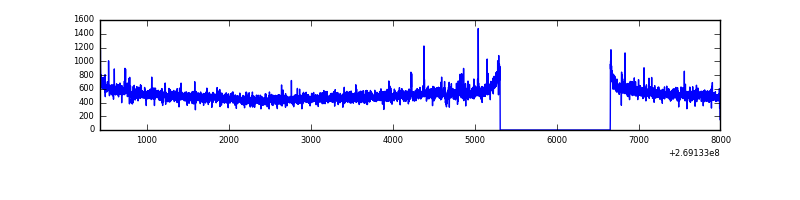 |
| C | 7570 | 6226 | 0 | 0 | 0.00% | 0.00% | 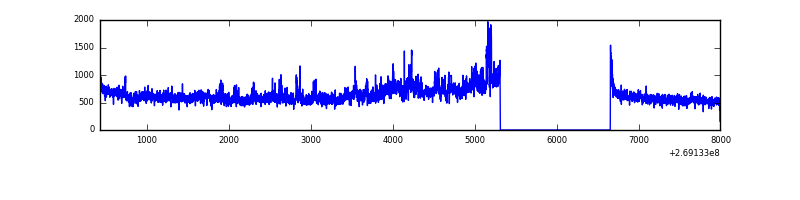 |
| D | 7570 | 6226 | 514 | 514 | 6.79% | 8.26% | 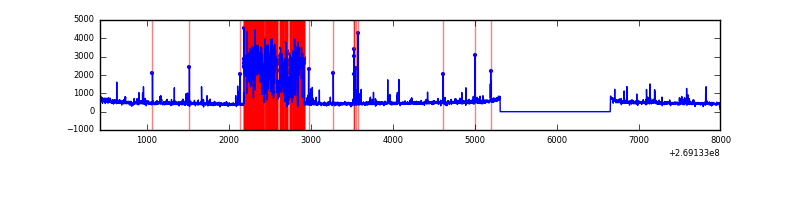 |
Top three noisy pixels from each quadrant. If the there are fewer than three noisy pixels in the level2.evt file, extra rows are filled as -1
| Pixel properties | Quadrant properties | ||||||
|---|---|---|---|---|---|---|---|
| Quadrant | DetID | PixID | Counts | Sigma | Mean | Median | Sigma |
| A | 12 | 189 | 24092 | 146.04 | 796 | 782 | 159.6 |
| A | 0 | 226 | 7094 | 39.55 | 796 | 782 | 159.6 |
| A | 12 | 194 | 5907 | 32.11 | 796 | 782 | 159.6 |
| B | 12 | 111 | 17753 | 112.16 | 801 | 782 | 151.3 |
| B | 11 | 111 | 14857 | 93.02 | 801 | 782 | 151.3 |
| B | 14 | 111 | 12776 | 79.27 | 801 | 782 | 151.3 |
| C | 3 | 233 | 877413 | 5012.87 | 767 | 774 | 174.9 |
| C | 7 | 247 | 141075 | 802.28 | 767 | 774 | 174.9 |
| C | 13 | 61 | 5355 | 26.2 | 767 | 774 | 174.9 |
| D | 9 | 1 | 1507391 | 8494.22 | 730 | 709 | 177.4 |
| D | 13 | 249 | 83276 | 465.49 | 730 | 709 | 177.4 |
| D | 13 | 104 | 33655 | 185.74 | 730 | 709 | 177.4 |
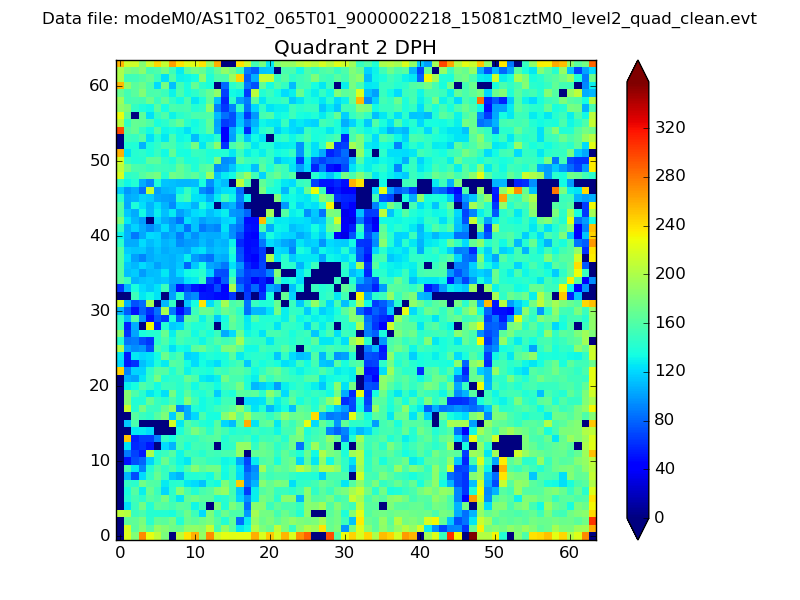
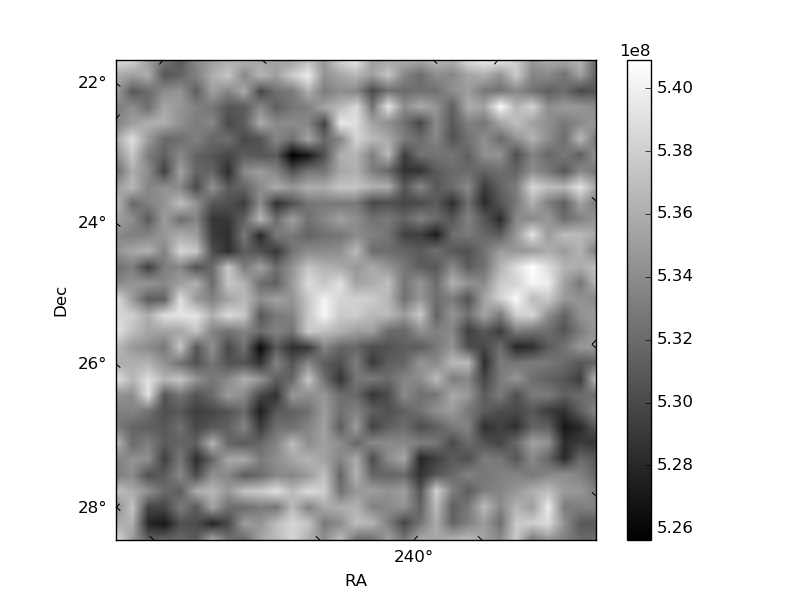
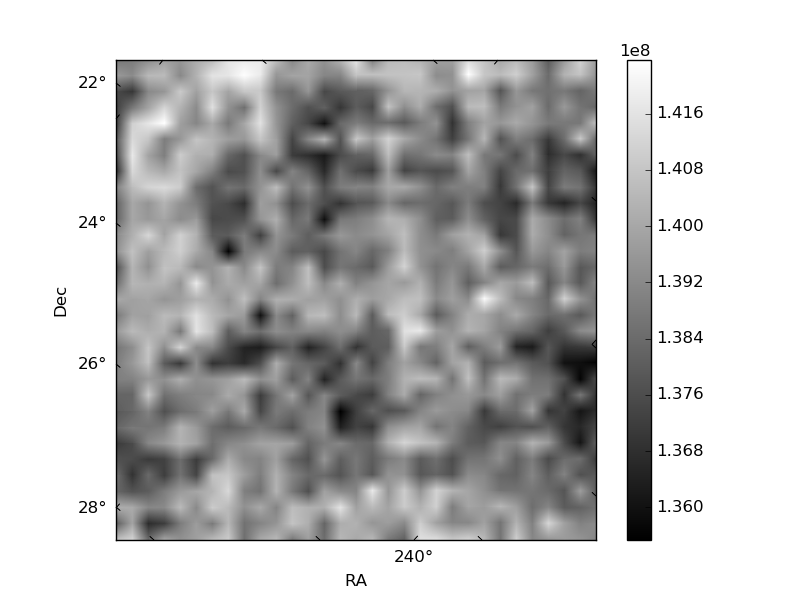
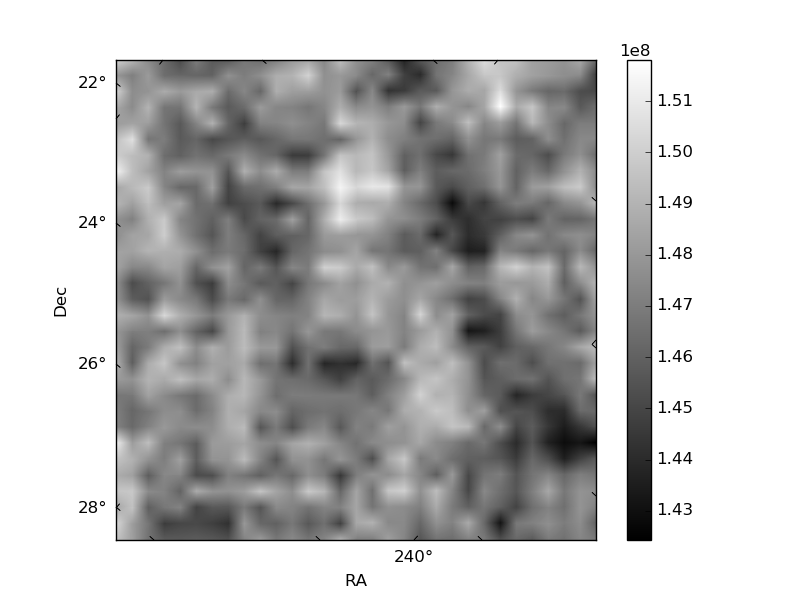
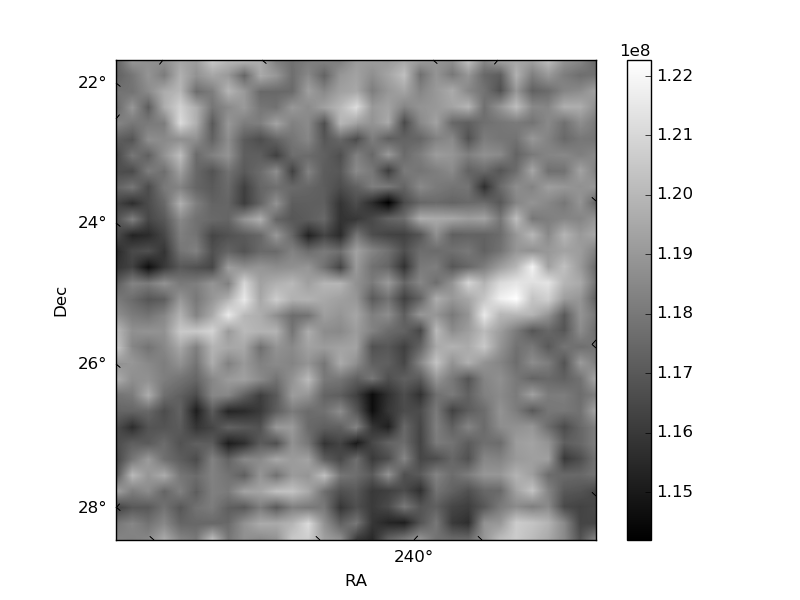
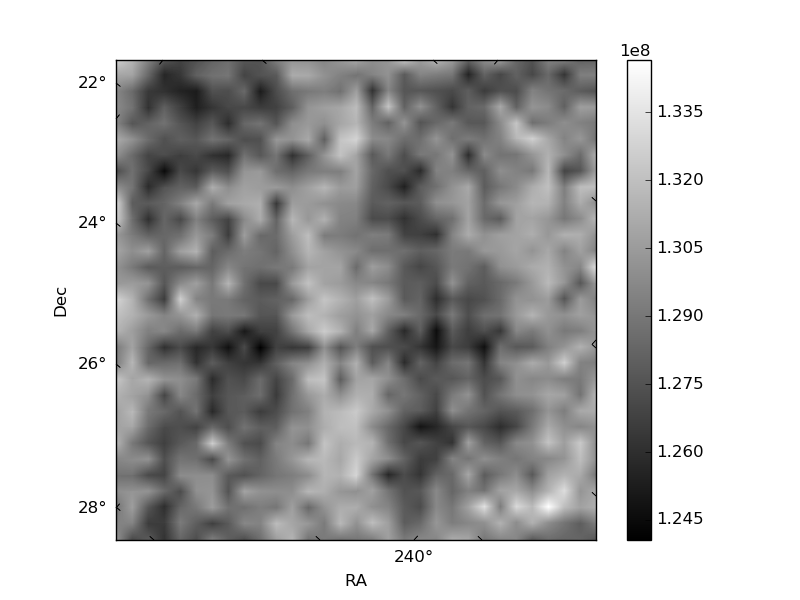
Histogram calculated using DETX and DETY for each event in the final _common_clean file
| Quadrant A | 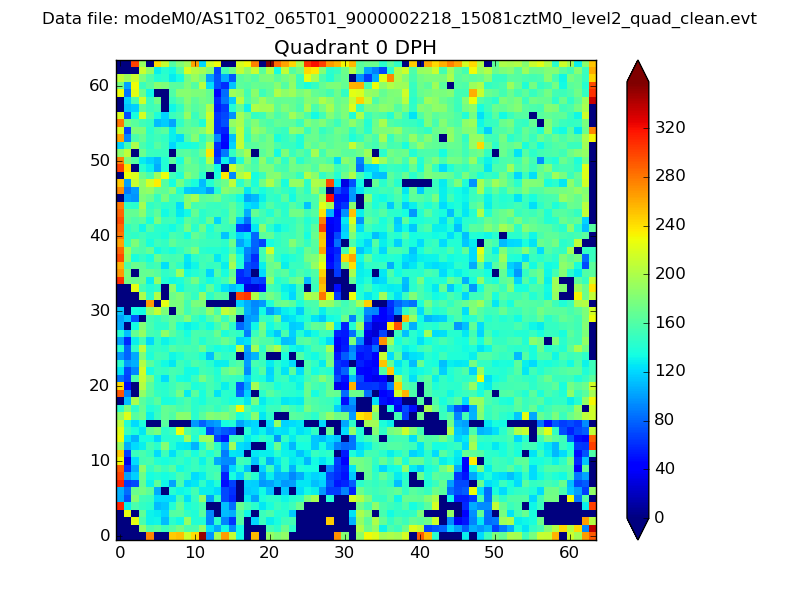 |
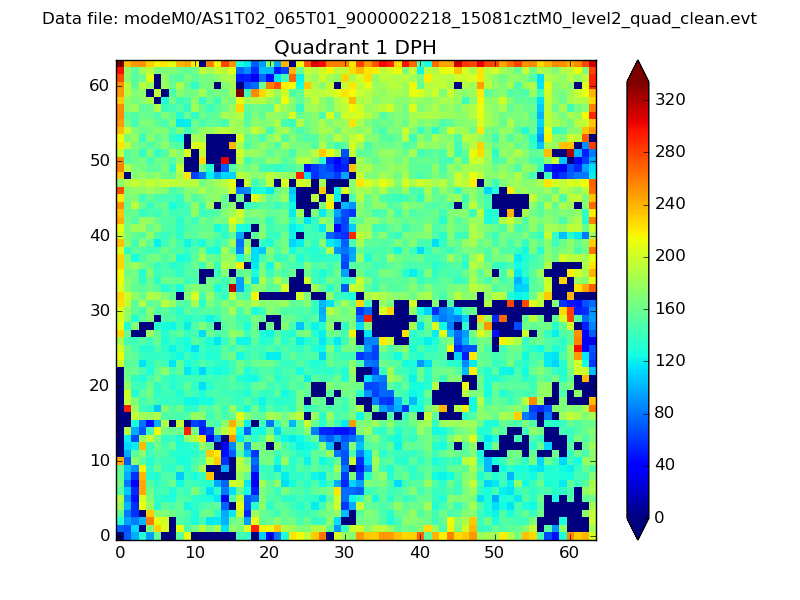 |
Quadrant B |
|---|---|---|---|
| Quadrant D | 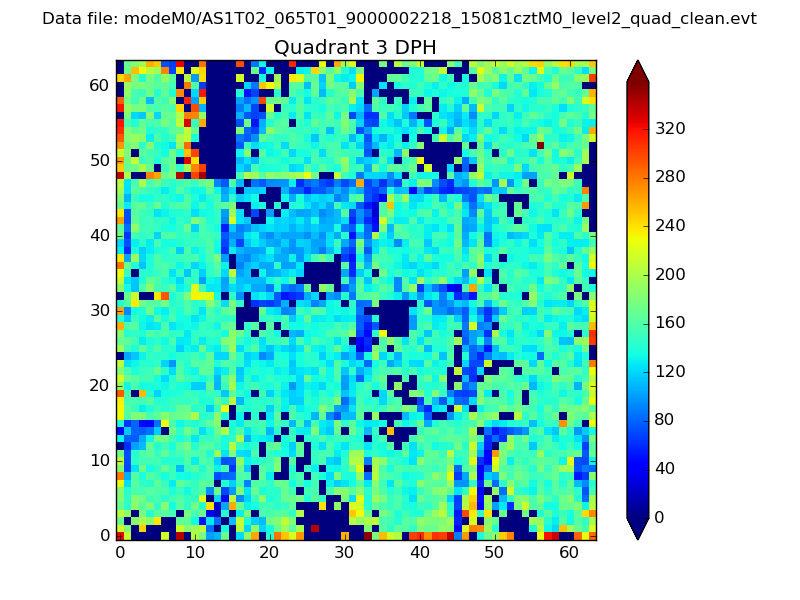 |
 |
Quadrant C |
| Plot type | Count rate plots | Images |
|---|---|---|
| Comparison with Poisson distribution Blue bars denote a histogram of data divided into 1 sec bins. Red curve is a Poisson curve with rate = median count rate of data. |
 |
 |
| Quadrant-wise count rates Data is divided into 100 sec bins |
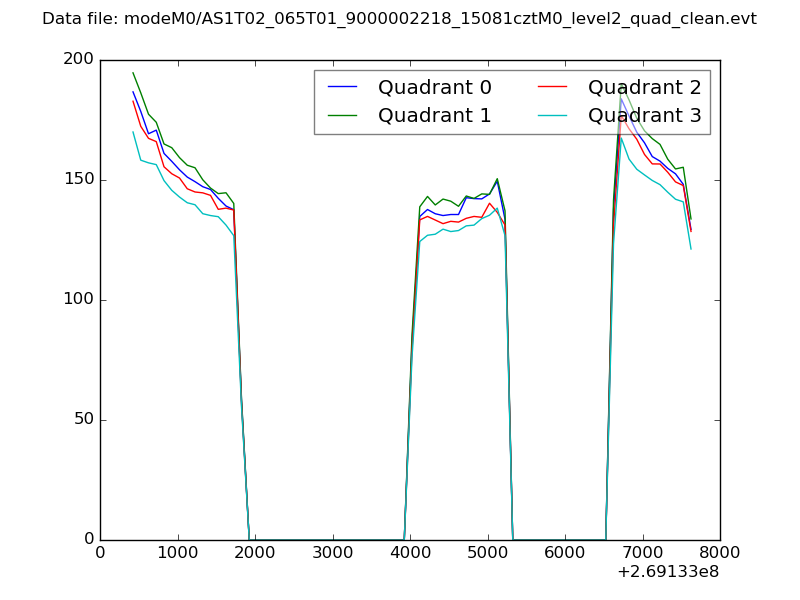 |
|
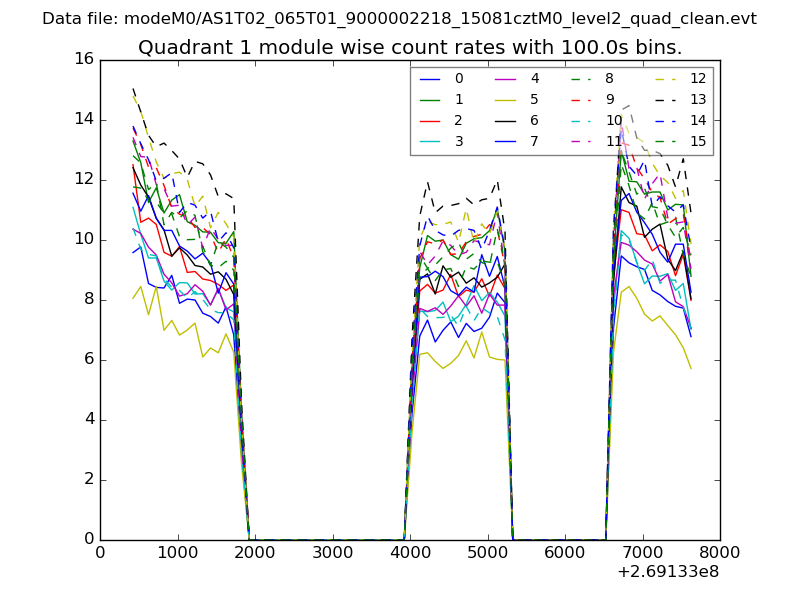
| Module-wise count rates for Quadrant A Data is divided into 100 sec bins |
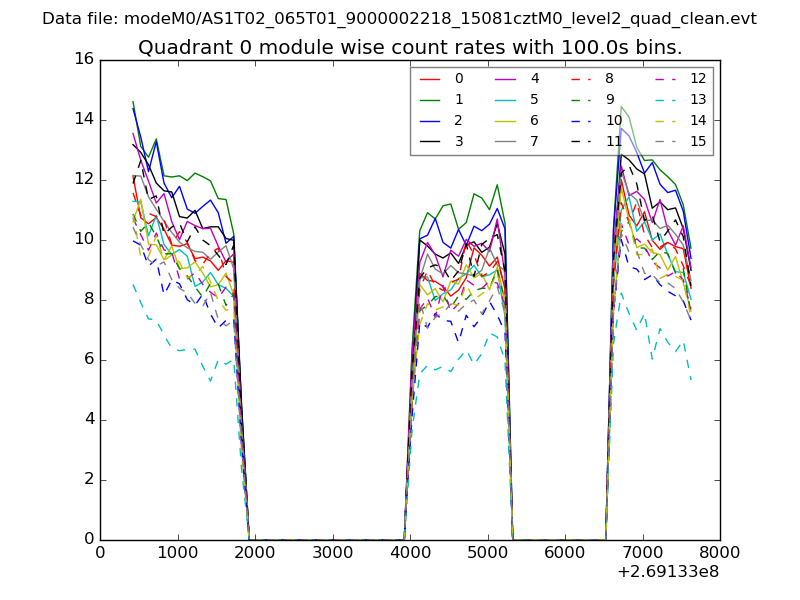 |
 |
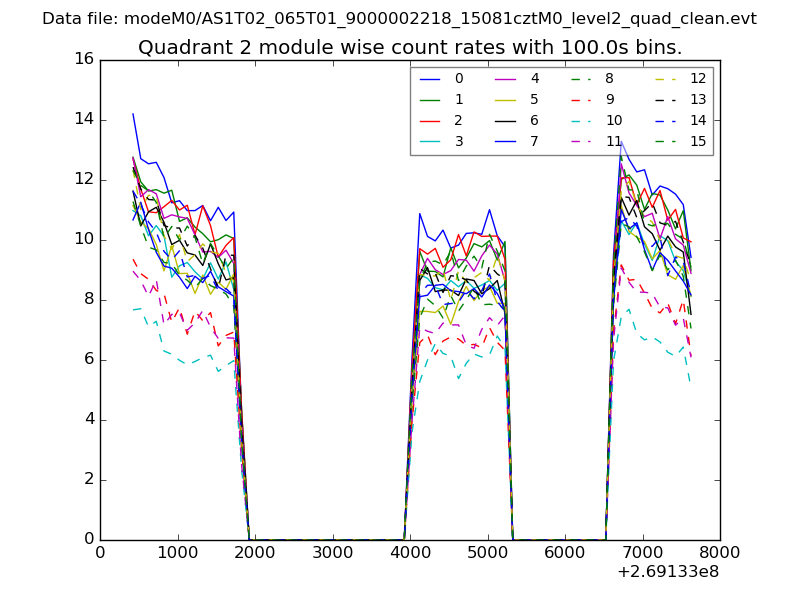
| Module-wise count rates for Quadrant B Data is divided into 100 sec bins |
 |
 |
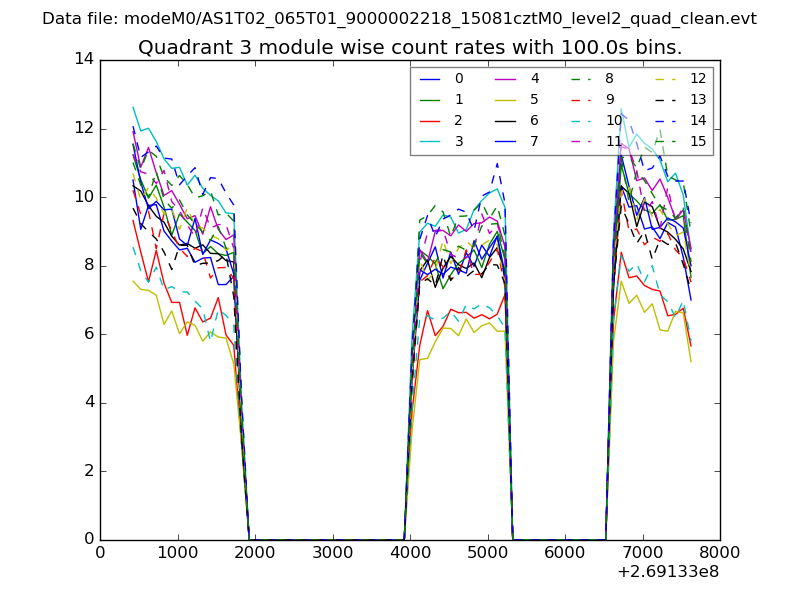
| Module-wise count rates for Quadrant C Data is divided into 100 sec bins |
 |
 |
| Module-wise count rates for Quadrant D Data is divided into 100 sec bins |
 |
 |
| Parameter | Plot |
|---|---|
| CZT HV Monitor | 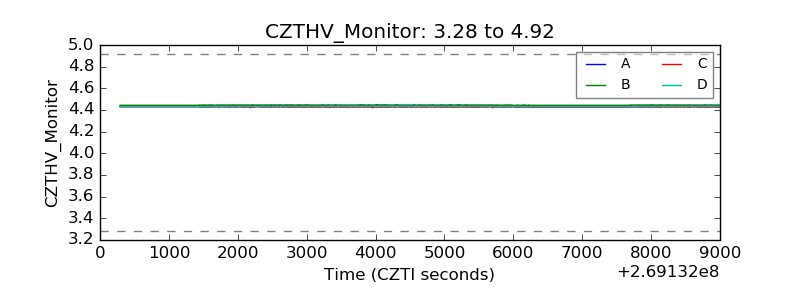 |
| D_VDD | 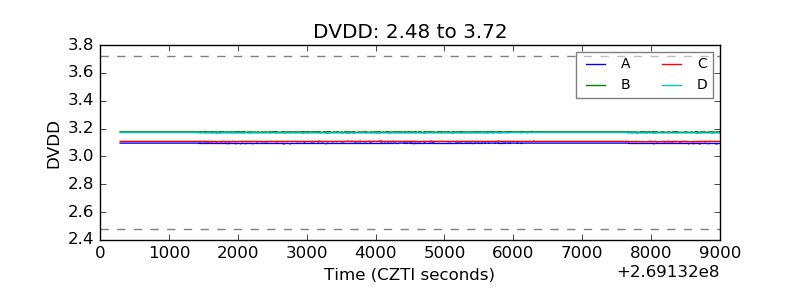 |
| Temperature 1 | 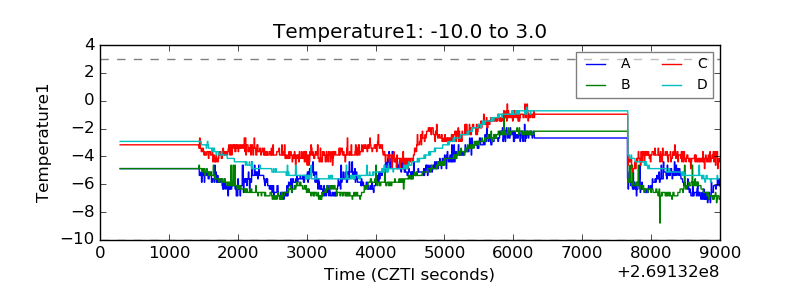 |
| Veto HV Monitor | 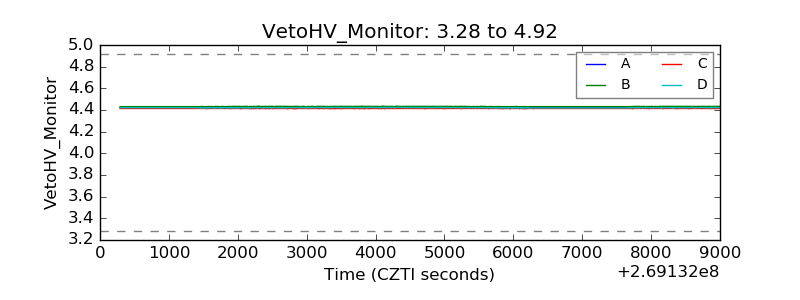 |
| Veto LLD | 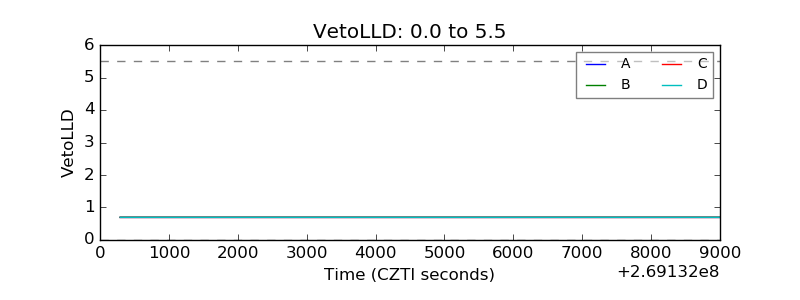 |
| Alpha Counter | 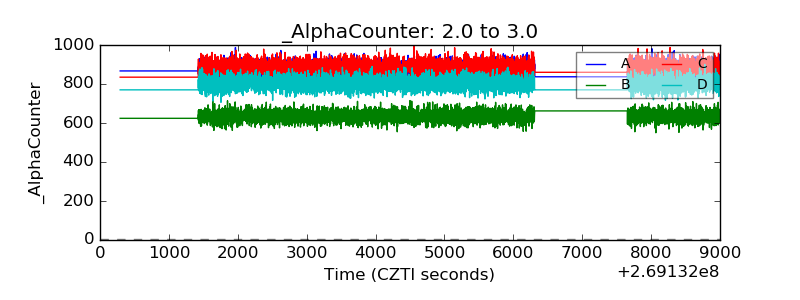 |
| _CPM_Rate | 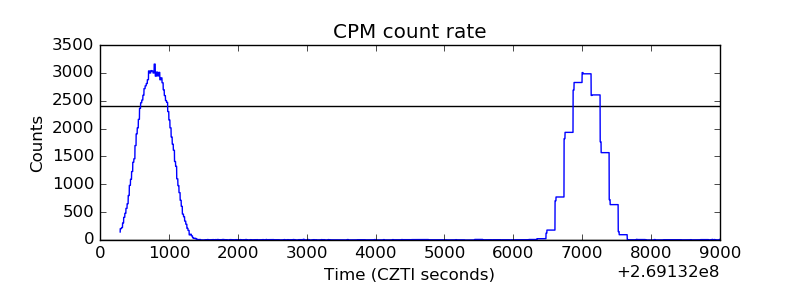 |
| CZT Counter | 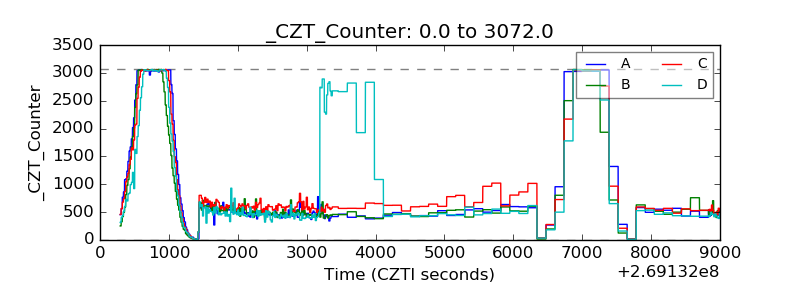 |
| +2.5 Volts monitor |  |
| +5 Volts monitor |  |
| _ROLL_ROT | 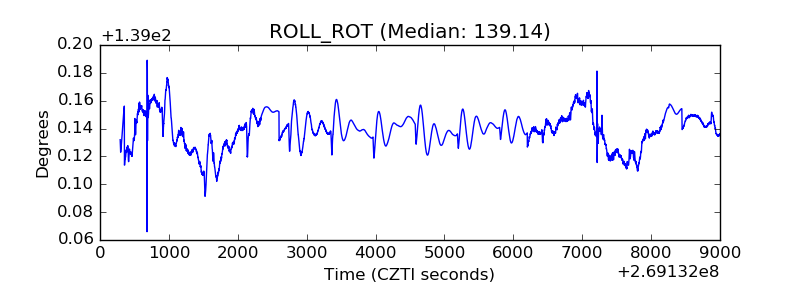 |
| _Roll_DEC | 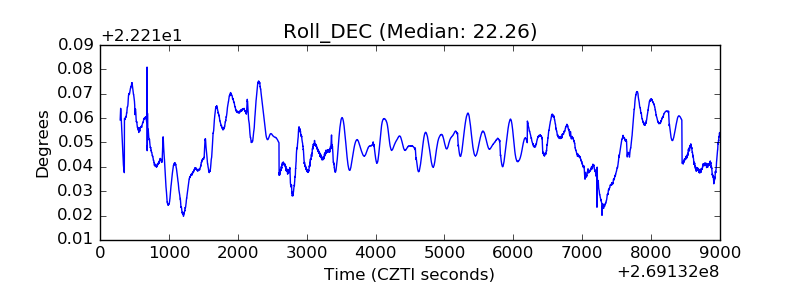 |
| _Roll_RA | 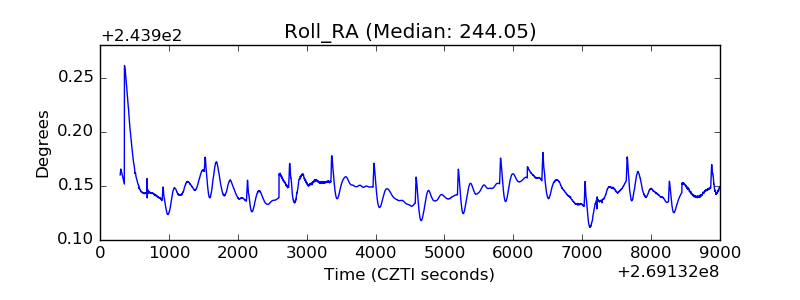 |
| Veto Counter | 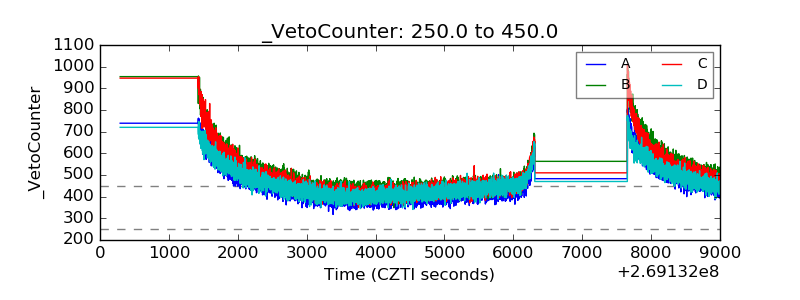 |