| Param | Original file | Final file |
|---|---|---|
| Filename | modeM0/AS1G08_031T01_9000002314_15617cztM0_level2.evt | modeM0/AS1G08_031T01_9000002314_15617cztM0_level2_quad_clean.evt |
| Size (bytes) | 400,144,320 | 80,864,640 |
| Size | 381.6 MB | 77.1 MB |
| Events in quadrant A | 2,919,924 | 523,258 |
| Events in quadrant B | 2,995,332 | 528,982 |
| Events in quadrant C | 2,952,356 | 503,886 |
| Events in quadrant D | 2,869,554 | 500,680 |
| Mode M9 | |||
|---|---|---|---|
| Quadrant | BADHDUFLAG | Total packets | Discarded packets |
| A | 0 | 13 | 0 |
| B | 0 | 13 | 0 |
| C | 0 | 13 | 0 |
| D | 0 | 13 | 0 |
| Mode M0 | |||
|---|---|---|---|
| Quadrant | BADHDUFLAG | Total packets | Discarded packets |
| A | 0 | 11801 | 2 |
| B | 0 | 12115 | 1 |
| C | 0 | 11907 | 1 |
| D | 0 | 11810 | 1 |
| Mode SS | |||
|---|---|---|---|
| Quadrant | BADHDUFLAG | Total packets | Discarded packets |
| A | 0 | 114 | 0 |
| B | 0 | 114 | 0 |
| C | 0 | 114 | 0 |
| D | 0 | 114 | 0 |
| Quadrant | Total seconds | Saturated seconds | Saturation percentage |
|---|---|---|---|
| A | 5604 | 58 | 1.034975% |
| B | 5604 | 76 | 1.356174% |
| C | 5604 | 88 | 1.570307% |
| D | 5604 | 55 | 0.981442% |
Noise dominated data is calculated using 1-second bins in cleaned event files. If a bin has >2000 counts, and if more than 50% of those come from <1% of pixels, then it is considered to be noise-dominated and hence unusable.
| Quadrant | # 1 sec bins | Bins with >0 counts | Bins with >2000 counts | High rate bins dominated by noise | Noise dominated (total time) | Noise dominated (detector-on time) | Marked lightcurve |
|---|---|---|---|---|---|---|---|
| A | 6910 | 5605 | 0 | 0 | 0.00% | 0.00% | 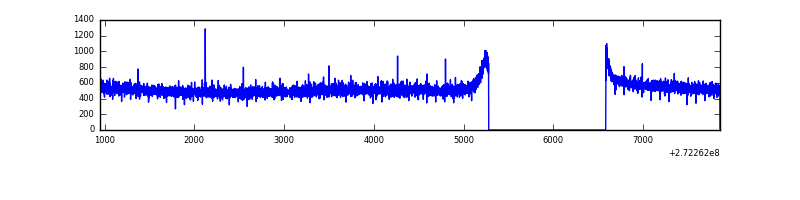 |
| B | 6910 | 5605 | 0 | 0 | 0.00% | 0.00% | 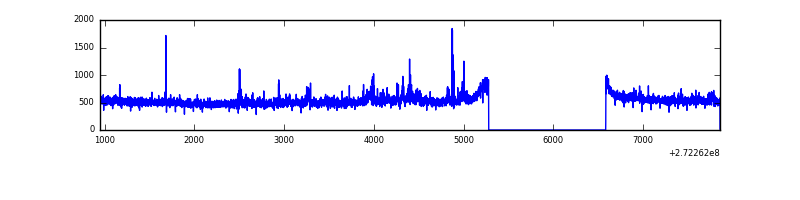 |
| C | 6910 | 5605 | 0 | 0 | 0.00% | 0.00% | 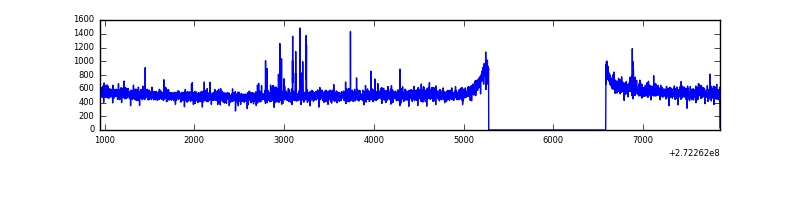 |
| D | 6910 | 5605 | 4 | 4 | 0.06% | 0.07% | 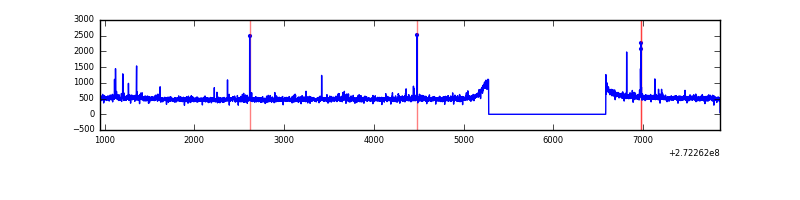 |
Top three noisy pixels from each quadrant. If the there are fewer than three noisy pixels in the level2.evt file, extra rows are filled as -1
| Pixel properties | Quadrant properties | ||||||
|---|---|---|---|---|---|---|---|
| Quadrant | DetID | PixID | Counts | Sigma | Mean | Median | Sigma |
| A | 3 | 80 | 11757 | 72.47 | 754 | 740 | 152.0 |
| A | 0 | 226 | 6655 | 38.91 | 754 | 740 | 152.0 |
| A | 15 | 222 | 5756 | 32.99 | 754 | 740 | 152.0 |
| B | 0 | 189 | 39587 | 278.43 | 739 | 721 | 139.6 |
| B | 3 | 209 | 32706 | 229.13 | 739 | 721 | 139.6 |
| B | 0 | 214 | 21779 | 150.85 | 739 | 721 | 139.6 |
| C | 14 | 238 | 111509 | 659.31 | 720 | 727 | 168.0 |
| C | 3 | 233 | 27518 | 159.44 | 720 | 727 | 168.0 |
| C | 13 | 61 | 5030 | 25.61 | 720 | 727 | 168.0 |
| D | 2 | 234 | 25969 | 140.32 | 739 | 719 | 179.9 |
| D | 12 | 110 | 22139 | 119.04 | 739 | 719 | 179.9 |
| D | 10 | 70 | 19883 | 106.5 | 739 | 719 | 179.9 |
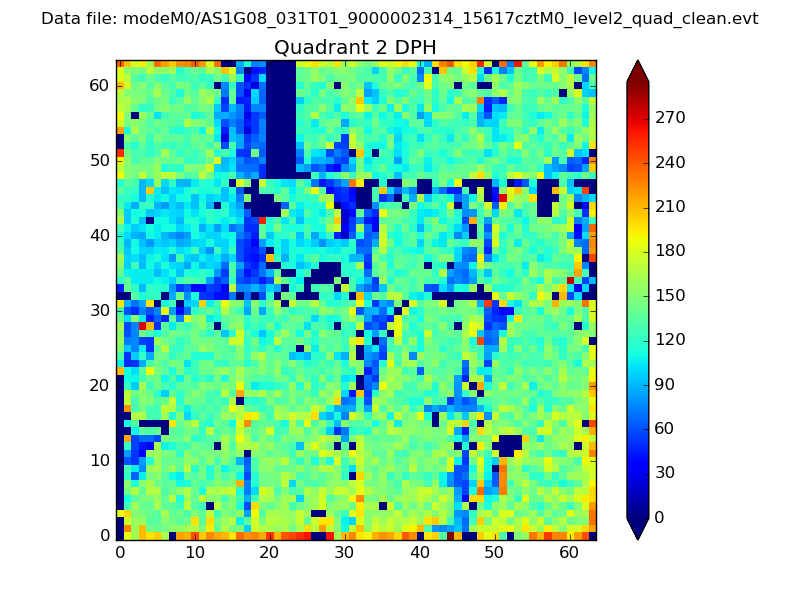
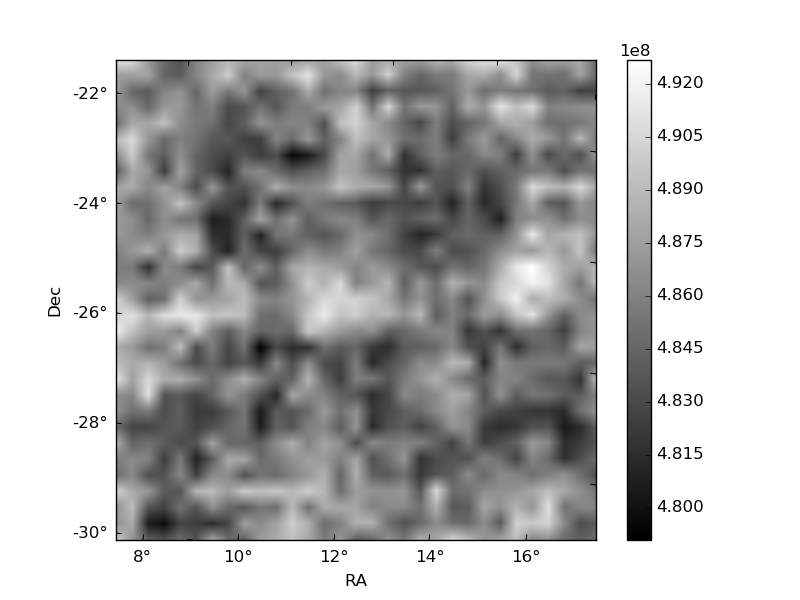
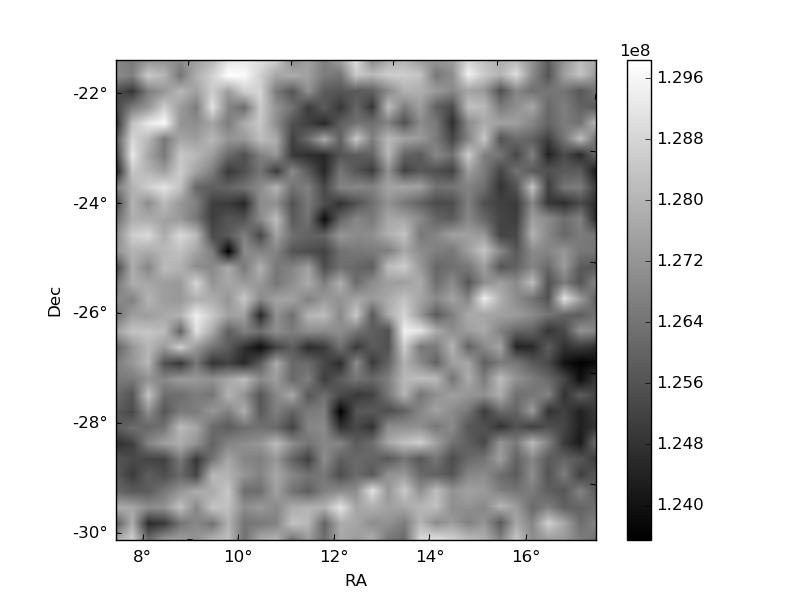
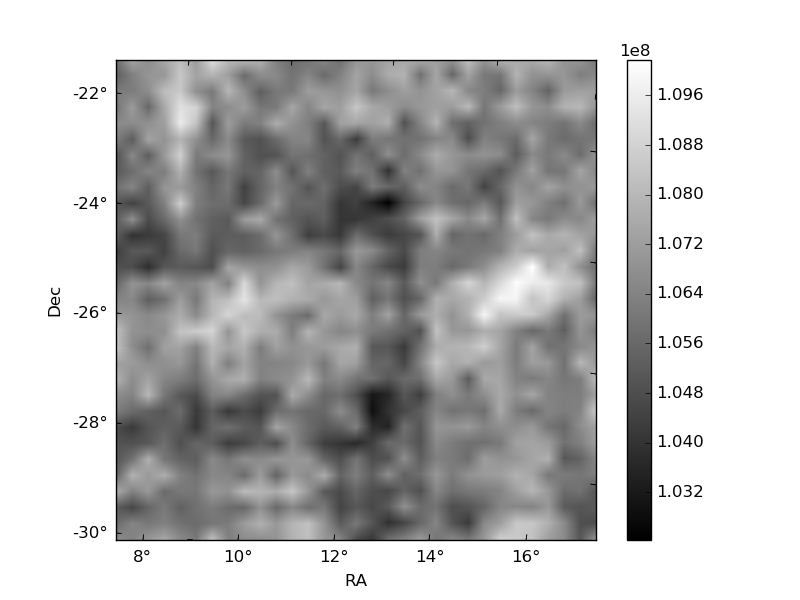
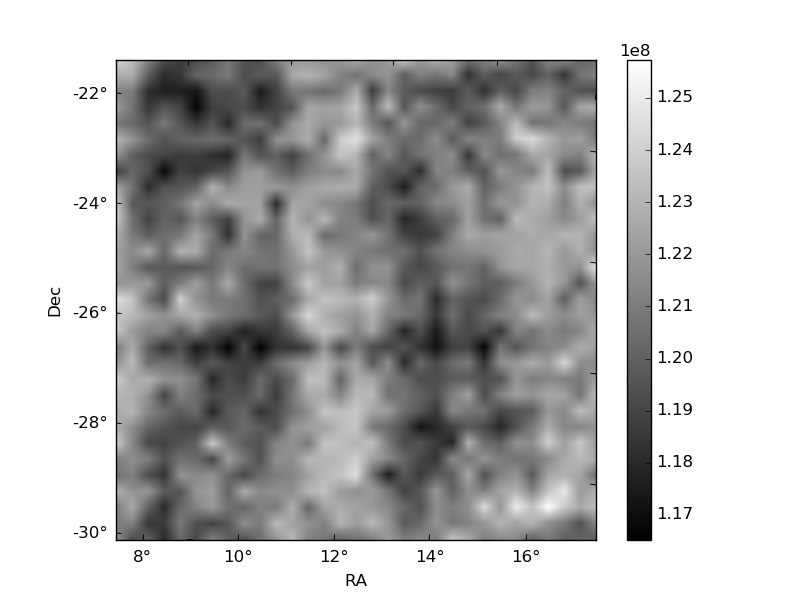
Histogram calculated using DETX and DETY for each event in the final _common_clean file
| Quadrant A | 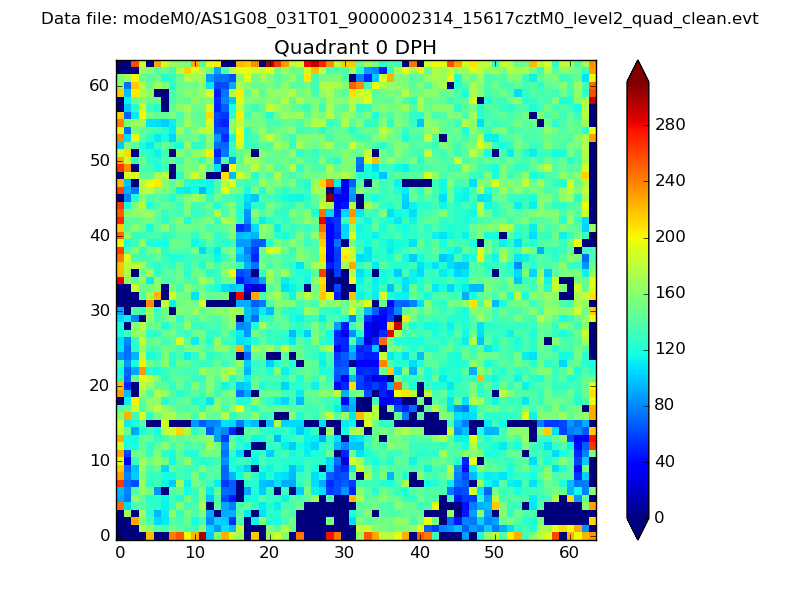 |
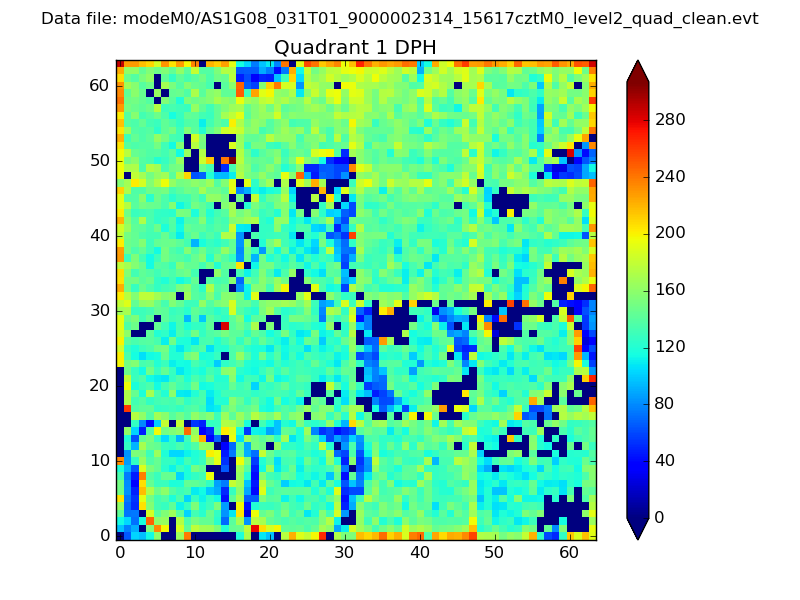 |
Quadrant B |
|---|---|---|---|
| Quadrant D | 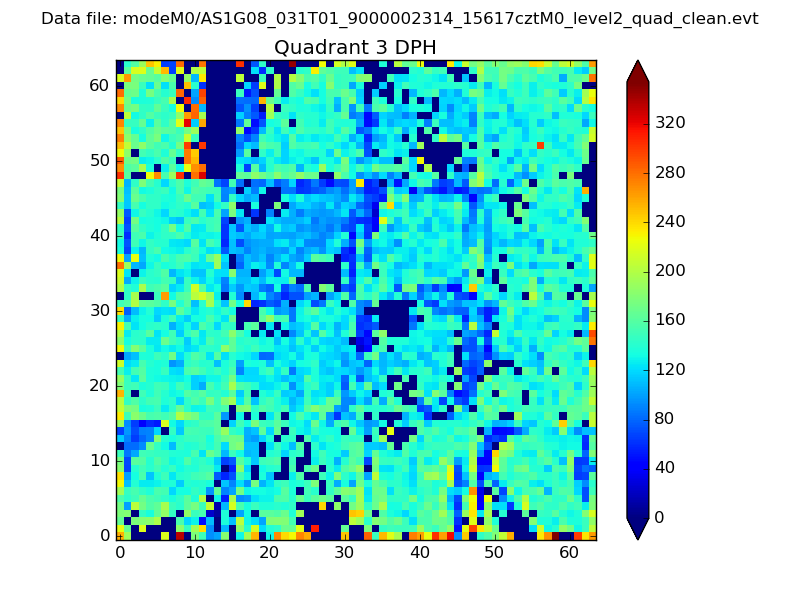 |
 |
Quadrant C |
| Plot type | Count rate plots | Images |
|---|---|---|
| Comparison with Poisson distribution Blue bars denote a histogram of data divided into 1 sec bins. Red curve is a Poisson curve with rate = median count rate of data. |
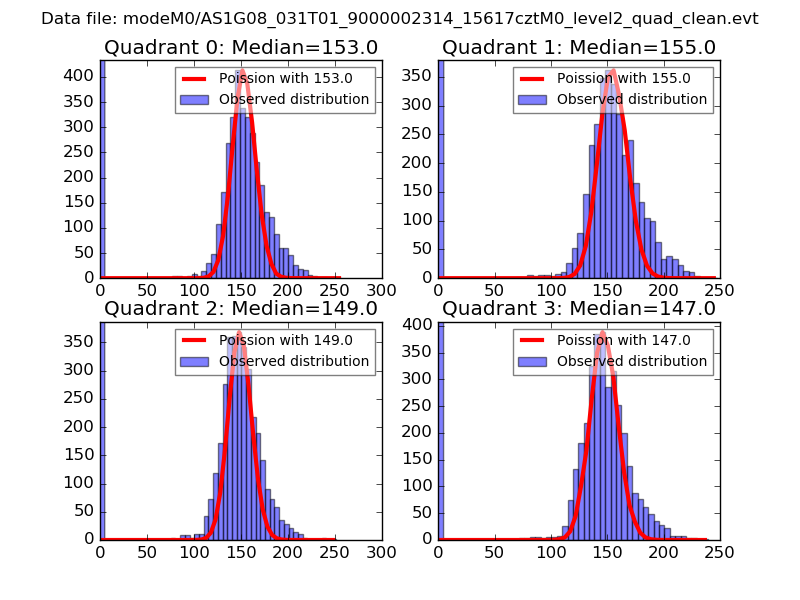 |
 |
| Quadrant-wise count rates Data is divided into 100 sec bins |
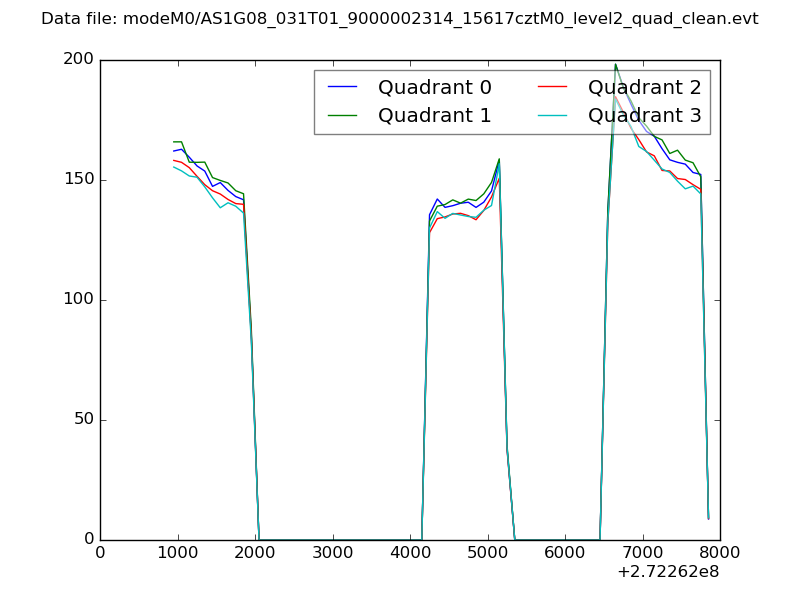 |
|
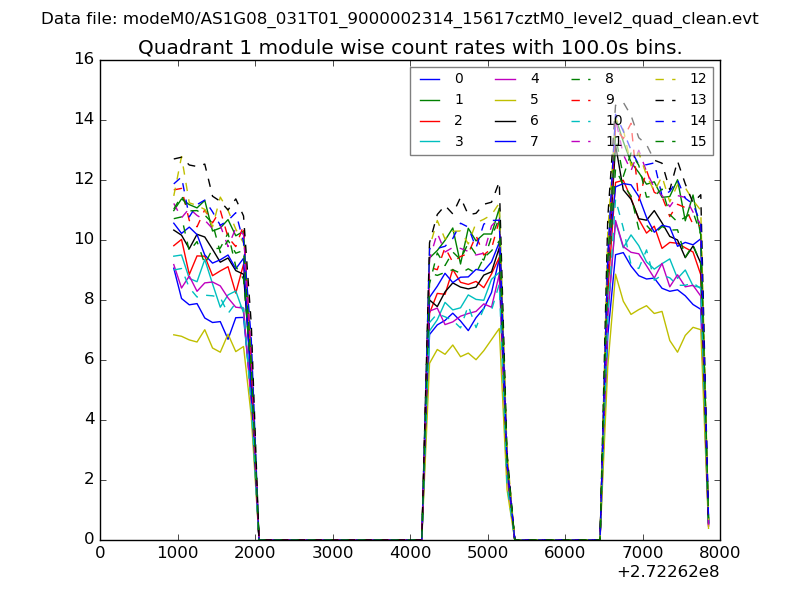
| Module-wise count rates for Quadrant A Data is divided into 100 sec bins |
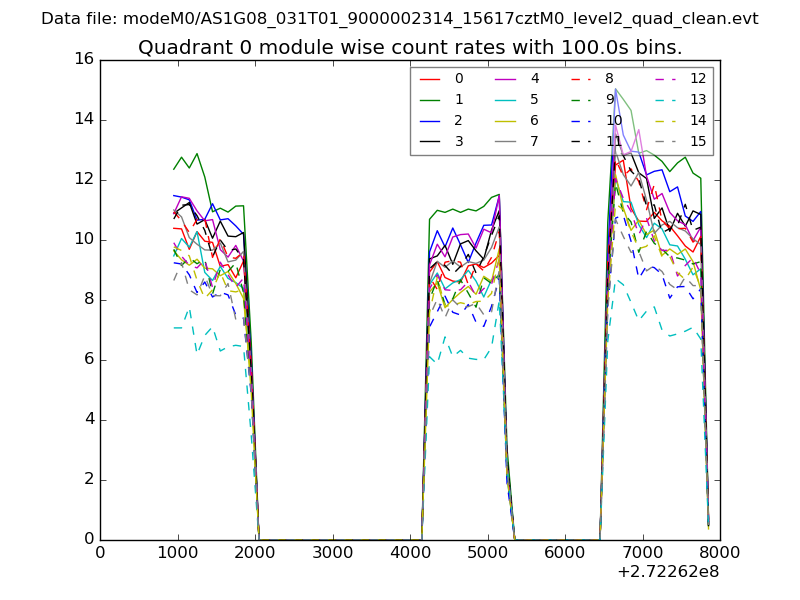 |
 |
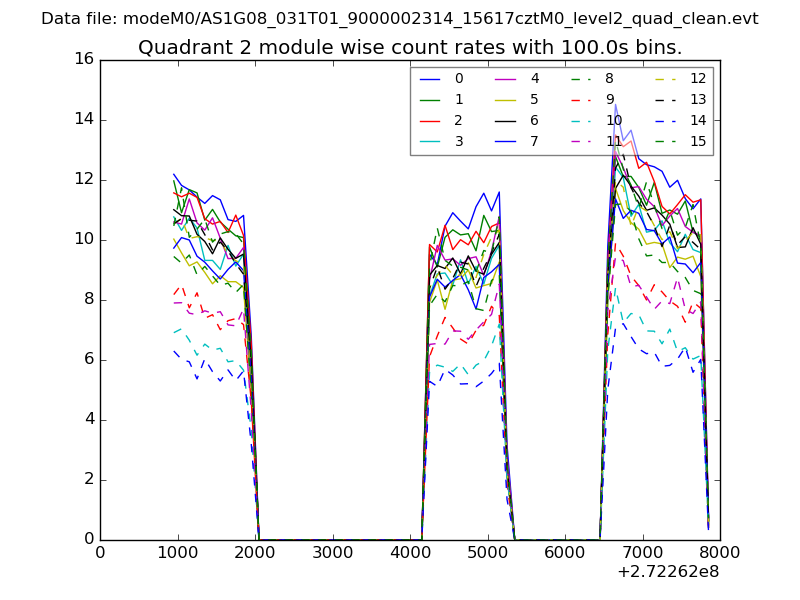
| Module-wise count rates for Quadrant B Data is divided into 100 sec bins |
 |
 |
| Module-wise count rates for Quadrant C Data is divided into 100 sec bins |
 |
 |
| Module-wise count rates for Quadrant D Data is divided into 100 sec bins |
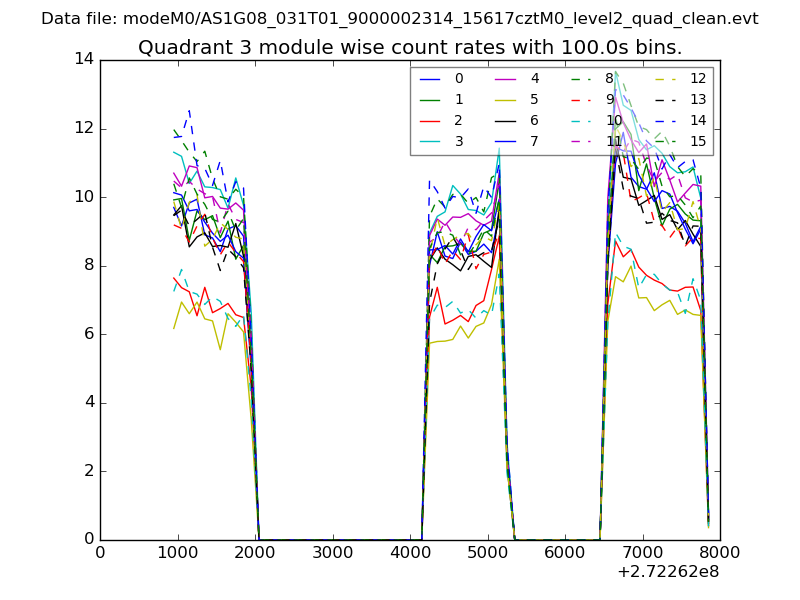 |
 |
| Parameter | Plot |
|---|---|
| CZT HV Monitor | 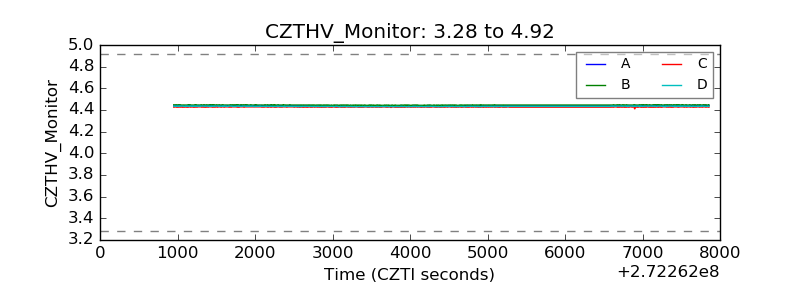 |
| D_VDD | 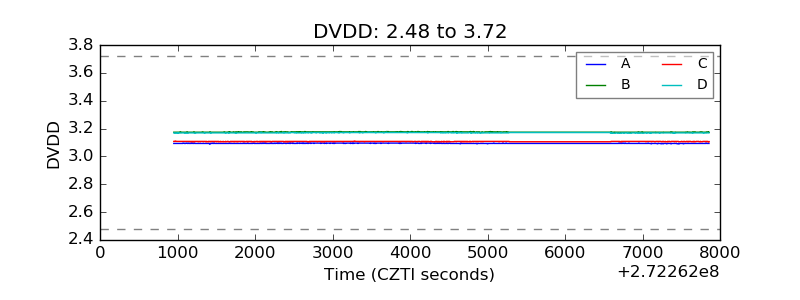 |
| Temperature 1 |  |
| Veto HV Monitor | 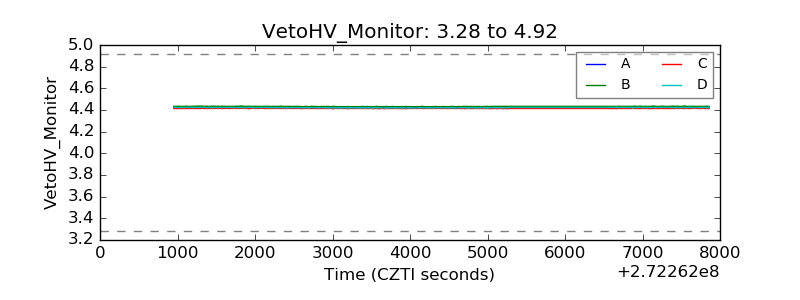 |
| Veto LLD | 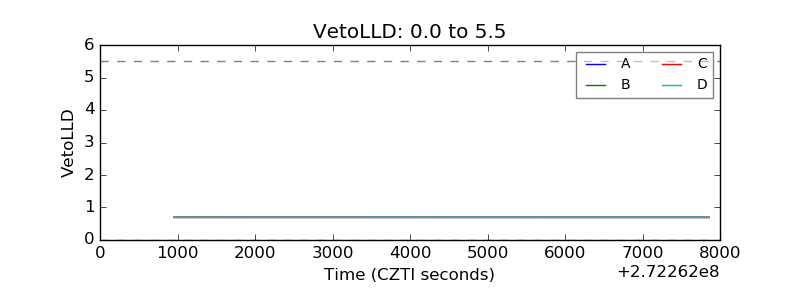 |
| Alpha Counter | 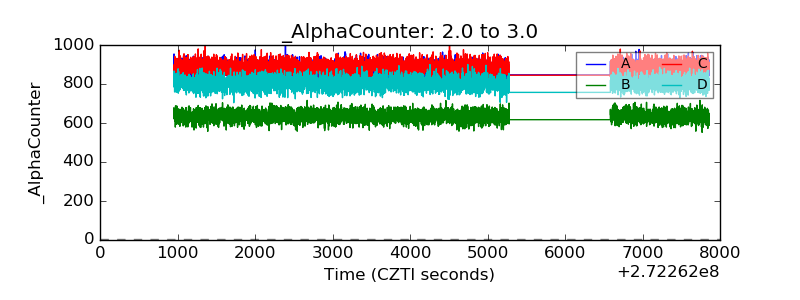 |
| _CPM_Rate | 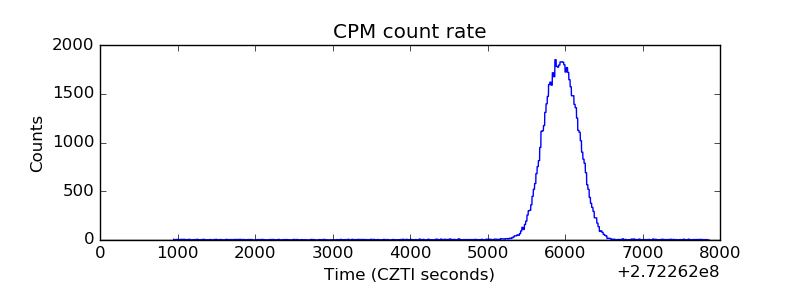 |
| CZT Counter | 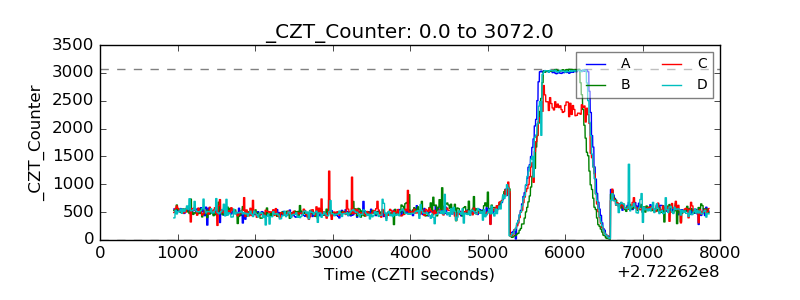 |
| +2.5 Volts monitor |  |
| +5 Volts monitor |  |
| _ROLL_ROT | 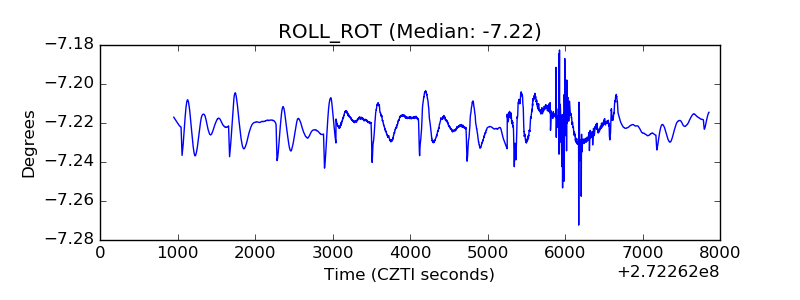 |
| _Roll_DEC |  |
| _Roll_RA | 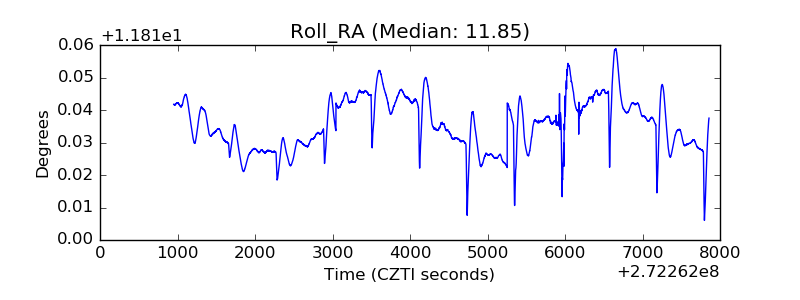 |
| Veto Counter | 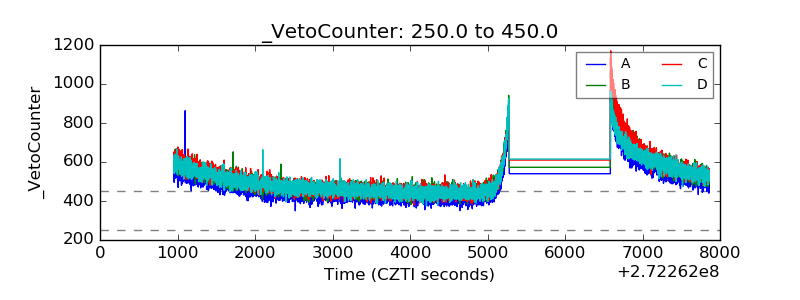 |