| Param | Original file | Final file |
|---|---|---|
| Filename | modeM0/AS1G08_028T01_9000002334_15763cztM0_level2.evt | modeM0/AS1G08_028T01_9000002334_15763cztM0_level2_quad_clean.evt |
| Size (bytes) | 113,008,320 | 21,579,840 |
| Size | 107.8 MB | 20.6 MB |
| Events in quadrant A | 805,765 | 136,742 |
| Events in quadrant B | 845,505 | 141,353 |
| Events in quadrant C | 811,041 | 132,851 |
| Events in quadrant D | 853,617 | 129,158 |
| Mode SS | |||
|---|---|---|---|
| Quadrant | BADHDUFLAG | Total packets | Discarded packets |
| A | 0 | 32 | 0 |
| B | 0 | 32 | 0 |
| C | 0 | 32 | 0 |
| D | 0 | 32 | 0 |
| Mode M0 | |||
|---|---|---|---|
| Quadrant | BADHDUFLAG | Total packets | Discarded packets |
| A | 0 | 3345 | 2 |
| B | 0 | 3462 | 1 |
| C | 0 | 3351 | 1 |
| D | 0 | 3576 | 1 |
| Mode M9 | |||
|---|---|---|---|
| Quadrant | BADHDUFLAG | Total packets | Discarded packets |
| A | 0 | 13 | 0 |
| B | 0 | 13 | 0 |
| C | 0 | 13 | 0 |
| D | 0 | 13 | 0 |
| Quadrant | Total seconds | Saturated seconds | Saturation percentage |
|---|---|---|---|
| A | 1527 | 18 | 1.178782% |
| B | 1527 | 40 | 2.619515% |
| C | 1527 | 34 | 2.226588% |
| D | 1527 | 18 | 1.178782% |
Noise dominated data is calculated using 1-second bins in cleaned event files. If a bin has >2000 counts, and if more than 50% of those come from <1% of pixels, then it is considered to be noise-dominated and hence unusable.
| Quadrant | # 1 sec bins | Bins with >0 counts | Bins with >2000 counts | High rate bins dominated by noise | Noise dominated (total time) | Noise dominated (detector-on time) | Marked lightcurve |
|---|---|---|---|---|---|---|---|
| A | 2833 | 1529 | 0 | 0 | 0.00% | 0.00% | 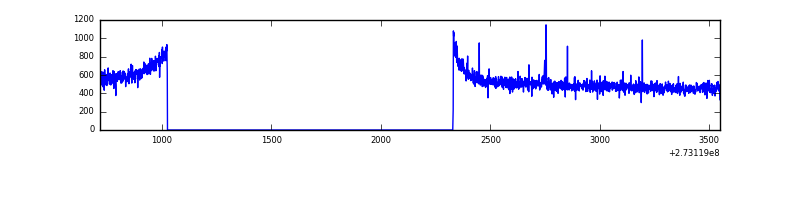 |
| B | 2833 | 1529 | 0 | 0 | 0.00% | 0.00% | 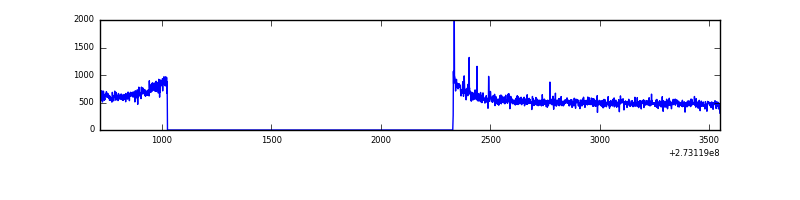 |
| C | 2833 | 1529 | 0 | 0 | 0.00% | 0.00% | 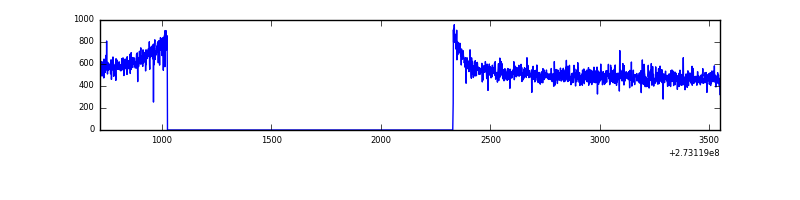 |
| D | 2833 | 1529 | 1 | 1 | 0.04% | 0.07% | 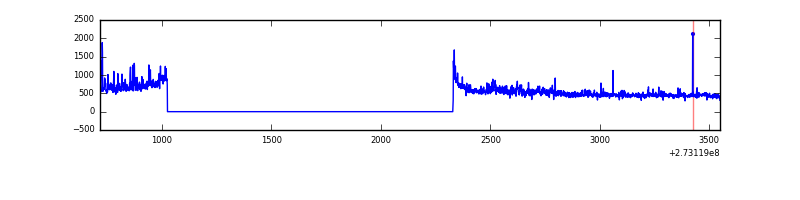 |
Top three noisy pixels from each quadrant. If the there are fewer than three noisy pixels in the level2.evt file, extra rows are filled as -1
| Pixel properties | Quadrant properties | ||||||
|---|---|---|---|---|---|---|---|
| Quadrant | DetID | PixID | Counts | Sigma | Mean | Median | Sigma |
| A | 4 | 2 | 3572 | 76.77 | 208 | 203 | 43.9 |
| A | 0 | 226 | 1886 | 38.35 | 208 | 203 | 43.9 |
| A | 12 | 194 | 1478 | 29.05 | 208 | 203 | 43.9 |
| B | 0 | 189 | 7781 | 180.71 | 210 | 205 | 41.9 |
| B | 0 | 230 | 6739 | 155.85 | 210 | 205 | 41.9 |
| B | 12 | 111 | 4613 | 105.14 | 210 | 205 | 41.9 |
| C | 14 | 238 | 31034 | 644.88 | 198 | 200 | 47.8 |
| C | 7 | 247 | 2820 | 54.8 | 198 | 200 | 47.8 |
| C | 3 | 233 | 1924 | 36.06 | 198 | 200 | 47.8 |
| D | 1 | 52 | 91099 | 1742.31 | 198 | 193 | 52.2 |
| D | 5 | 51 | 6599 | 122.78 | 198 | 193 | 52.2 |
| D | 2 | 234 | 5215 | 96.25 | 198 | 193 | 52.2 |
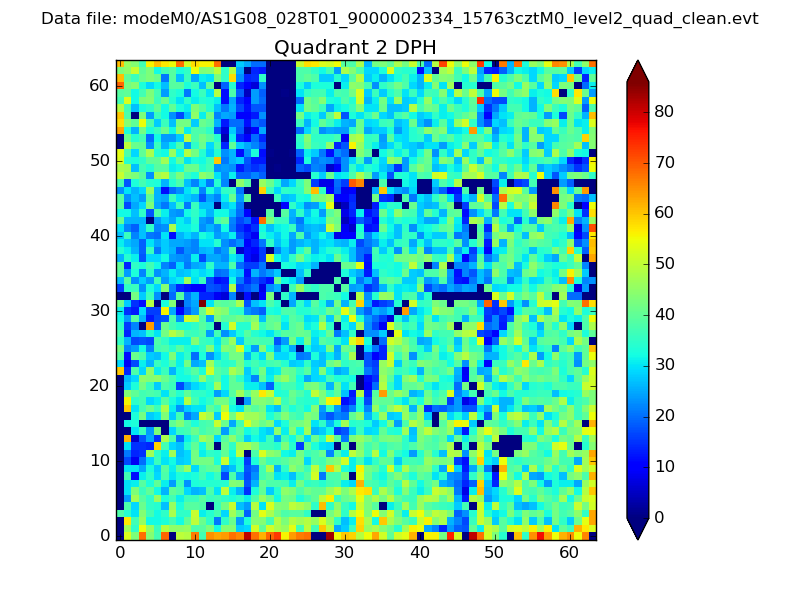
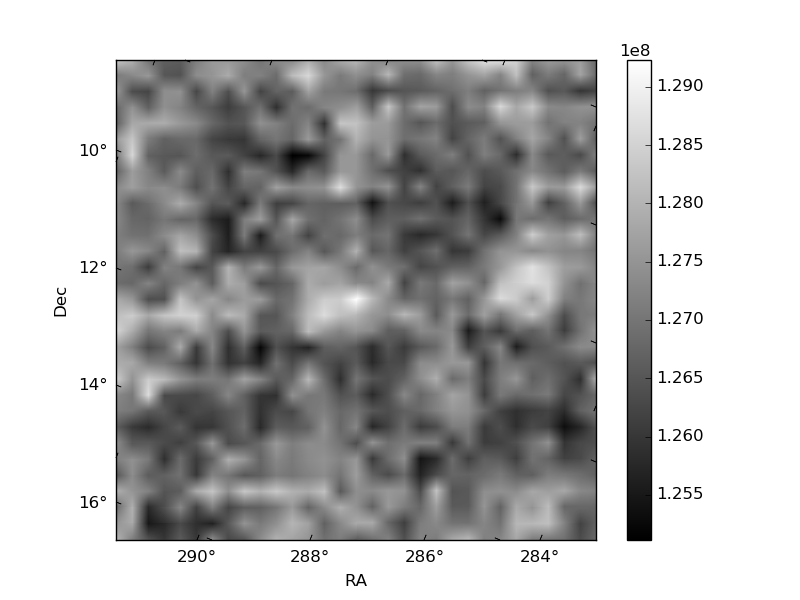
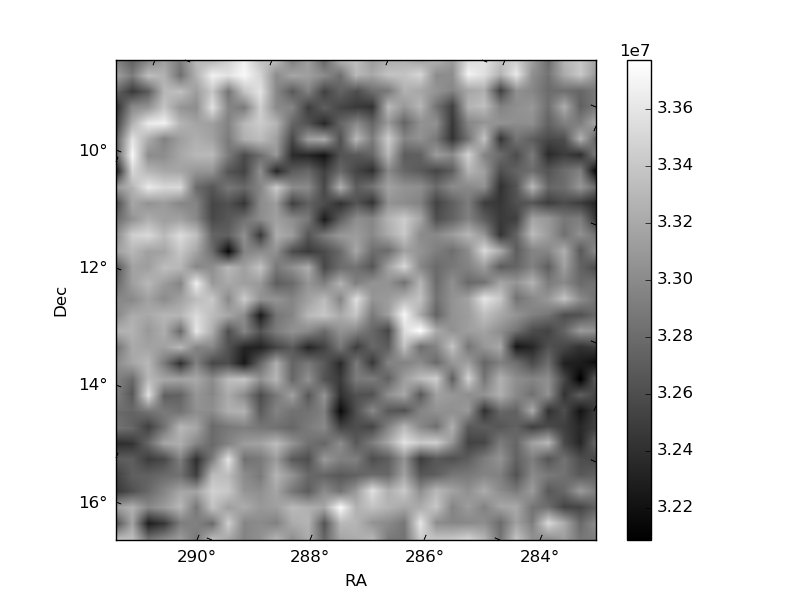
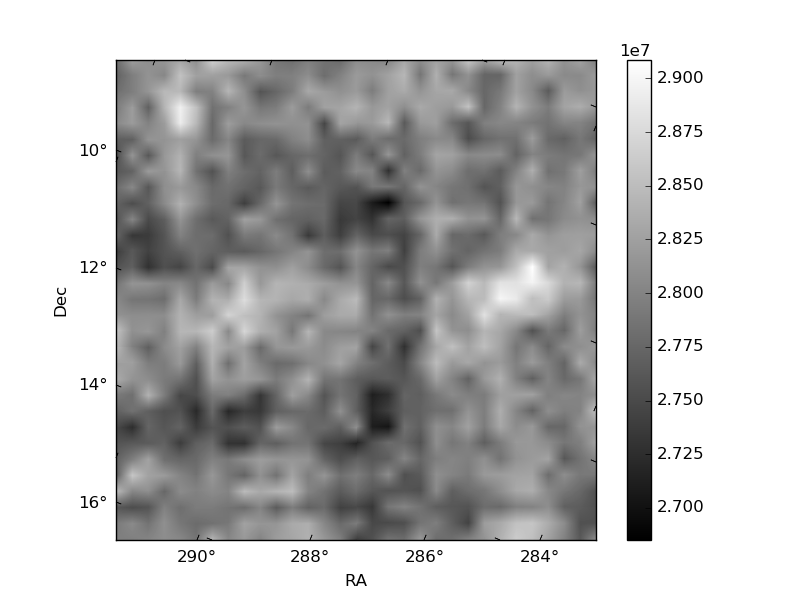
Histogram calculated using DETX and DETY for each event in the final _common_clean file
| Quadrant A | 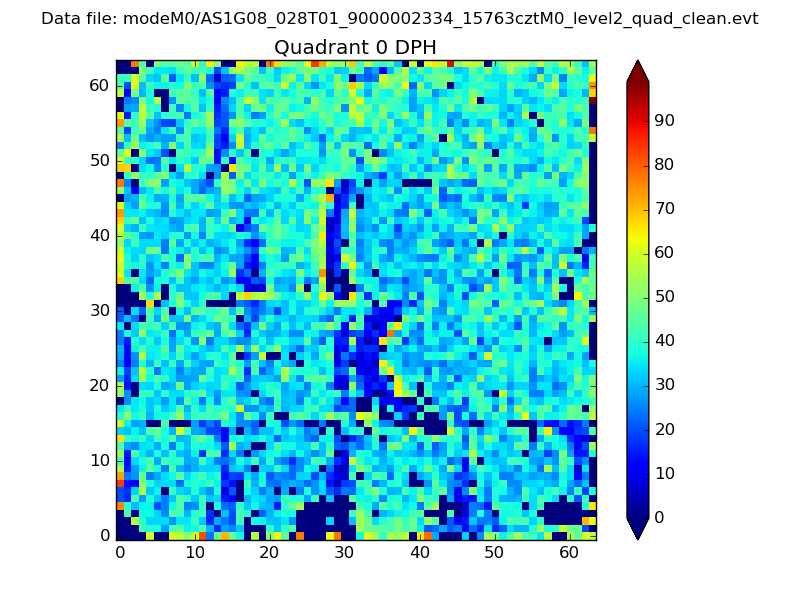 |
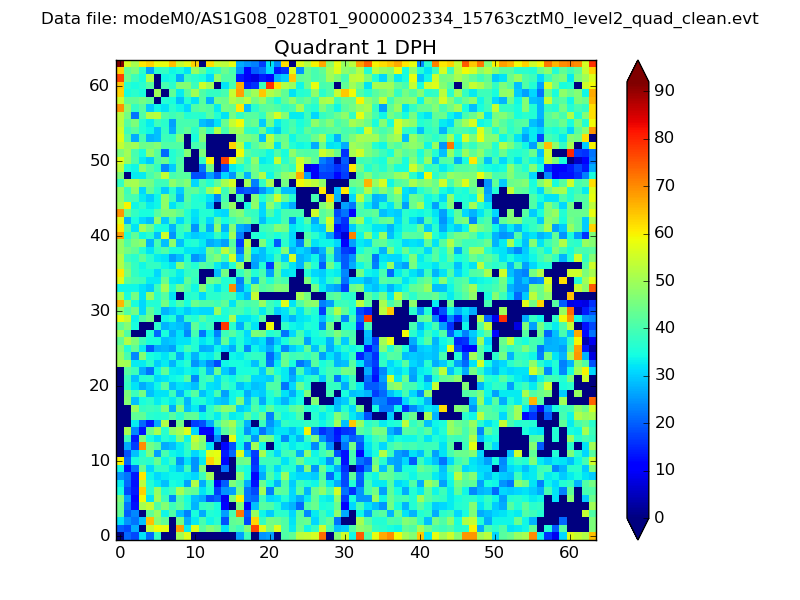 |
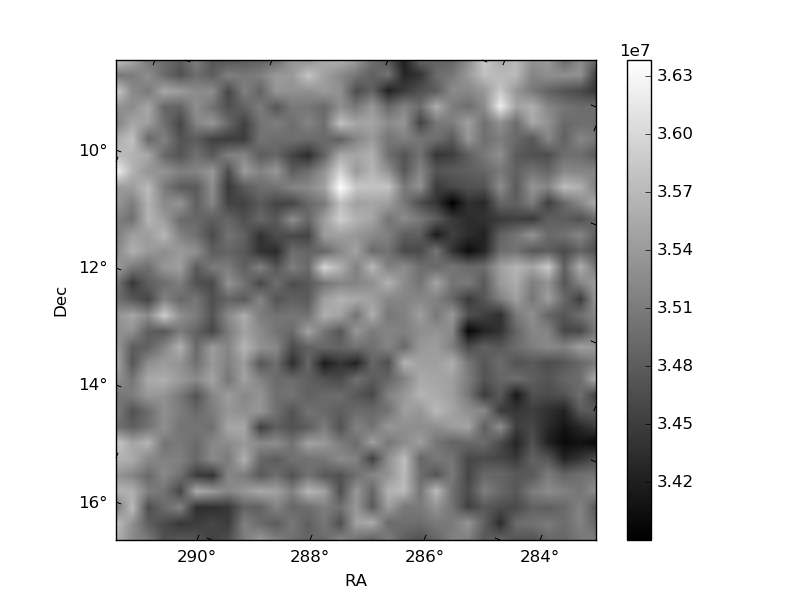
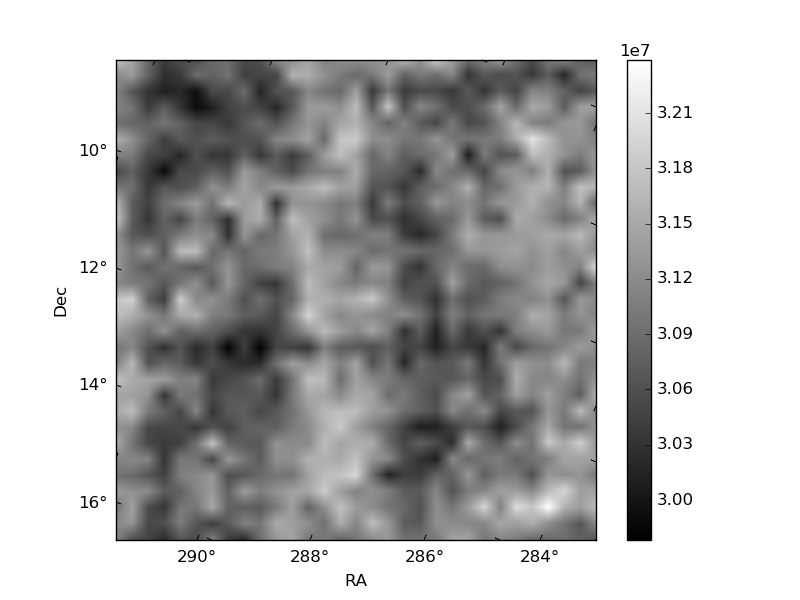
Quadrant B |
|---|---|---|---|
| Quadrant D | 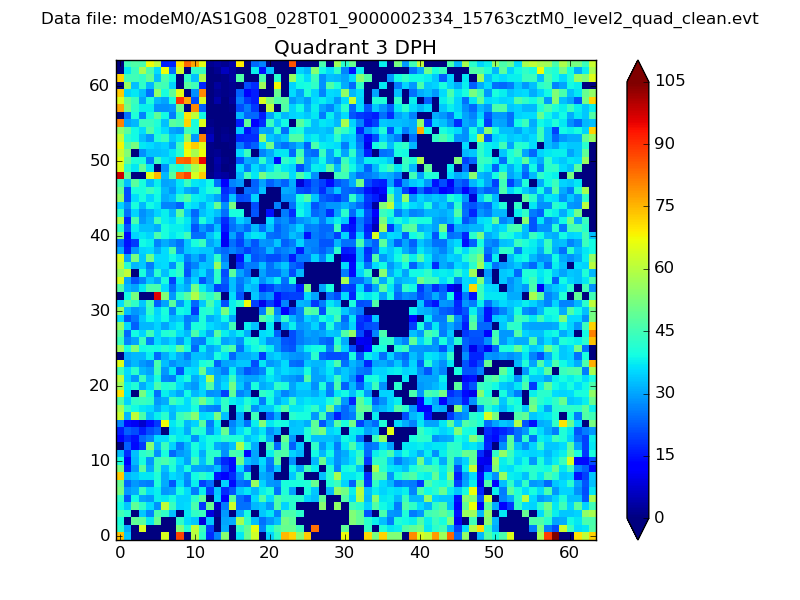 |
 |
Quadrant C |
| Plot type | Count rate plots | Images |
|---|---|---|
| Comparison with Poisson distribution Blue bars denote a histogram of data divided into 1 sec bins. Red curve is a Poisson curve with rate = median count rate of data. |
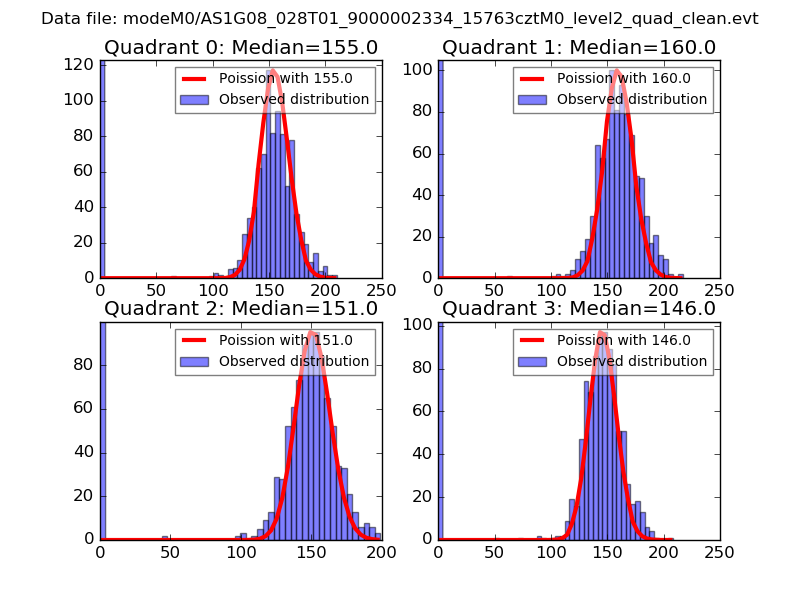 |
 |
| Quadrant-wise count rates Data is divided into 100 sec bins |
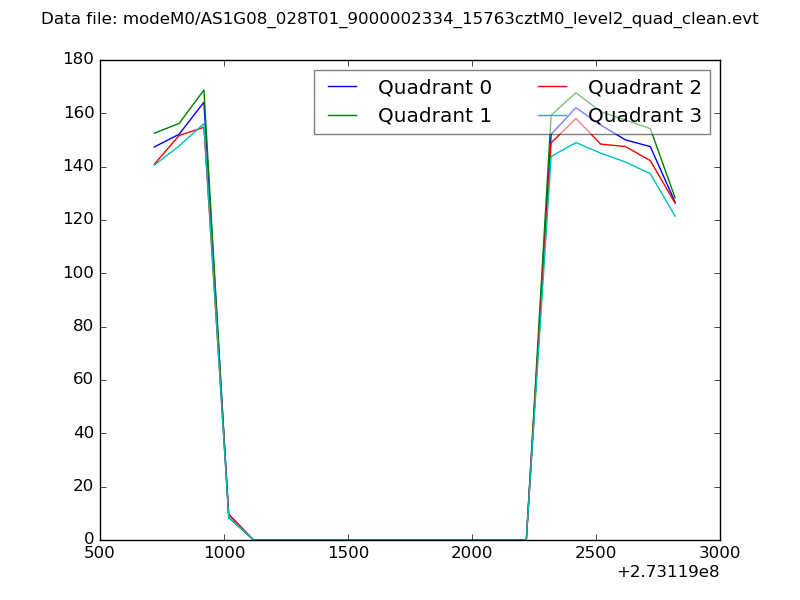 |
|
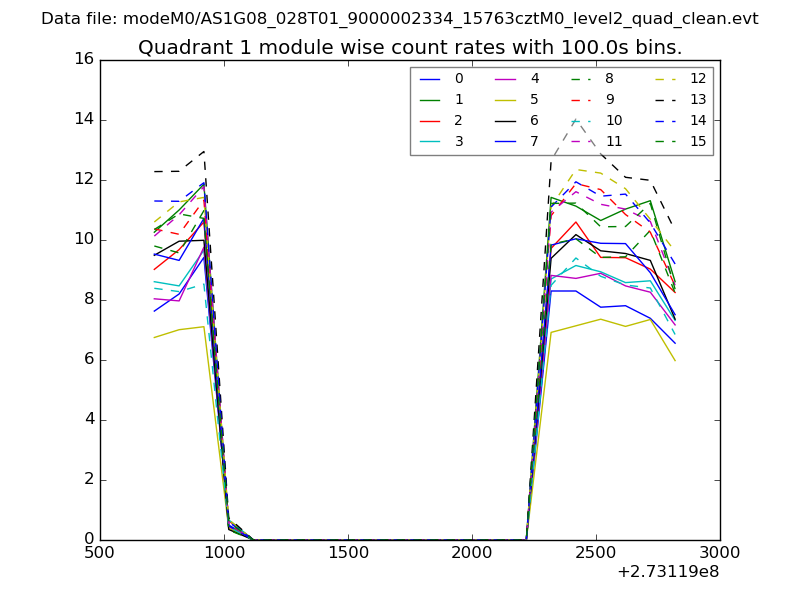
| Module-wise count rates for Quadrant A Data is divided into 100 sec bins |
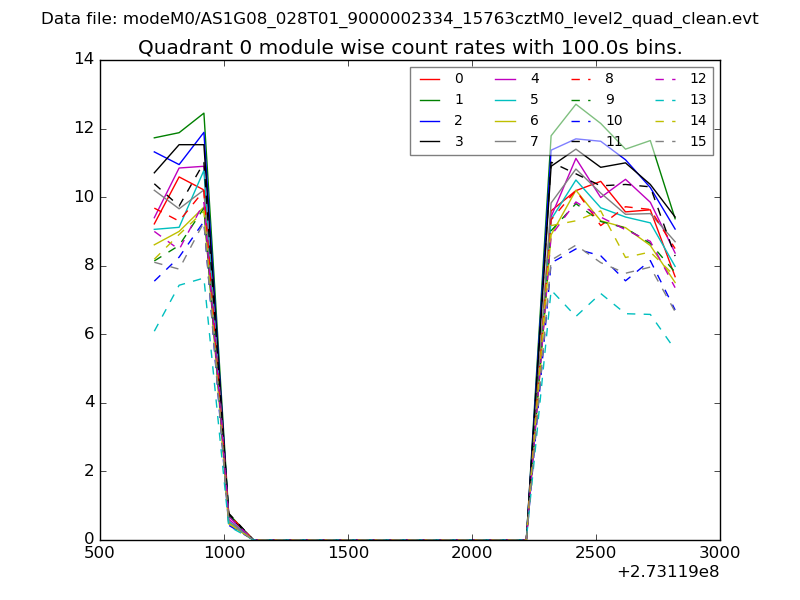 |
 |
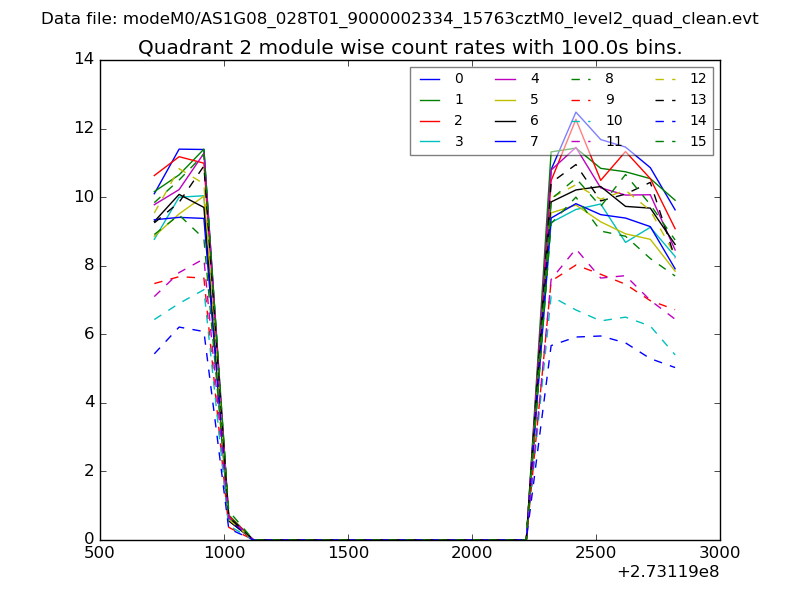
| Module-wise count rates for Quadrant B Data is divided into 100 sec bins |
 |
 |
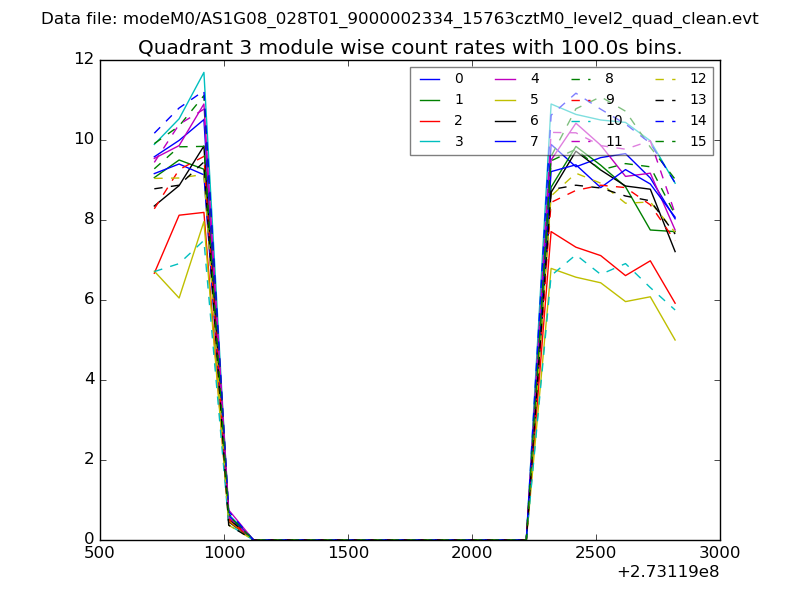
| Module-wise count rates for Quadrant C Data is divided into 100 sec bins |
 |
 |
| Module-wise count rates for Quadrant D Data is divided into 100 sec bins |
 |
 |
| Parameter | Plot |
|---|---|
| CZT HV Monitor | 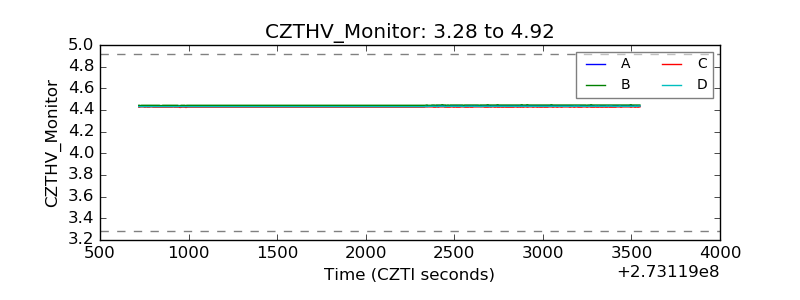 |
| D_VDD | 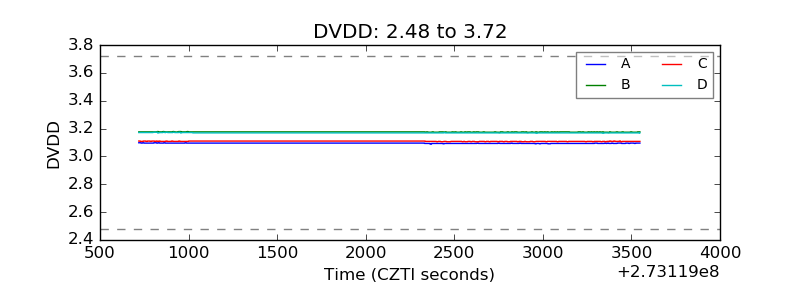 |
| Temperature 1 | 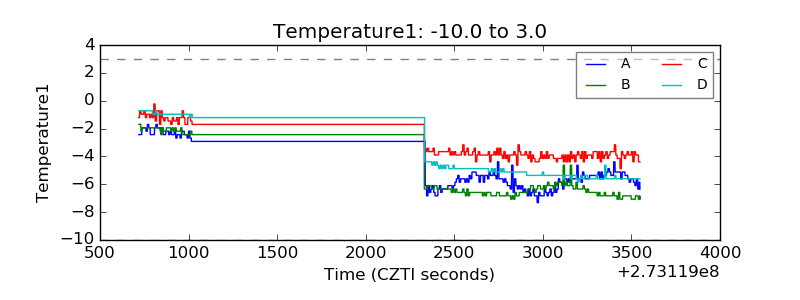 |
| Veto HV Monitor | 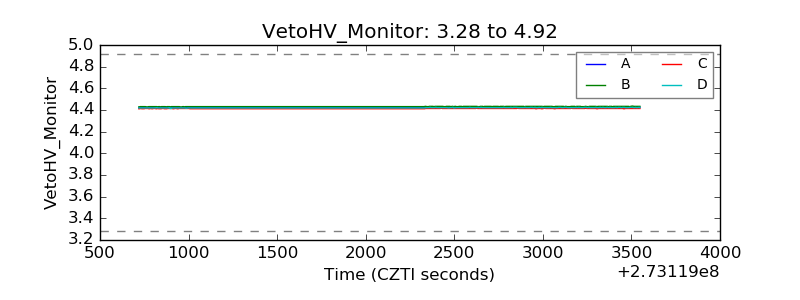 |
| Veto LLD | 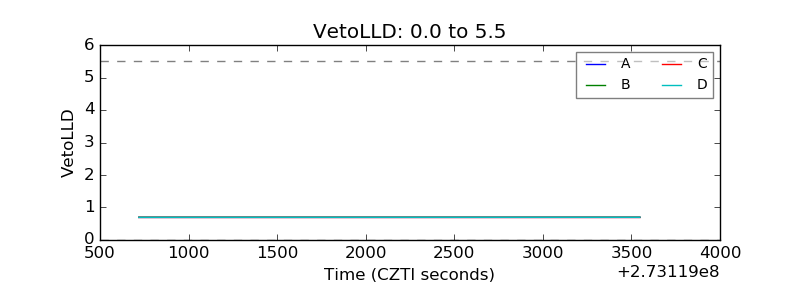 |
| Alpha Counter | 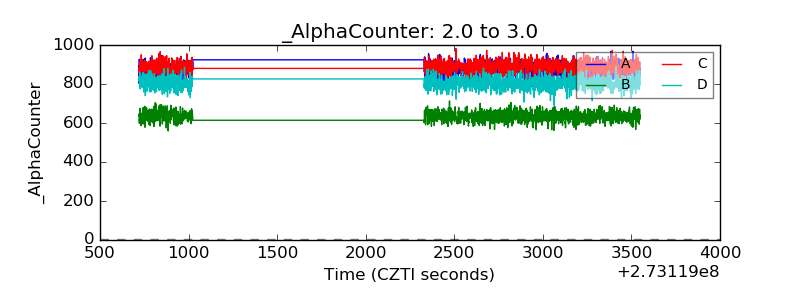 |
| _CPM_Rate | 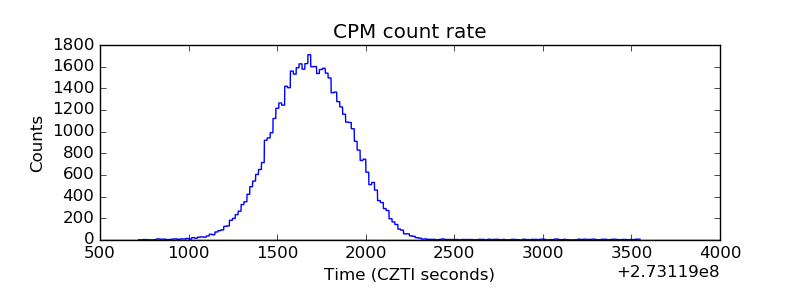 |
| CZT Counter |  |
| +2.5 Volts monitor |  |
| +5 Volts monitor |  |
| _ROLL_ROT | 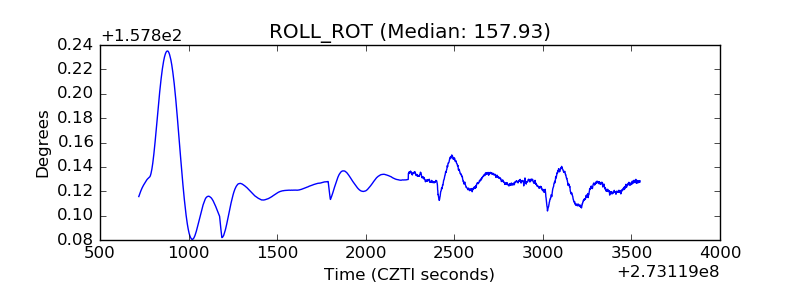 |
| _Roll_DEC | 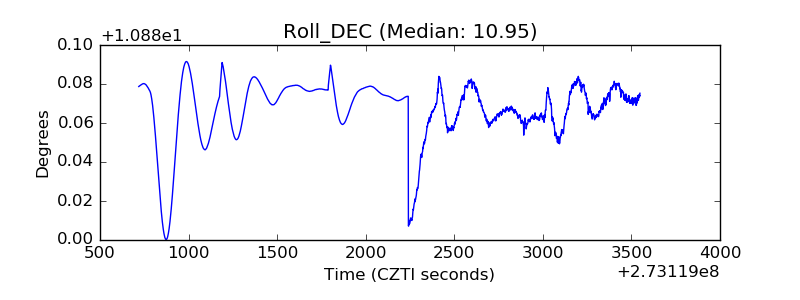 |
| _Roll_RA | 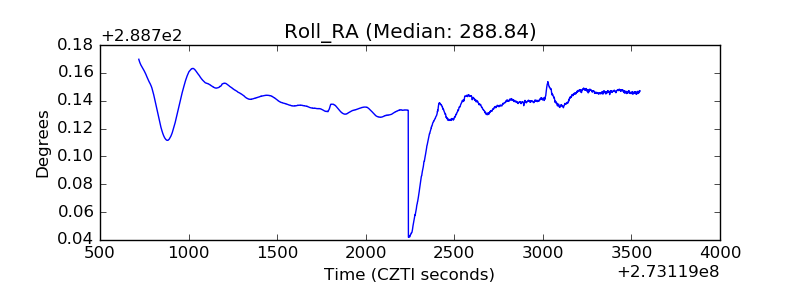 |
| Veto Counter | 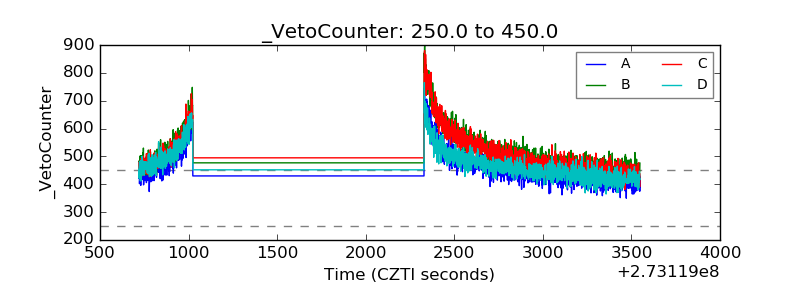 |