| Param | Original file | Final file |
|---|---|---|
| Filename | modeM0/AS1T02_100T01_9000002354_15975cztM0_level2.evt | modeM0/AS1T02_100T01_9000002354_15975cztM0_level2_quad_clean.evt |
| Size (bytes) | 277,223,040 | 56,361,600 |
| Size | 264.4 MB | 53.8 MB |
| Events in quadrant A | 1,994,179 | 359,289 |
| Events in quadrant B | 2,134,940 | 361,058 |
| Events in quadrant C | 1,986,920 | 349,361 |
| Events in quadrant D | 1,997,792 | 345,793 |
| Mode M0 | |||
|---|---|---|---|
| Quadrant | BADHDUFLAG | Total packets | Discarded packets |
| A | 0 | 8661 | 2 |
| B | 0 | 8997 | 1 |
| C | 0 | 8656 | 1 |
| D | 0 | 8715 | 1 |
| Mode SS | |||
|---|---|---|---|
| Quadrant | BADHDUFLAG | Total packets | Discarded packets |
| A | 0 | 84 | 0 |
| B | 0 | 84 | 0 |
| C | 0 | 84 | 0 |
| D | 0 | 84 | 0 |
| Mode M9 | |||
|---|---|---|---|
| Quadrant | BADHDUFLAG | Total packets | Discarded packets |
| A | 0 | 10 | 0 |
| B | 0 | 10 | 0 |
| C | 0 | 10 | 0 |
| D | 0 | 10 | 0 |
| Quadrant | Total seconds | Saturated seconds | Saturation percentage |
|---|---|---|---|
| A | 4129 | 43 | 1.041414% |
| B | 4129 | 52 | 1.259385% |
| C | 4129 | 58 | 1.404698% |
| D | 4129 | 39 | 0.944539% |
Noise dominated data is calculated using 1-second bins in cleaned event files. If a bin has >2000 counts, and if more than 50% of those come from <1% of pixels, then it is considered to be noise-dominated and hence unusable.
| Quadrant | # 1 sec bins | Bins with >0 counts | Bins with >2000 counts | High rate bins dominated by noise | Noise dominated (total time) | Noise dominated (detector-on time) | Marked lightcurve |
|---|---|---|---|---|---|---|---|
| A | 5155 | 4130 | 0 | 0 | 0.00% | 0.00% | 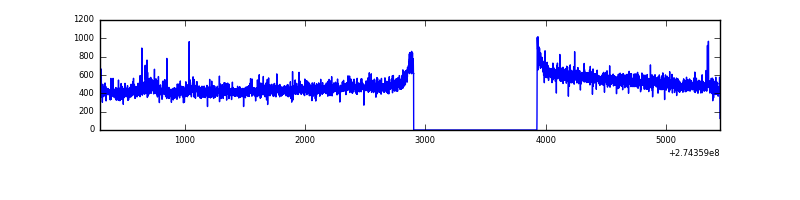 |
| B | 5155 | 4130 | 4 | 4 | 0.08% | 0.10% | 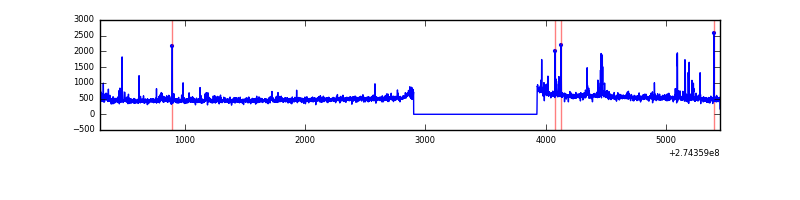 |
| C | 5155 | 4131 | 0 | 0 | 0.00% | 0.00% | 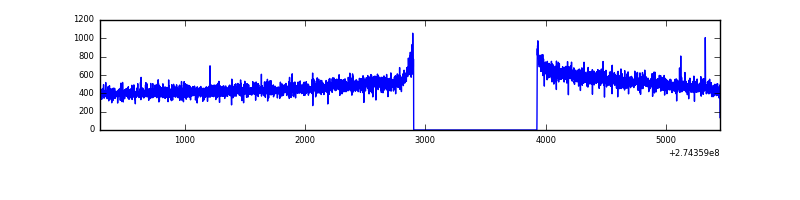 |
| D | 5155 | 4130 | 3 | 3 | 0.06% | 0.07% | 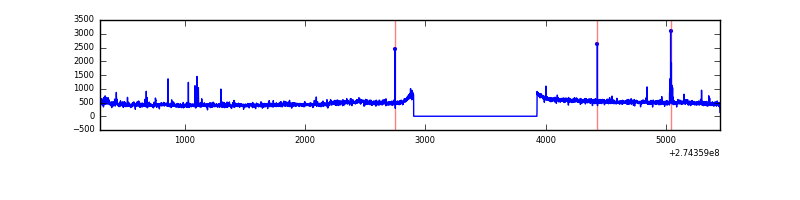 |
Top three noisy pixels from each quadrant. If the there are fewer than three noisy pixels in the level2.evt file, extra rows are filled as -1
| Pixel properties | Quadrant properties | ||||||
|---|---|---|---|---|---|---|---|
| Quadrant | DetID | PixID | Counts | Sigma | Mean | Median | Sigma |
| A | 15 | 239 | 21657 | 202.57 | 511 | 499 | 104.4 |
| A | 9 | 143 | 7337 | 65.47 | 511 | 499 | 104.4 |
| A | 0 | 226 | 4550 | 38.78 | 511 | 499 | 104.4 |
| B | 4 | 173 | 34550 | 345.38 | 509 | 496 | 98.6 |
| B | 4 | 142 | 28606 | 285.09 | 509 | 496 | 98.6 |
| B | 15 | 222 | 14612 | 143.17 | 509 | 496 | 98.6 |
| C | 14 | 238 | 76075 | 660.61 | 486 | 487 | 114.4 |
| C | 3 | 233 | 8842 | 73.02 | 486 | 487 | 114.4 |
| C | 10 | 69 | 4383 | 34.05 | 486 | 487 | 114.4 |
| D | 12 | 110 | 61367 | 500.21 | 495 | 480 | 121.7 |
| D | 10 | 70 | 24103 | 194.07 | 495 | 480 | 121.7 |
| D | 2 | 234 | 17502 | 139.84 | 495 | 480 | 121.7 |
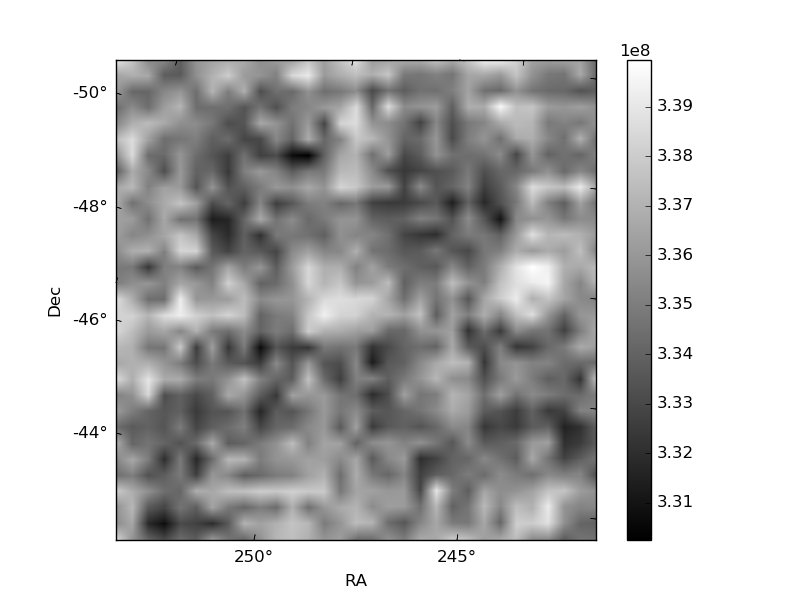
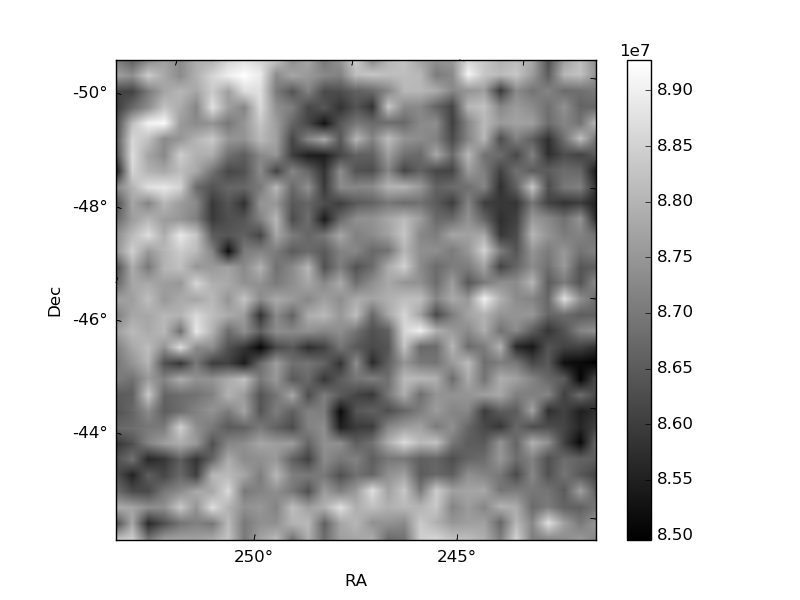
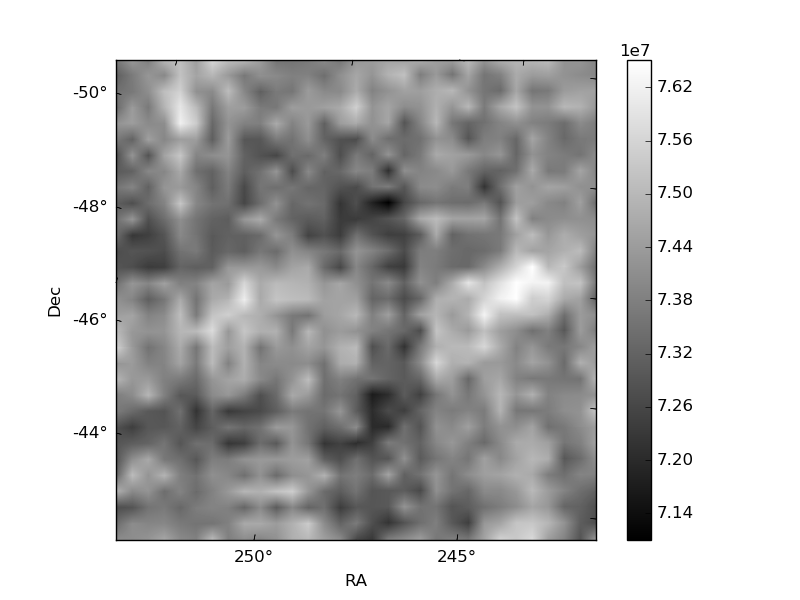
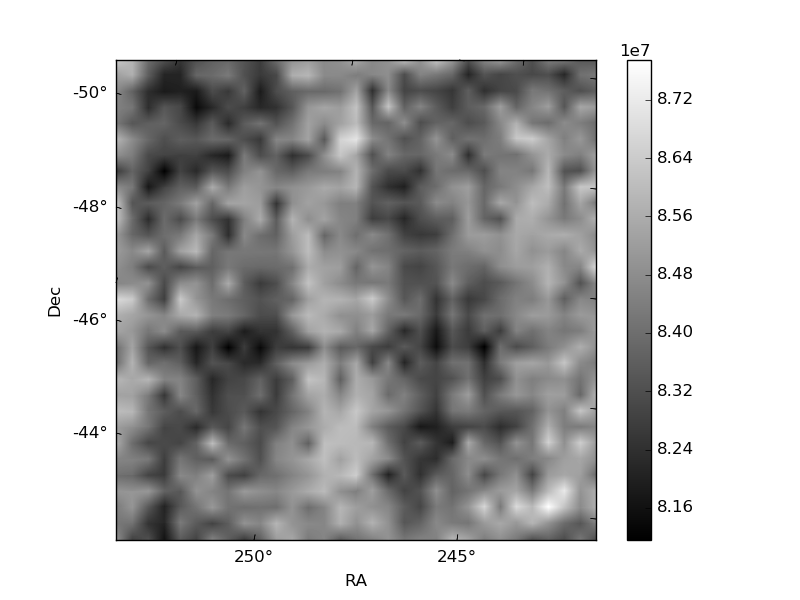
Histogram calculated using DETX and DETY for each event in the final _common_clean file
| Quadrant A | 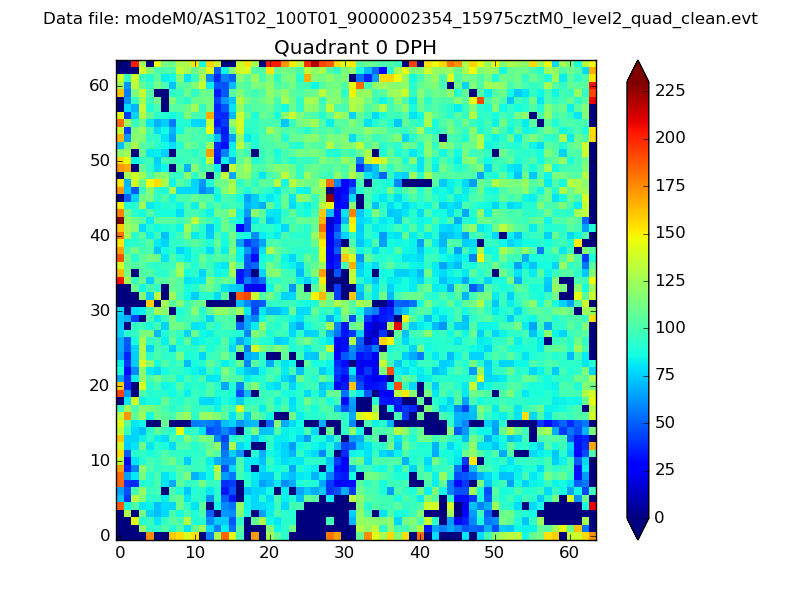 |
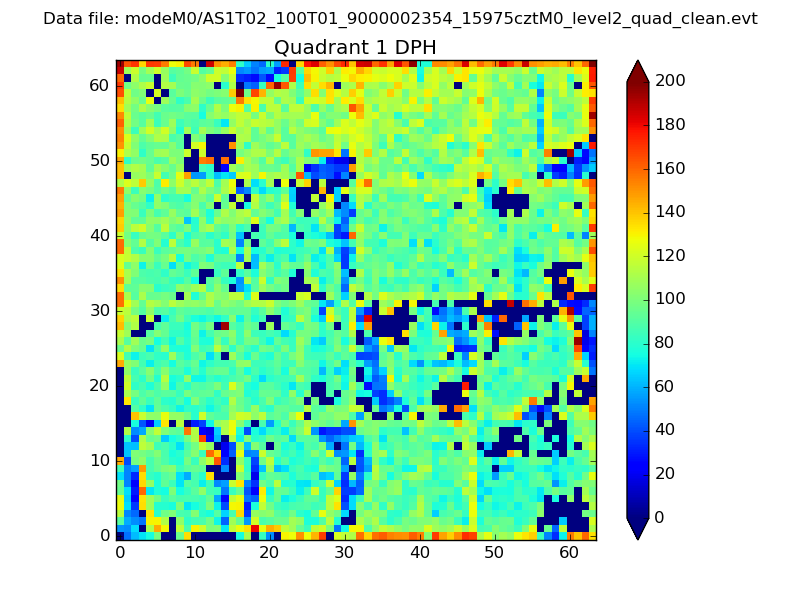 |
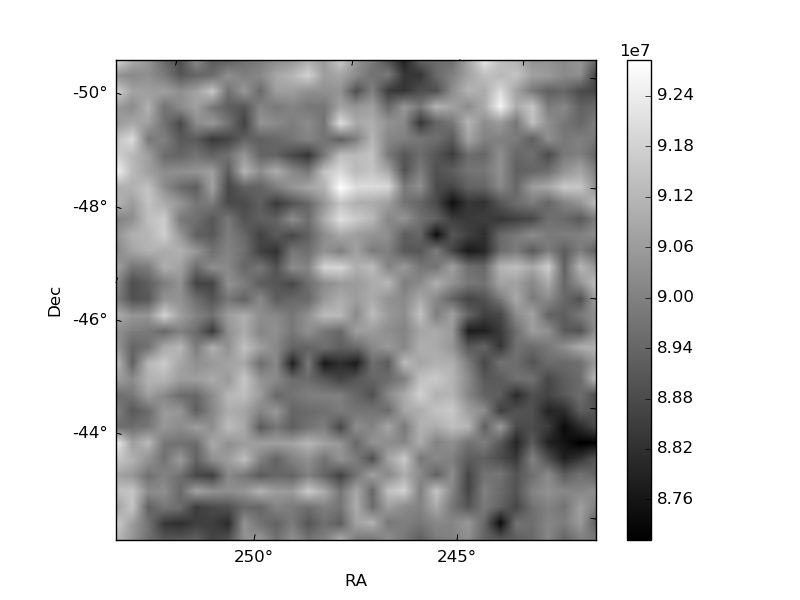
Quadrant B |
|---|---|---|---|
| Quadrant D | 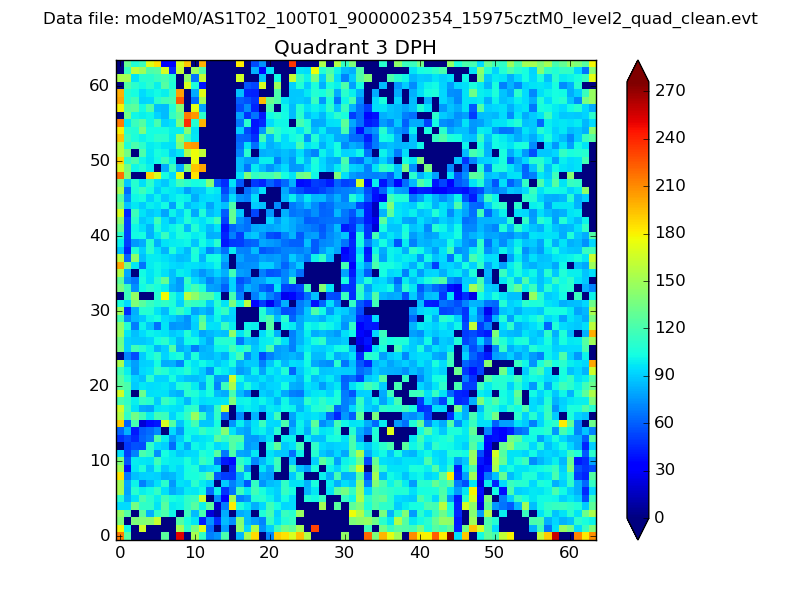 |
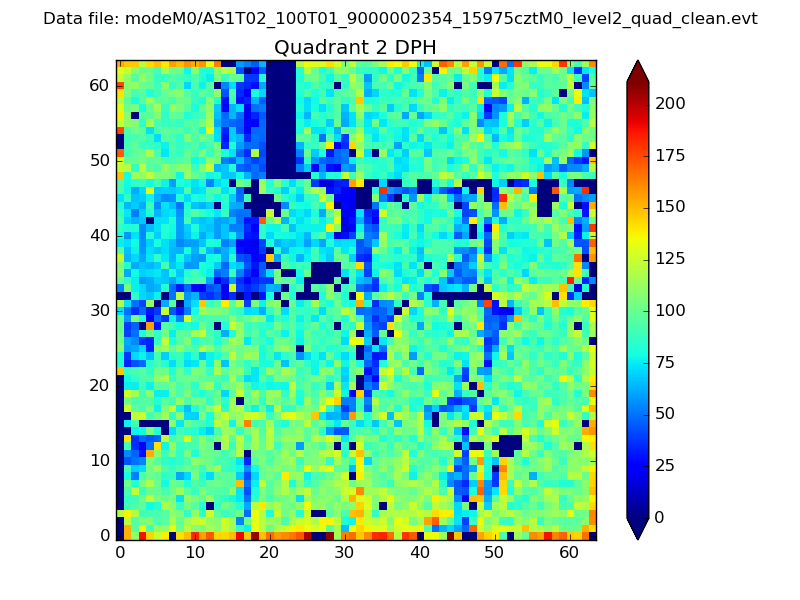 |
Quadrant C |
| Plot type | Count rate plots | Images |
|---|---|---|
| Comparison with Poisson distribution Blue bars denote a histogram of data divided into 1 sec bins. Red curve is a Poisson curve with rate = median count rate of data. |
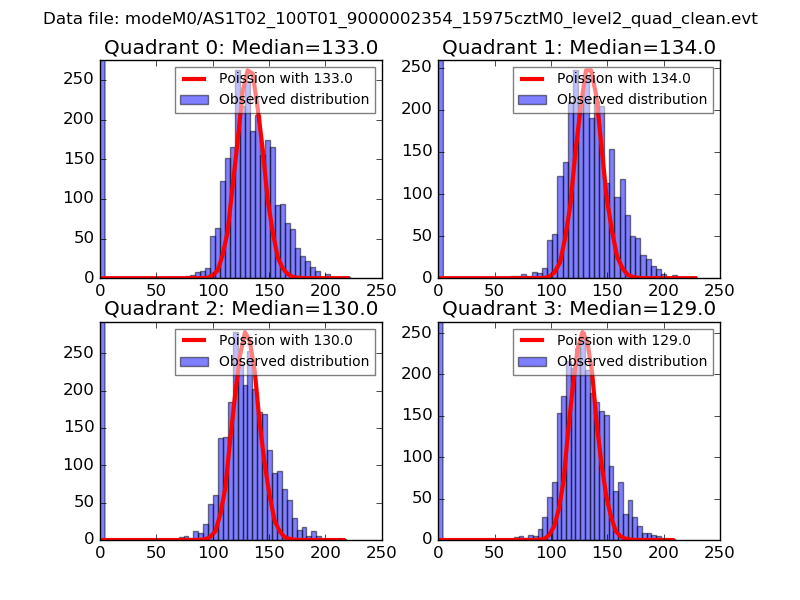 |
 |
| Quadrant-wise count rates Data is divided into 100 sec bins |
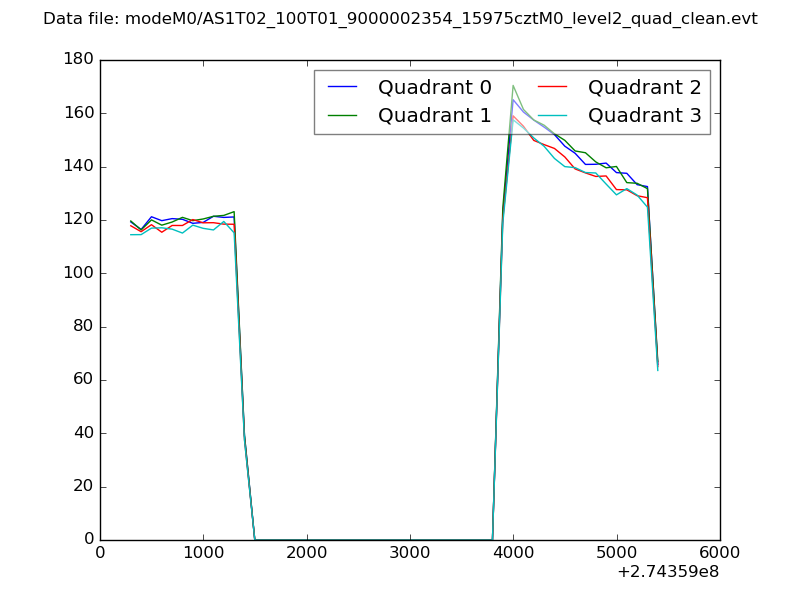 |
|
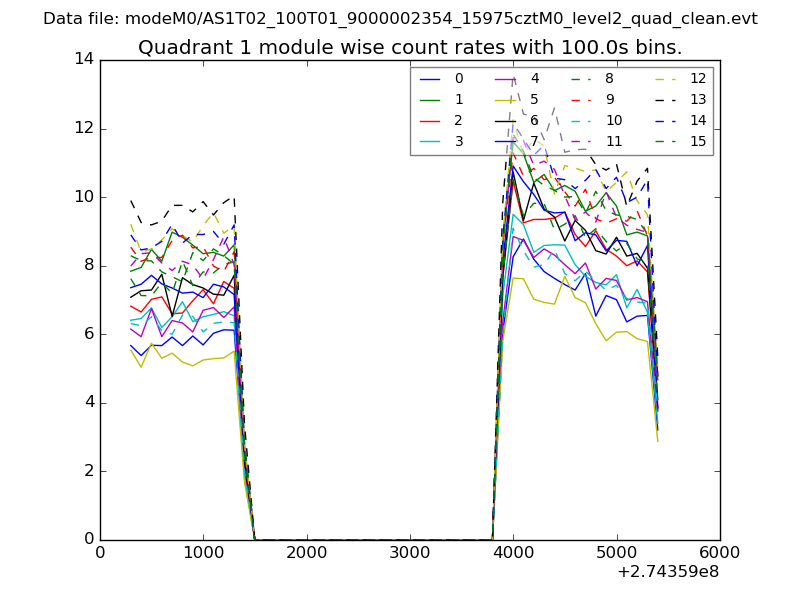
| Module-wise count rates for Quadrant A Data is divided into 100 sec bins |
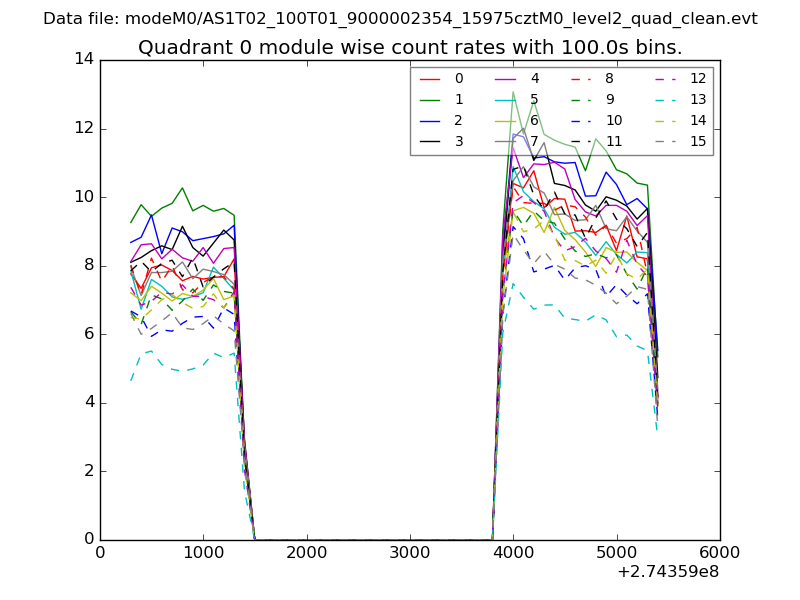 |
 |
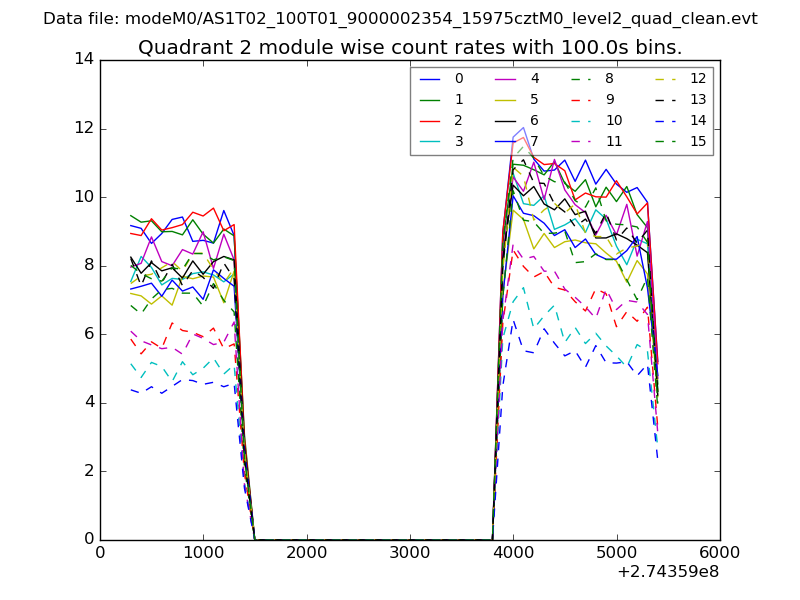
| Module-wise count rates for Quadrant B Data is divided into 100 sec bins |
 |
 |
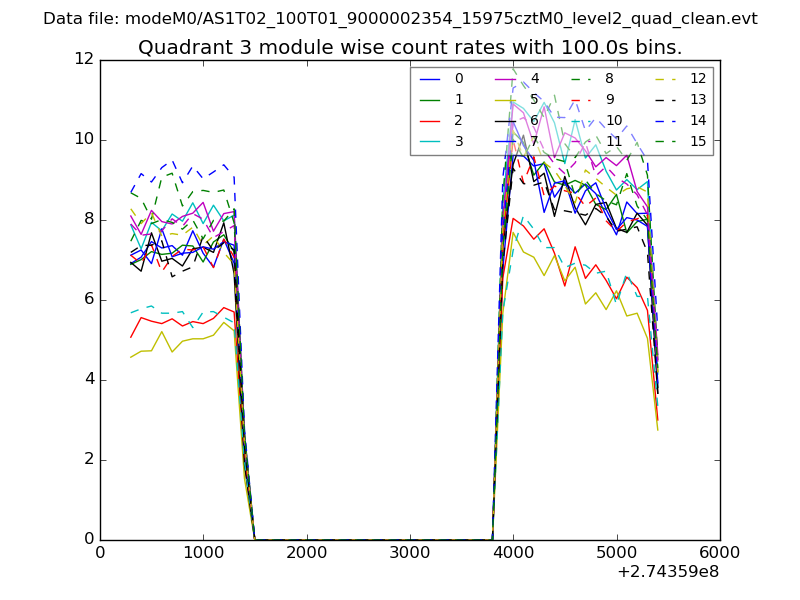
| Module-wise count rates for Quadrant C Data is divided into 100 sec bins |
 |
 |
| Module-wise count rates for Quadrant D Data is divided into 100 sec bins |
 |
 |
| Parameter | Plot |
|---|---|
| CZT HV Monitor | 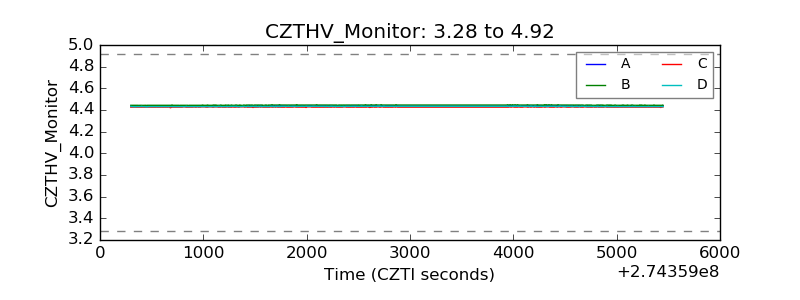 |
| D_VDD | 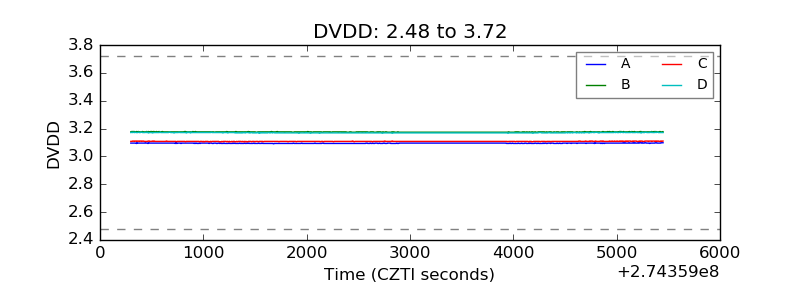 |
| Temperature 1 | 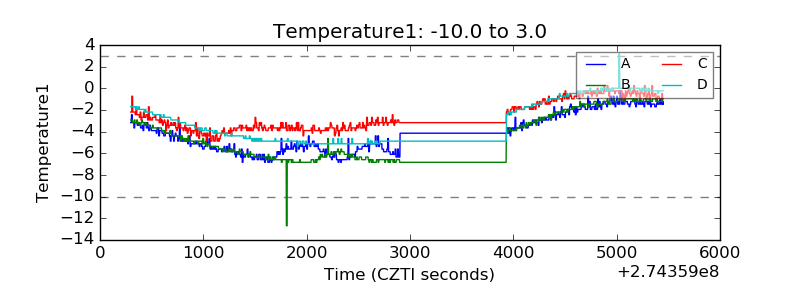 |
| Veto HV Monitor | 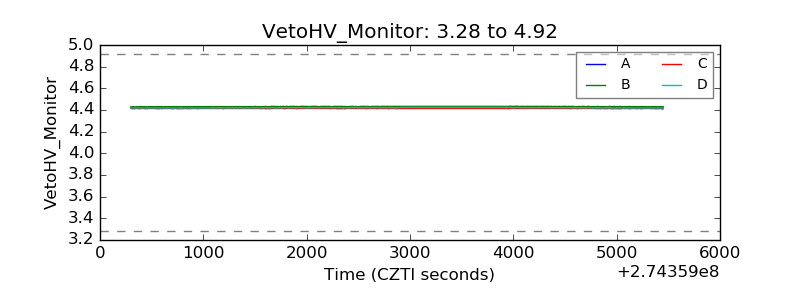 |
| Veto LLD | 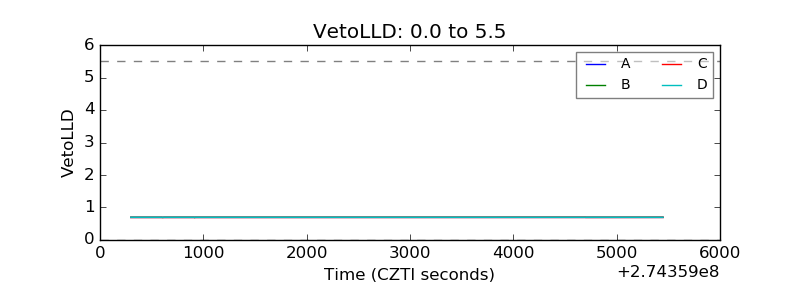 |
| Alpha Counter | 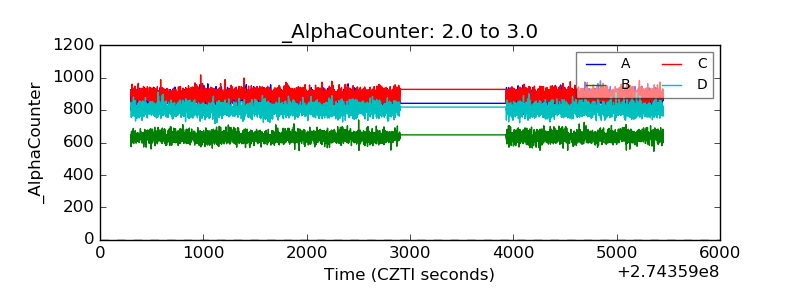 |
| _CPM_Rate | 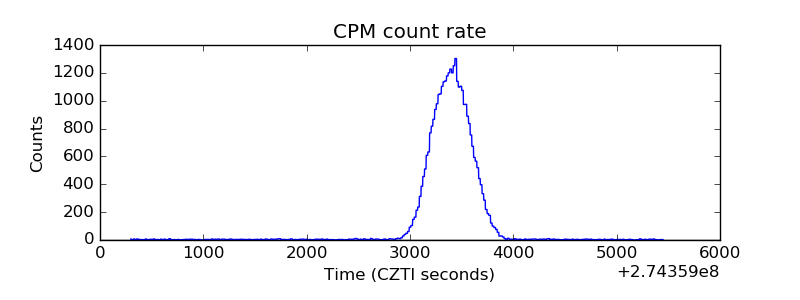 |
| CZT Counter | 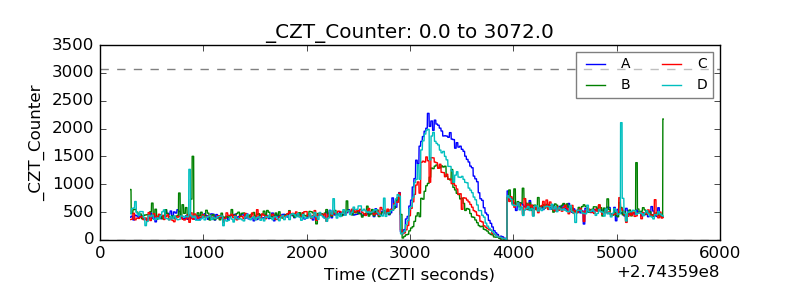 |
| +2.5 Volts monitor |  |
| +5 Volts monitor | 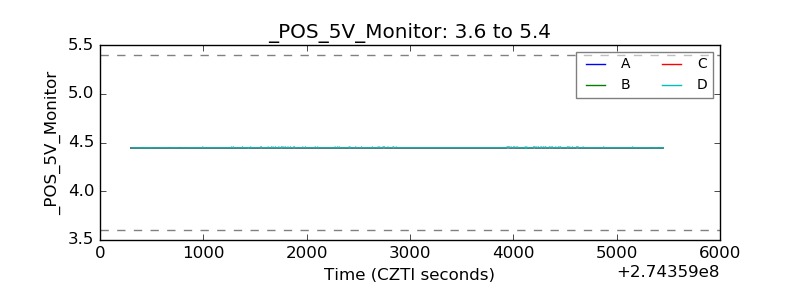 |
| _ROLL_ROT | 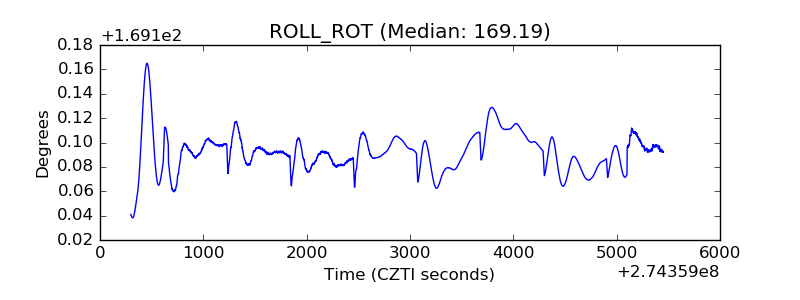 |
| _Roll_DEC | 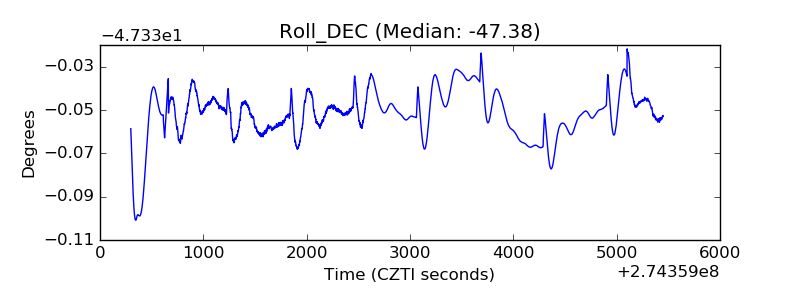 |
| _Roll_RA | 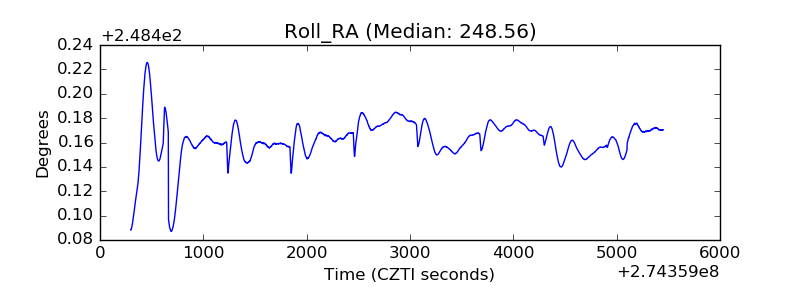 |
| Veto Counter | 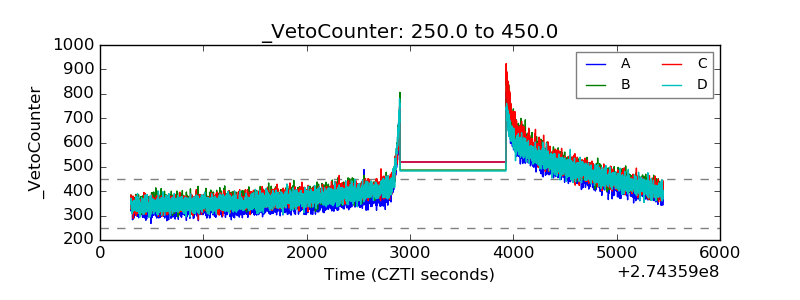 |