| Param | Original file | Final file |
|---|---|---|
| Filename | modeM0/AS1T02_109T01_9000002386_16191cztM0_level2.evt | modeM0/AS1T02_109T01_9000002386_16191cztM0_level2_quad_clean.evt |
| Size (bytes) | 171,927,360 | 22,176,000 |
| Size | 164.0 MB | 21.1 MB |
| Events in quadrant A | 1,252,259 | 123,400 |
| Events in quadrant B | 1,286,163 | 126,519 |
| Events in quadrant C | 1,264,465 | 115,154 |
| Events in quadrant D | 1,221,787 | 117,271 |
| Mode M0 | |||
|---|---|---|---|
| Quadrant | BADHDUFLAG | Total packets | Discarded packets |
| A | 0 | 14497 | 9126 |
| B | 0 | 14640 | 9178 |
| C | 0 | 14703 | 9344 |
| D | 0 | 14690 | 9255 |
| Mode SS | |||
|---|---|---|---|
| Quadrant | BADHDUFLAG | Total packets | Discarded packets |
| A | 0 | 144 | 96 |
| B | 0 | 145 | 97 |
| C | 0 | 143 | 89 |
| D | 0 | 145 | 97 |
| Mode M9 | |||
|---|---|---|---|
| Quadrant | BADHDUFLAG | Total packets | Discarded packets |
| A | 0 | 6 | 1 |
| B | 0 | 8 | 3 |
| C | 0 | 7 | 3 |
| D | 0 | 7 | 1 |
| Quadrant | Total seconds | Saturated seconds | Saturation percentage |
|---|---|---|---|
| A | 2636 | 9 | 0.341426% |
| B | 2633 | 11 | 0.417774% |
| C | 2618 | 24 | 0.916730% |
| D | 2645 | 10 | 0.378072% |
Noise dominated data is calculated using 1-second bins in cleaned event files. If a bin has >2000 counts, and if more than 50% of those come from <1% of pixels, then it is considered to be noise-dominated and hence unusable.
| Quadrant | # 1 sec bins | Bins with >0 counts | Bins with >2000 counts | High rate bins dominated by noise | Noise dominated (total time) | Noise dominated (detector-on time) | Marked lightcurve |
|---|---|---|---|---|---|---|---|
| A | 6581 | 3460 | 0 | 0 | 0.00% | 0.00% | 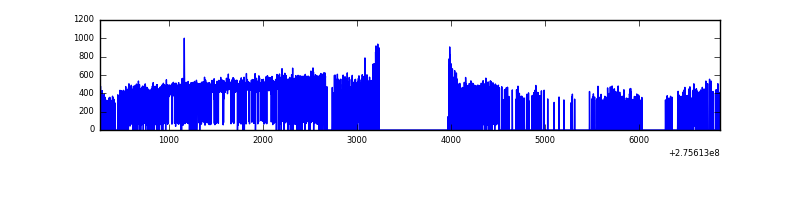 |
| B | 6586 | 3454 | 0 | 0 | 0.00% | 0.00% | 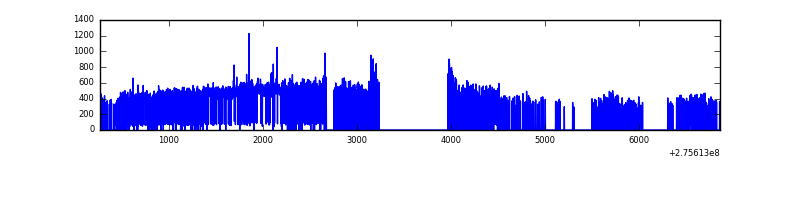 |
| C | 6534 | 3452 | 0 | 0 | 0.00% | 0.00% | 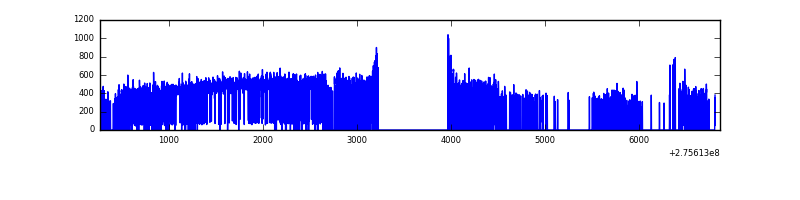 |
| D | 6580 | 3477 | 2 | 2 | 0.03% | 0.06% | 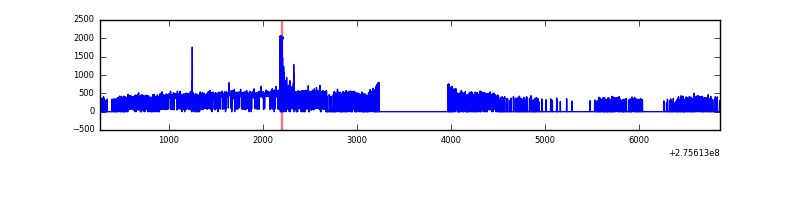 |
Top three noisy pixels from each quadrant. If the there are fewer than three noisy pixels in the level2.evt file, extra rows are filled as -1
| Pixel properties | Quadrant properties | ||||||
|---|---|---|---|---|---|---|---|
| Quadrant | DetID | PixID | Counts | Sigma | Mean | Median | Sigma |
| A | 8 | 247 | 10565 | 154.14 | 321 | 314 | 66.5 |
| A | 15 | 174 | 3466 | 47.4 | 321 | 314 | 66.5 |
| A | 0 | 226 | 2755 | 36.7 | 321 | 314 | 66.5 |
| B | 3 | 209 | 15155 | 235.26 | 318 | 310 | 63.1 |
| B | 4 | 216 | 9060 | 138.67 | 318 | 310 | 63.1 |
| B | 3 | 64 | 8934 | 136.67 | 318 | 310 | 63.1 |
| C | 14 | 238 | 46497 | 631.87 | 303 | 304 | 73.1 |
| C | 7 | 247 | 18316 | 246.39 | 303 | 304 | 73.1 |
| C | 3 | 233 | 11145 | 148.29 | 303 | 304 | 73.1 |
| D | 7 | 38 | 27936 | 355.4 | 312 | 303 | 77.8 |
| D | 2 | 234 | 10640 | 132.95 | 312 | 303 | 77.8 |
| D | 5 | 222 | 5543 | 67.39 | 312 | 303 | 77.8 |
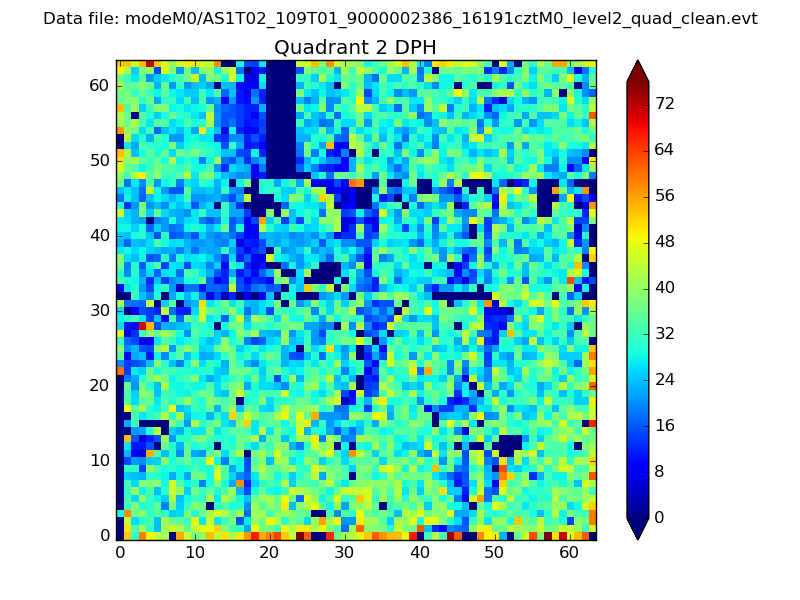
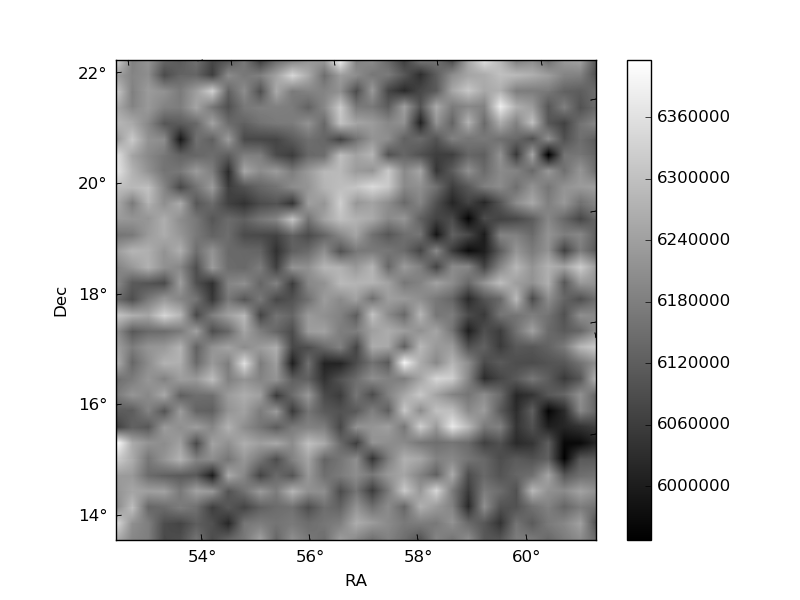
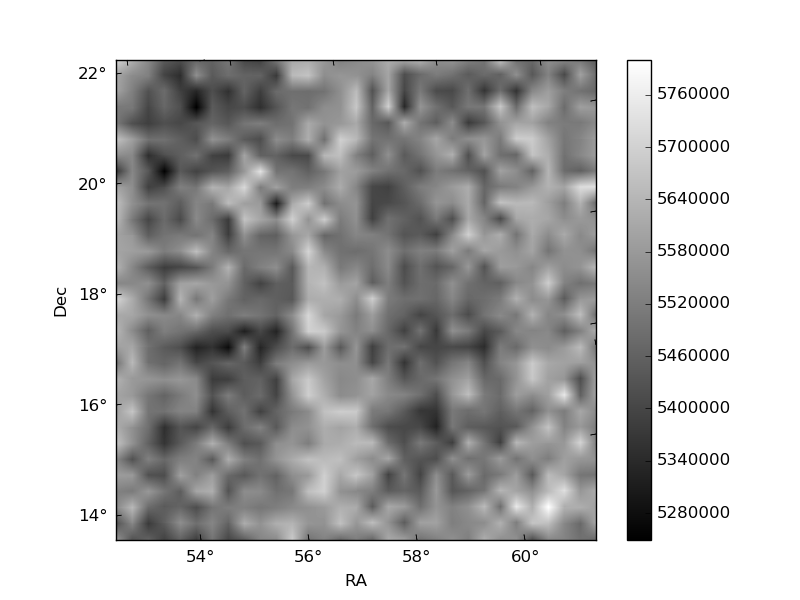
Histogram calculated using DETX and DETY for each event in the final _common_clean file
| Quadrant A |  |
 |
Quadrant B |
|---|---|---|---|
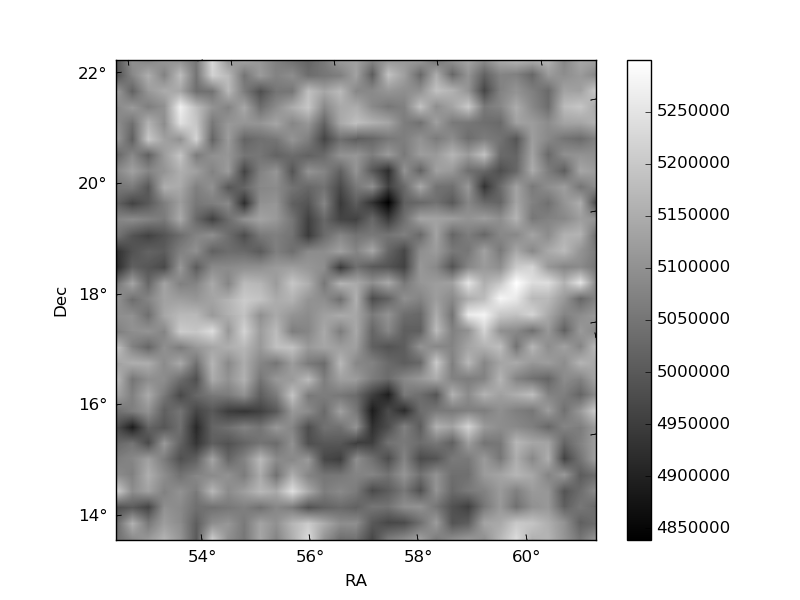
| Quadrant D | 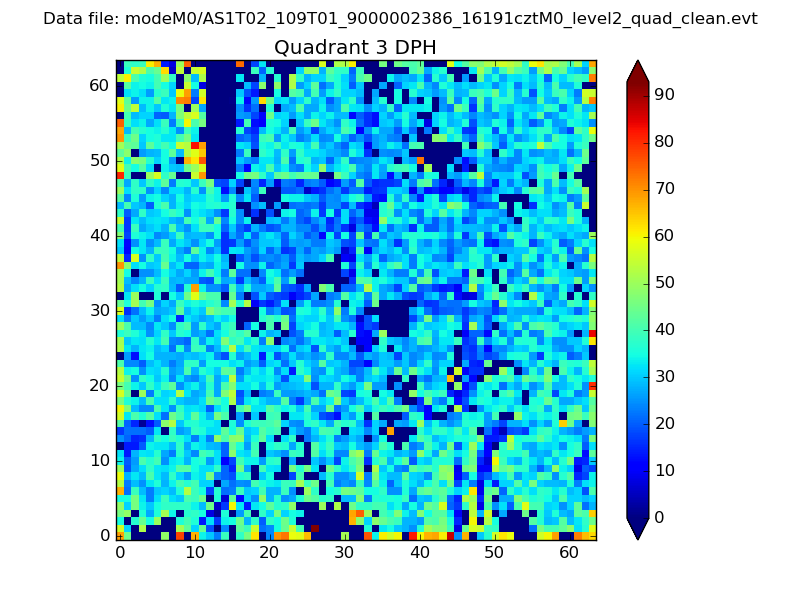 |
 |
Quadrant C |
| Plot type | Count rate plots | Images |
|---|---|---|
| Comparison with Poisson distribution Blue bars denote a histogram of data divided into 1 sec bins. Red curve is a Poisson curve with rate = median count rate of data. |
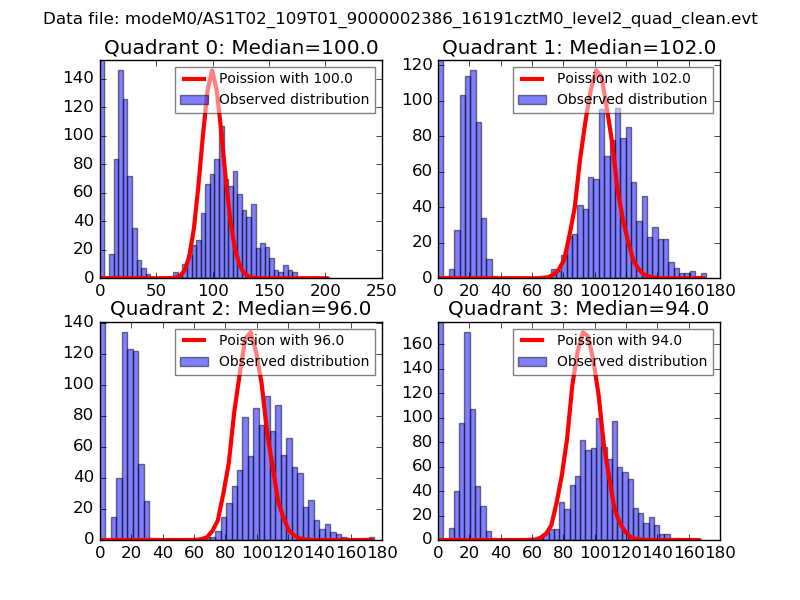 |
 |
| Quadrant-wise count rates Data is divided into 100 sec bins |
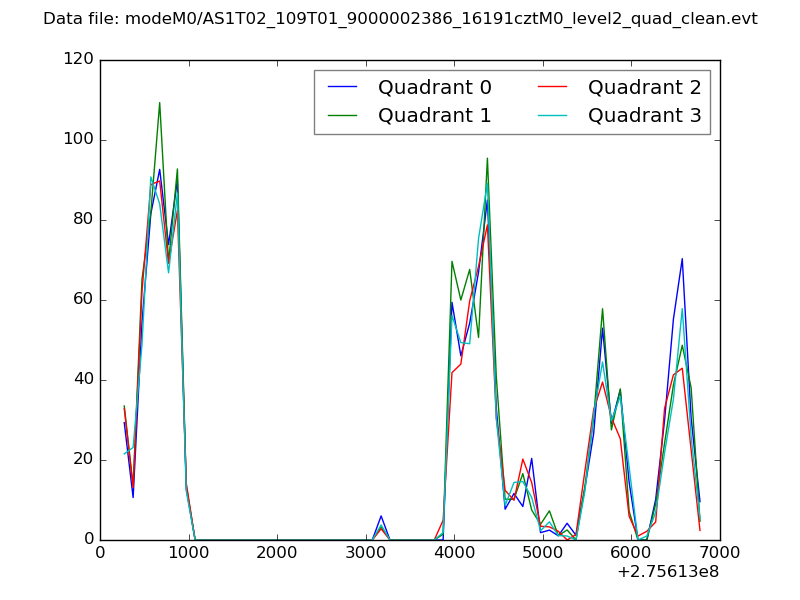 |
|
| Module-wise count rates for Quadrant A Data is divided into 100 sec bins |
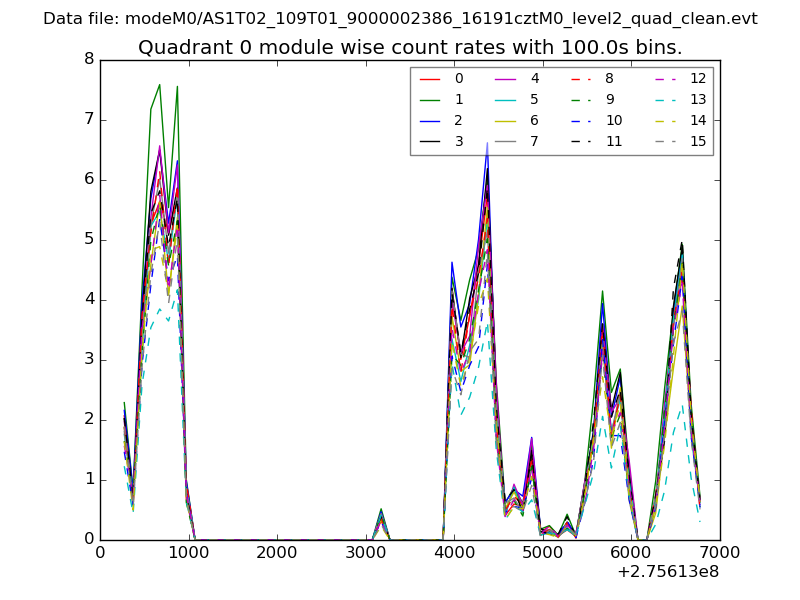 |
 |
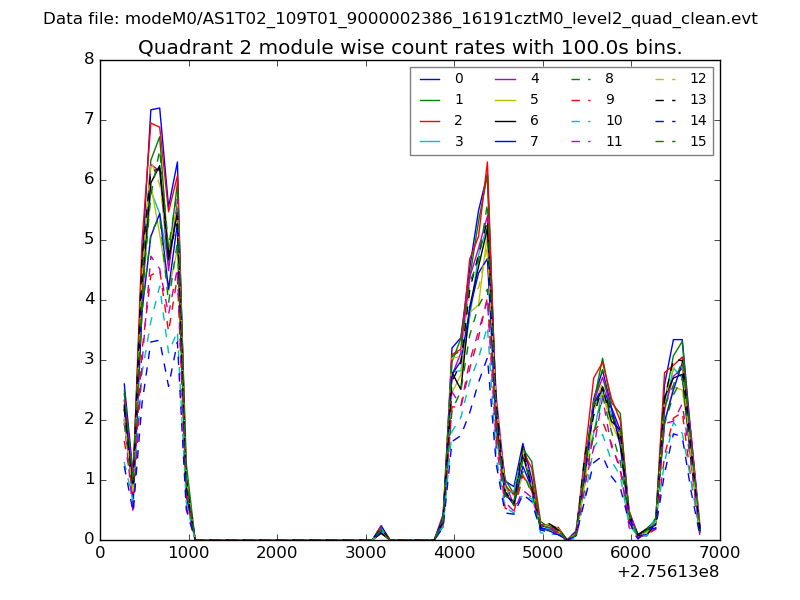
| Module-wise count rates for Quadrant B Data is divided into 100 sec bins |
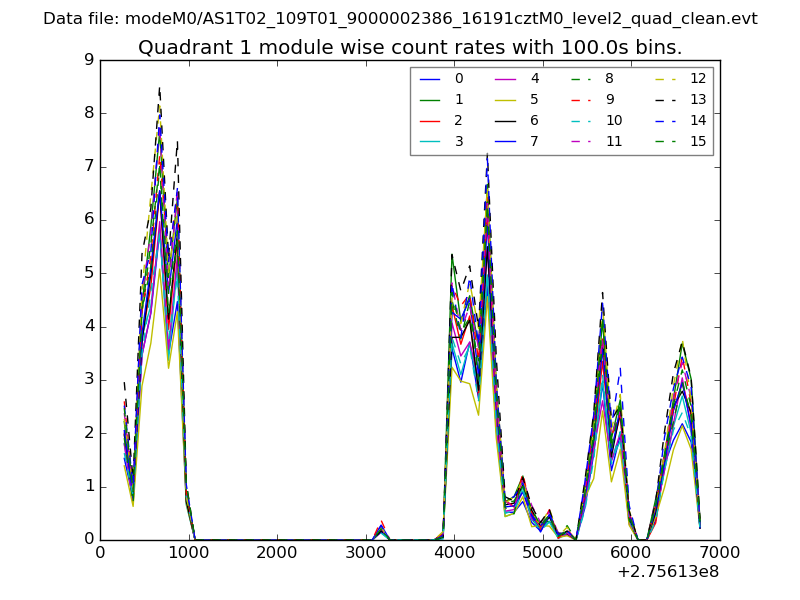 |
 |
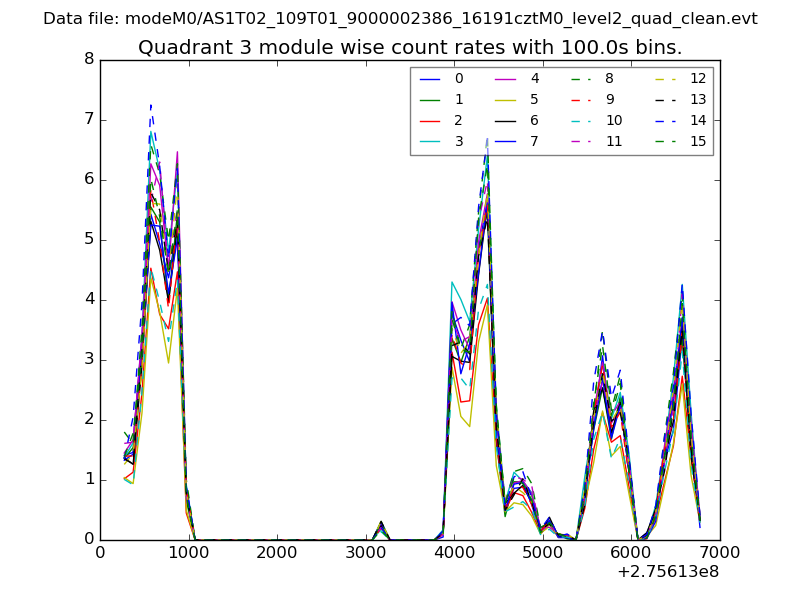
| Module-wise count rates for Quadrant C Data is divided into 100 sec bins |
 |
 |
| Module-wise count rates for Quadrant D Data is divided into 100 sec bins |
 |
 |
| Parameter | Plot |
|---|---|
| CZT HV Monitor | 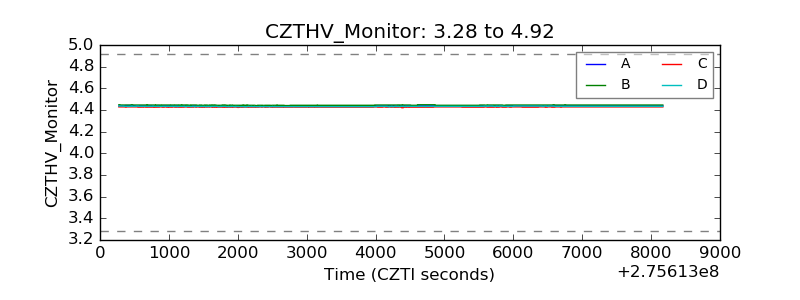 |
| D_VDD | 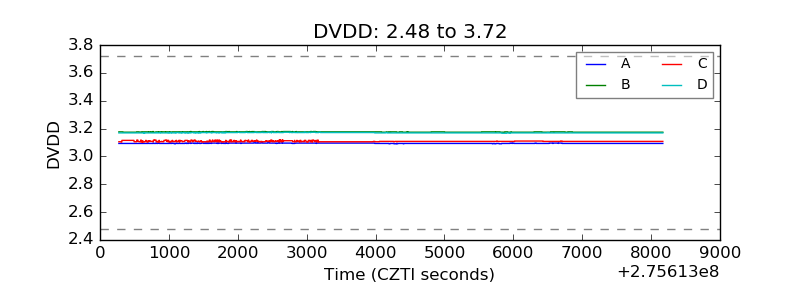 |
| Temperature 1 | 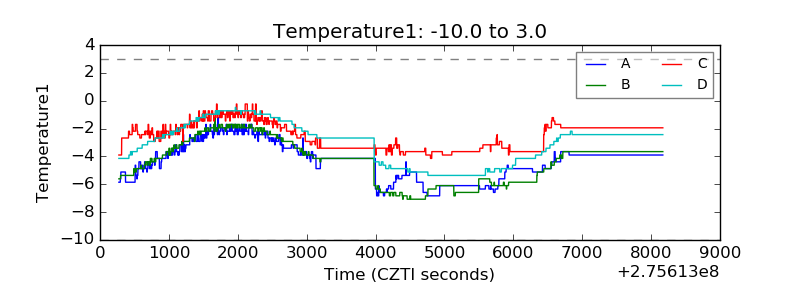 |
| Veto HV Monitor | 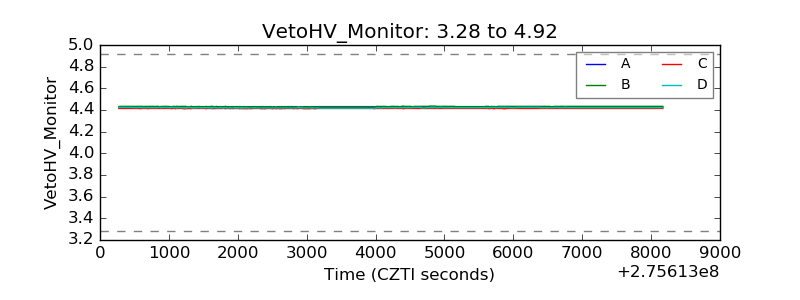 |
| Veto LLD | 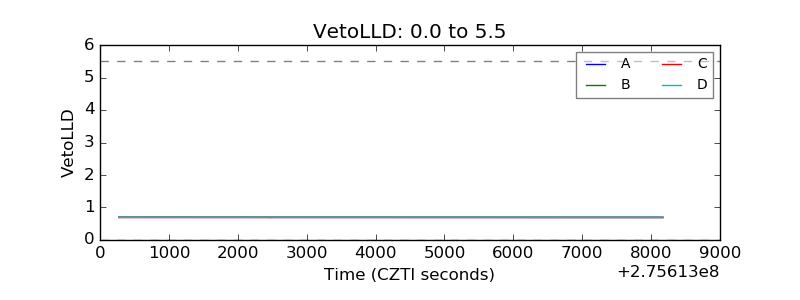 |
| Alpha Counter | 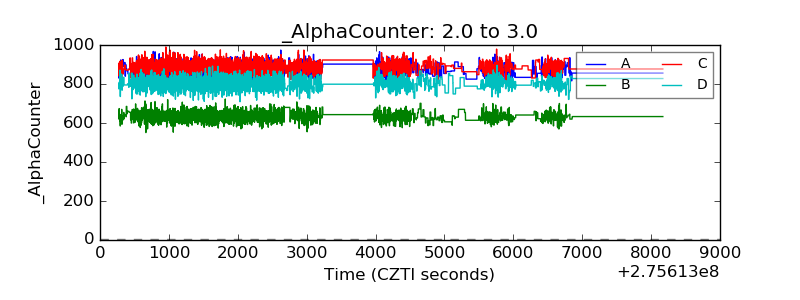 |
| _CPM_Rate | 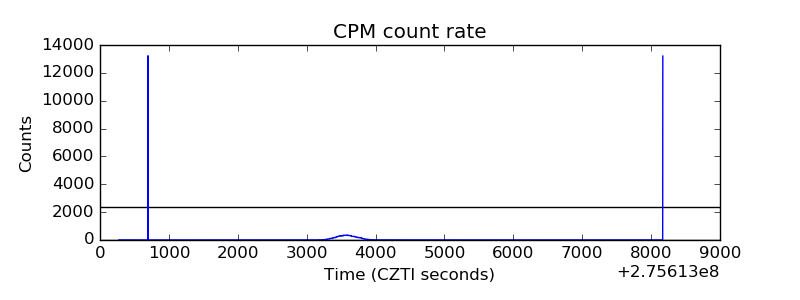 |
| CZT Counter |  |
| +2.5 Volts monitor |  |
| +5 Volts monitor | 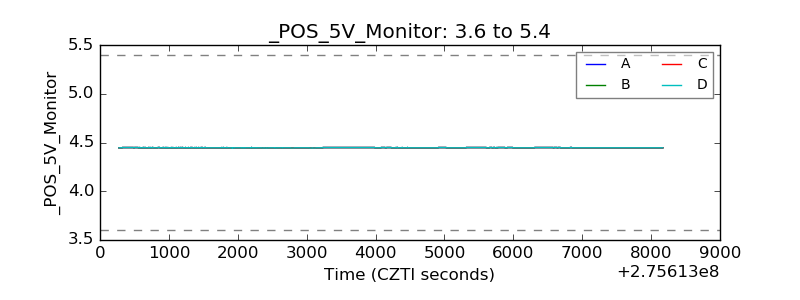 |
| _ROLL_ROT | 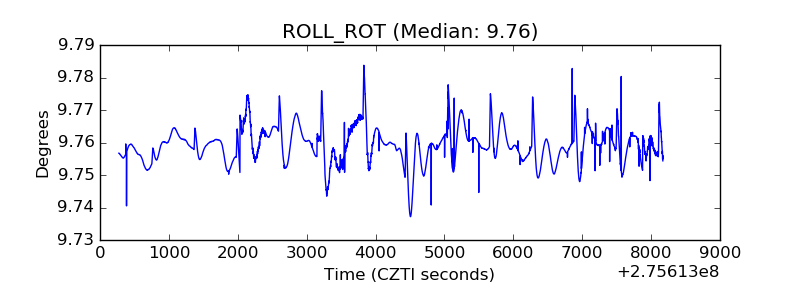 |
| _Roll_DEC | 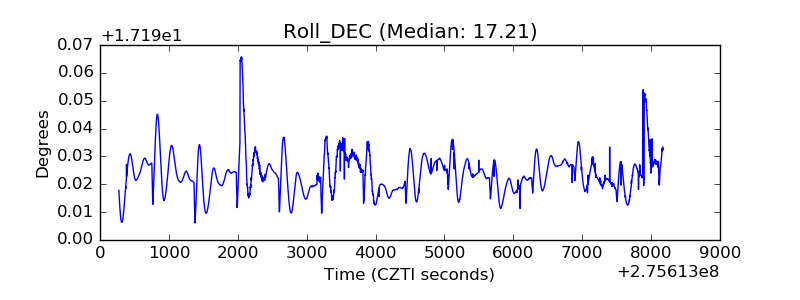 |
| _Roll_RA | 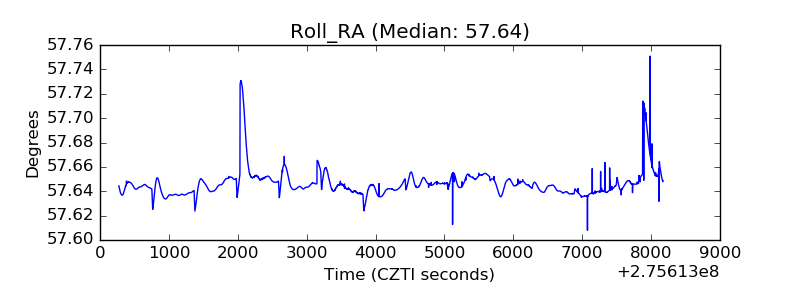 |
| Veto Counter | 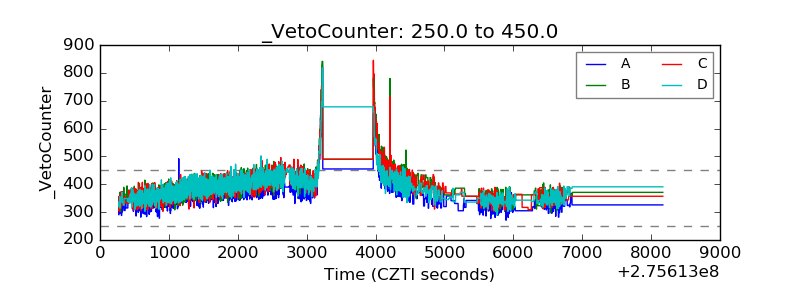 |