| Param | Original file | Final file |
|---|---|---|
| Filename | modeM0/AS1A05_069T05_9000002420_16379cztM0_level2.evt | modeM0/AS1A05_069T05_9000002420_16379cztM0_level2_quad_clean.evt |
| Size (bytes) | 19,105,920 | 5,368,320 |
| Size | 18.2 MB | 5.1 MB |
| Events in quadrant A | 129,440 | 34,123 |
| Events in quadrant B | 137,322 | 35,034 |
| Events in quadrant C | 140,132 | 33,132 |
| Events in quadrant D | 149,136 | 32,087 |
| Mode SS | |||
|---|---|---|---|
| Quadrant | BADHDUFLAG | Total packets | Discarded packets |
| A | 0 | 4 | 0 |
| B | 0 | 4 | 0 |
| C | 0 | 4 | 0 |
| D | 0 | 4 | 0 |
| Mode M0 | |||
|---|---|---|---|
| Quadrant | BADHDUFLAG | Total packets | Discarded packets |
| A | 0 | 575 | 1 |
| B | 0 | 591 | 0 |
| C | 0 | 576 | 0 |
| D | 0 | 648 | 0 |
| Quadrant | Total seconds | Saturated seconds | Saturation percentage |
|---|---|---|---|
| A | 283 | 1 | 0.353357% |
| B | 283 | 0 | 0.000000% |
| C | 283 | 0 | 0.000000% |
| D | 283 | 9 | 3.180212% |
Noise dominated data is calculated using 1-second bins in cleaned event files. If a bin has >2000 counts, and if more than 50% of those come from <1% of pixels, then it is considered to be noise-dominated and hence unusable.
| Quadrant | # 1 sec bins | Bins with >0 counts | Bins with >2000 counts | High rate bins dominated by noise | Noise dominated (total time) | Noise dominated (detector-on time) | Marked lightcurve |
|---|---|---|---|---|---|---|---|
| A | 284 | 284 | 0 | 0 | 0.00% | 0.00% | 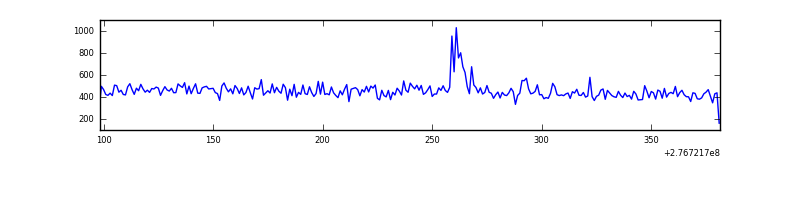 |
| B | 284 | 284 | 0 | 0 | 0.00% | 0.00% | 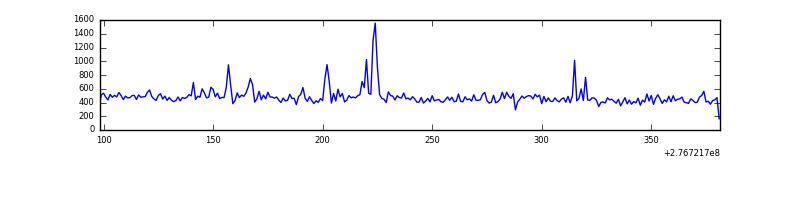 |
| C | 284 | 284 | 0 | 0 | 0.00% | 0.00% | 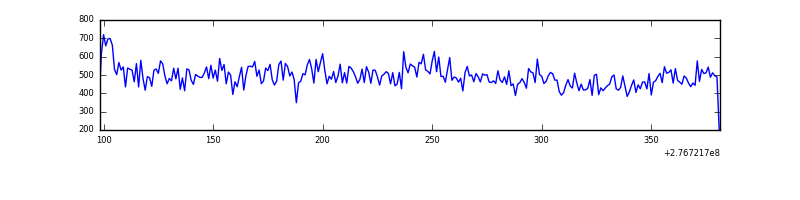 |
| D | 284 | 284 | 6 | 6 | 2.11% | 2.11% | 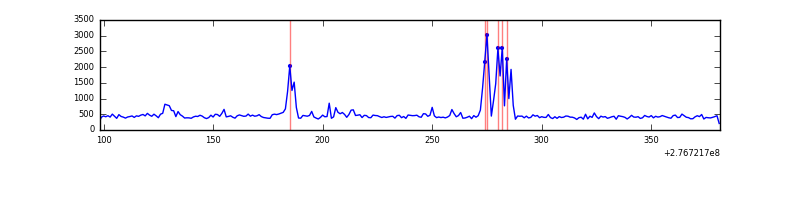 |
Top three noisy pixels from each quadrant. If the there are fewer than three noisy pixels in the level2.evt file, extra rows are filled as -1
| Pixel properties | Quadrant properties | ||||||
|---|---|---|---|---|---|---|---|
| Quadrant | DetID | PixID | Counts | Sigma | Mean | Median | Sigma |
| A | 15 | 223 | 4364 | 517.93 | 31 | 30 | 8.4 |
| A | 15 | 174 | 4112 | 487.82 | 31 | 30 | 8.4 |
| A | 15 | 239 | 1319 | 154.04 | 31 | 30 | 8.4 |
| B | 0 | 197 | 7218 | 885.97 | 31 | 30 | 8.1 |
| B | 0 | 189 | 3851 | 470.96 | 31 | 30 | 8.1 |
| B | 0 | 182 | 1419 | 171.2 | 31 | 30 | 8.1 |
| C | 3 | 233 | 15440 | 1683.6 | 30 | 30 | 9.2 |
| C | 14 | 238 | 4728 | 513.27 | 30 | 30 | 9.2 |
| C | 13 | 61 | 232 | 22.07 | 30 | 30 | 9.2 |
| D | 10 | 70 | 24503 | 2630.98 | 30 | 28 | 9.3 |
| D | 12 | 218 | 7531 | 806.55 | 30 | 28 | 9.3 |
| D | 1 | 52 | 2665 | 283.47 | 30 | 28 | 9.3 |
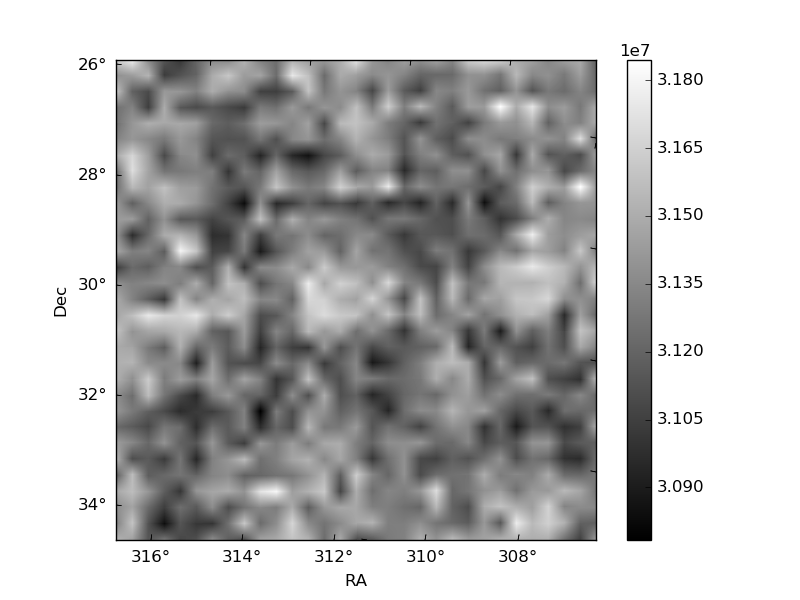
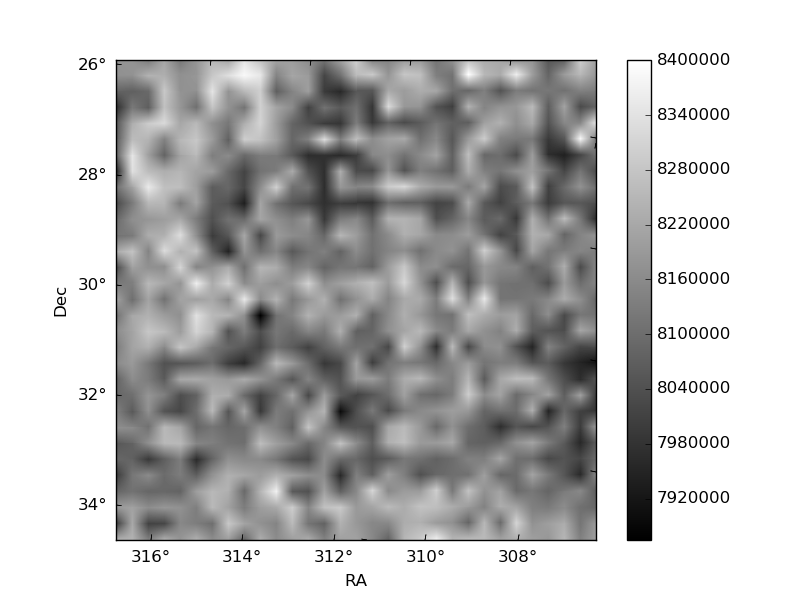
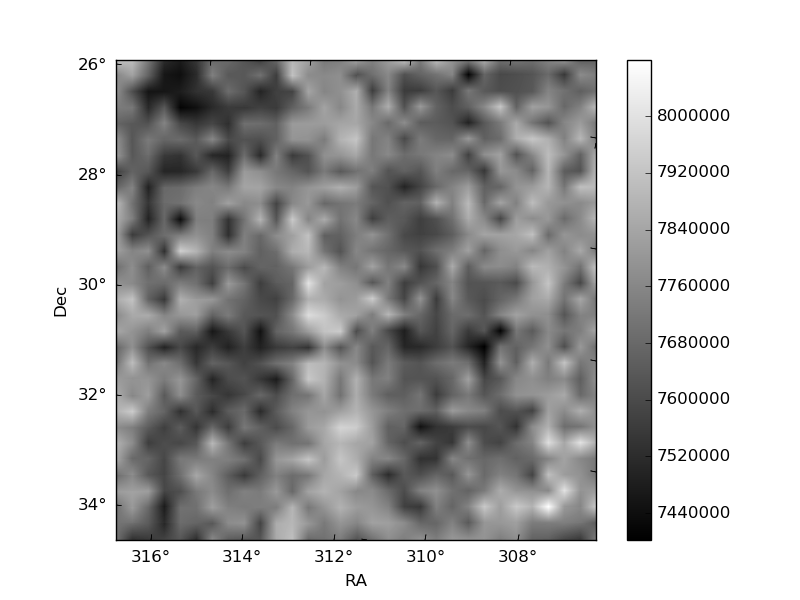
Histogram calculated using DETX and DETY for each event in the final _common_clean file
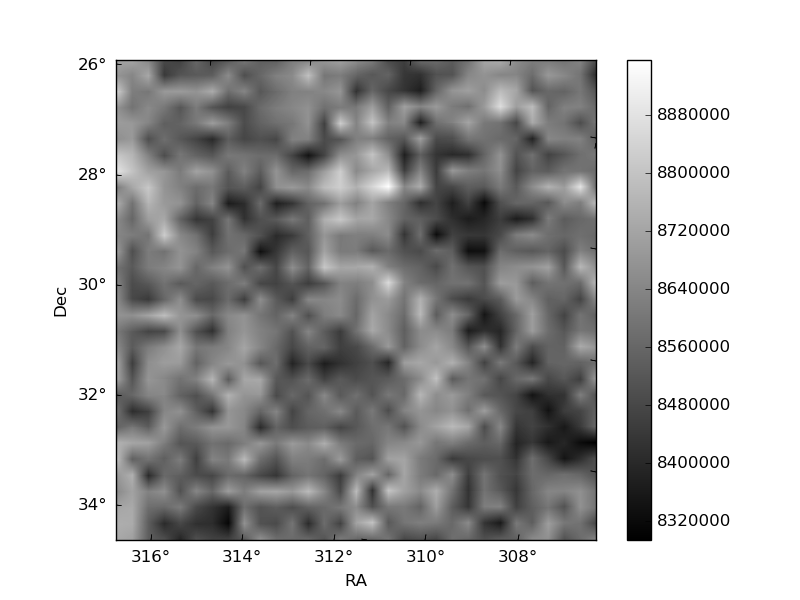
| Quadrant A | 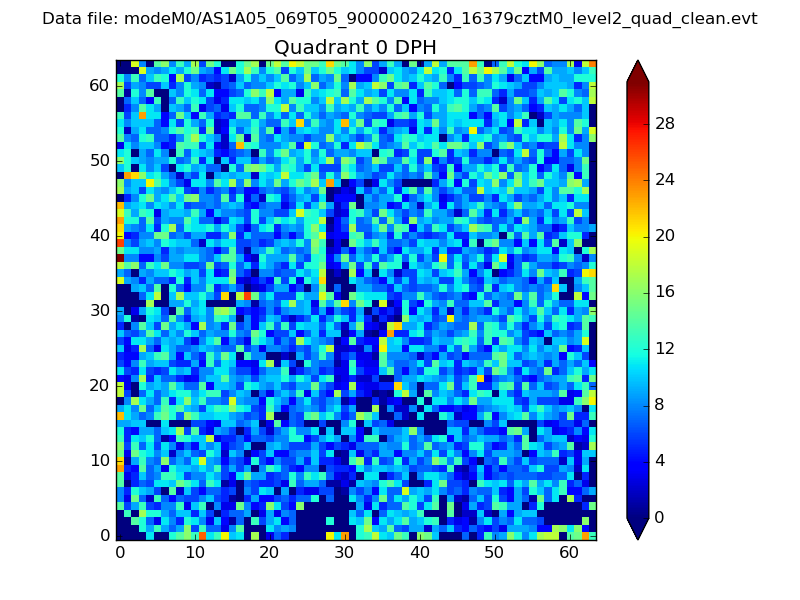 |
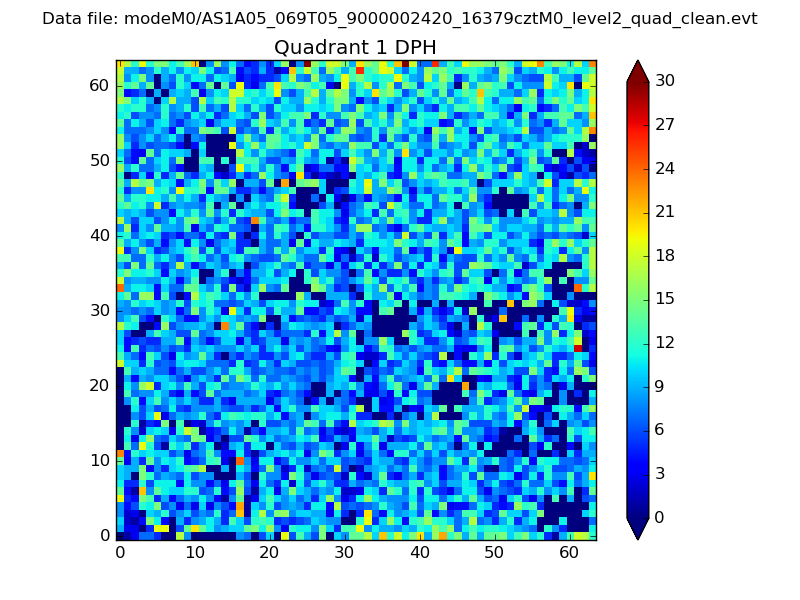 |
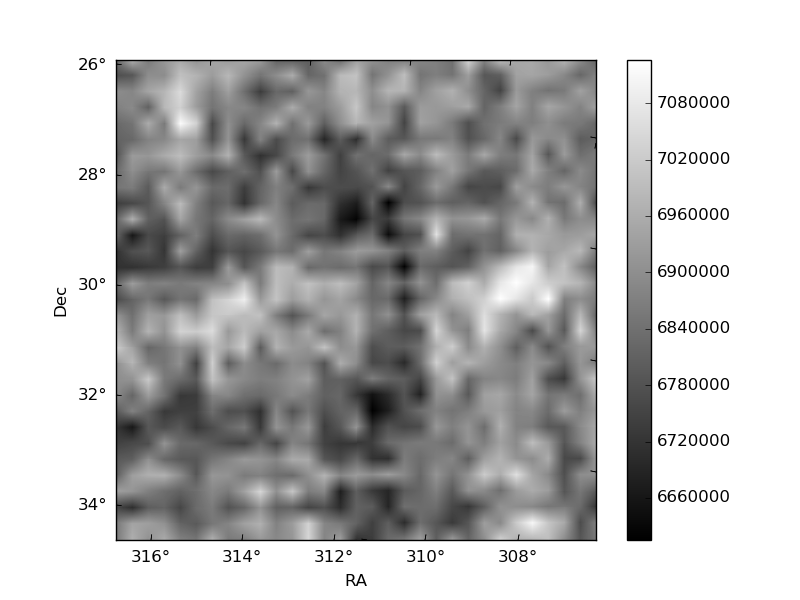
Quadrant B |
|---|---|---|---|
| Quadrant D | 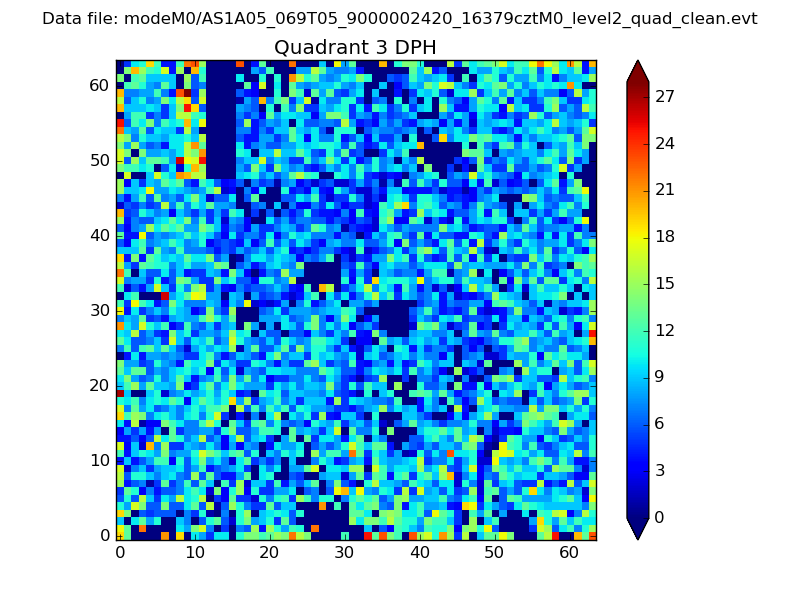 |
 |
Quadrant C |
| Plot type | Count rate plots | Images |
|---|---|---|
| Comparison with Poisson distribution Blue bars denote a histogram of data divided into 1 sec bins. Red curve is a Poisson curve with rate = median count rate of data. |
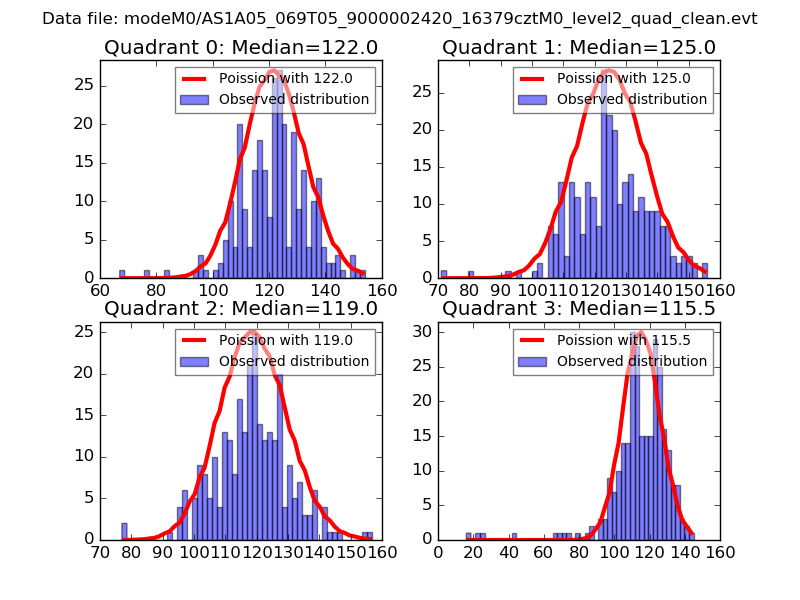 |
 |
| Quadrant-wise count rates Data is divided into 100 sec bins |
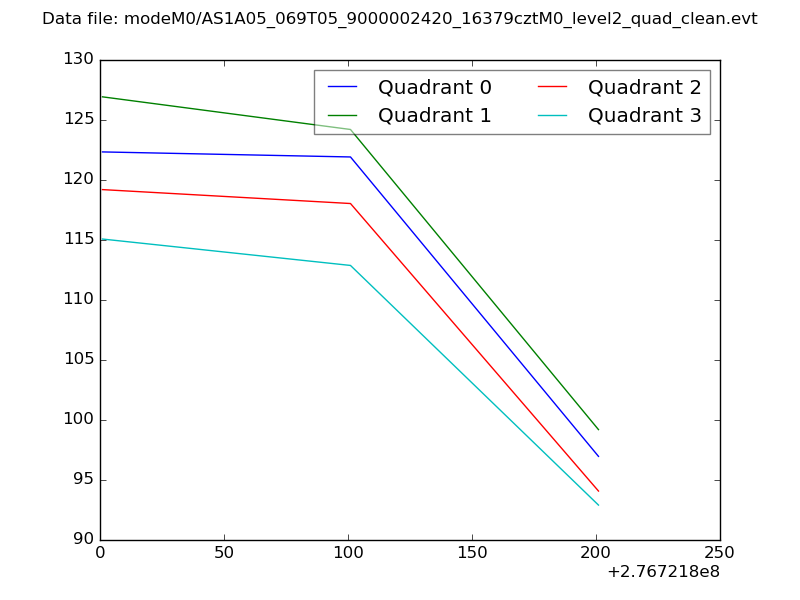 |
|
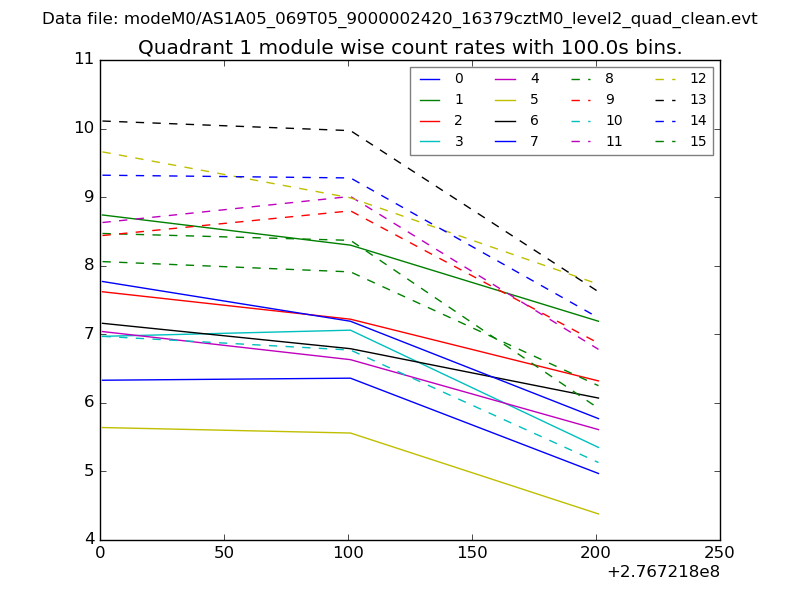
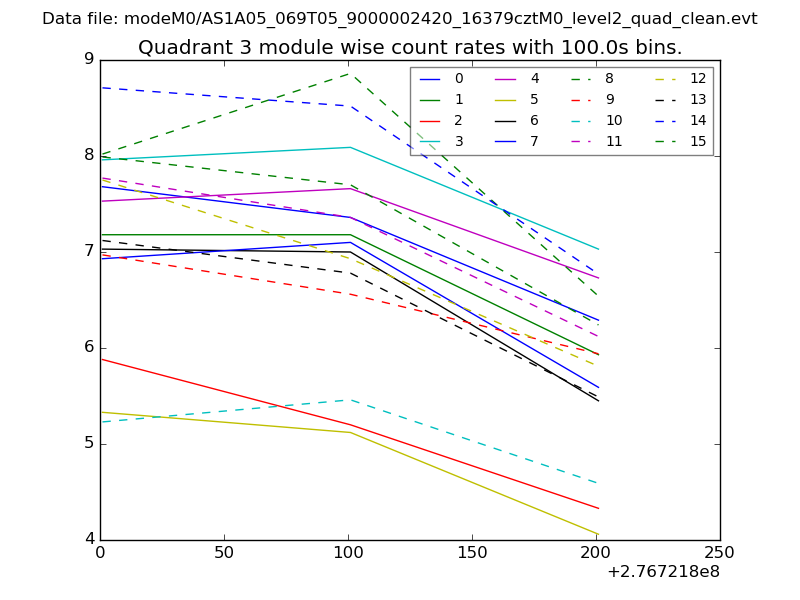
| Module-wise count rates for Quadrant A Data is divided into 100 sec bins |
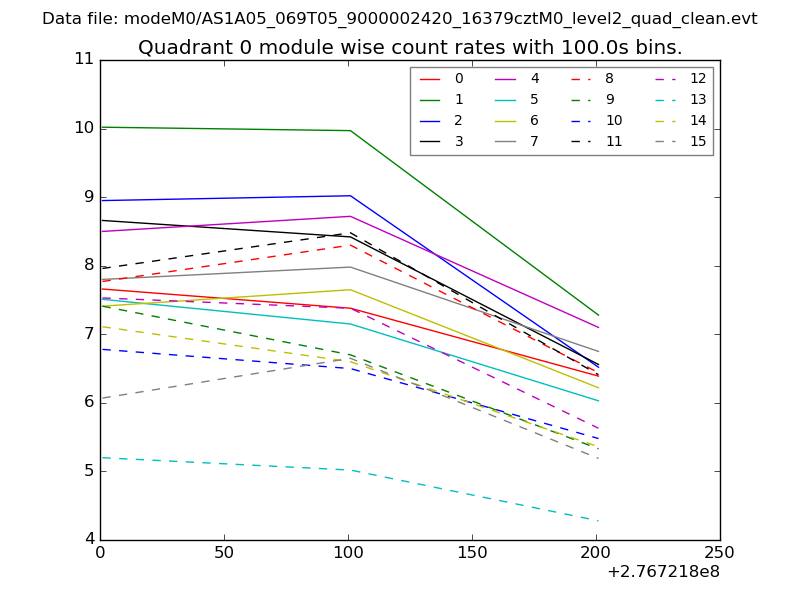 |
 |
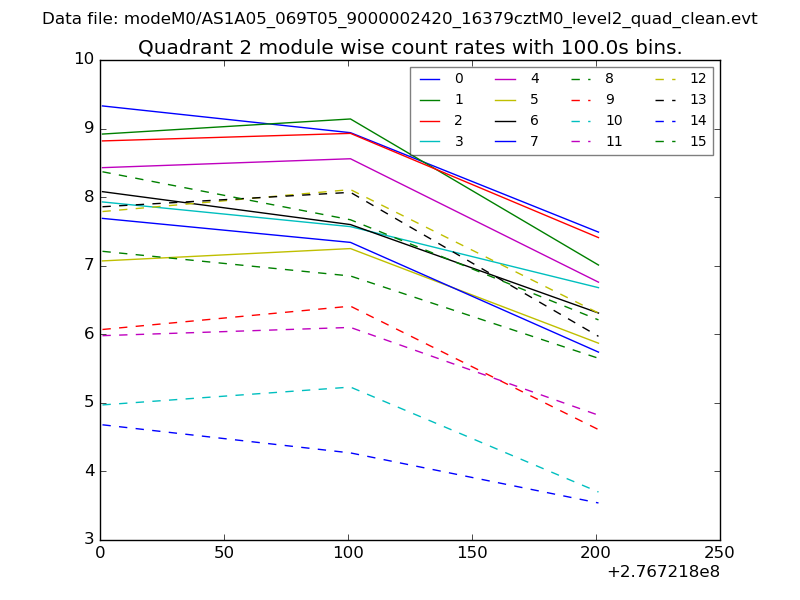
| Module-wise count rates for Quadrant B Data is divided into 100 sec bins |
 |
 |
| Module-wise count rates for Quadrant C Data is divided into 100 sec bins |
 |
 |
| Module-wise count rates for Quadrant D Data is divided into 100 sec bins |
 |
 |
| Parameter | Plot |
|---|---|
| CZT HV Monitor | 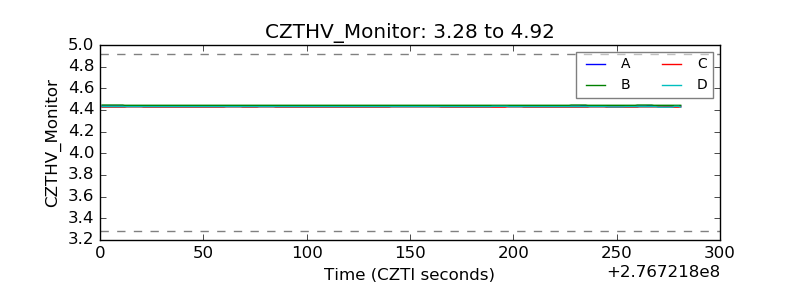 |
| D_VDD | 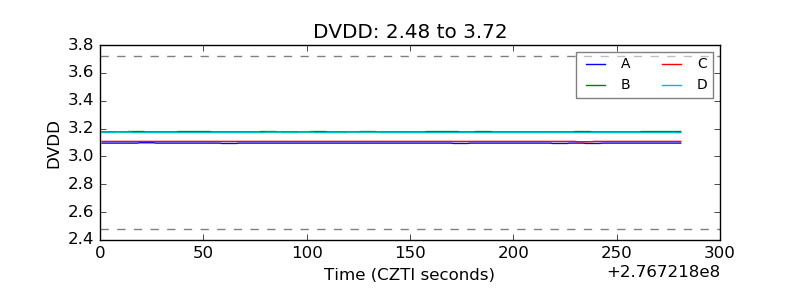 |
| Temperature 1 | 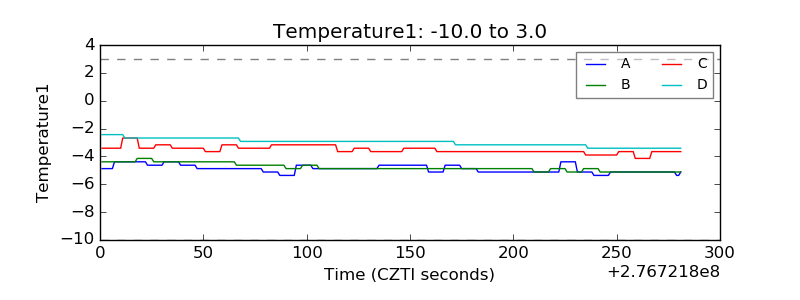 |
| Veto HV Monitor |  |
| Veto LLD | 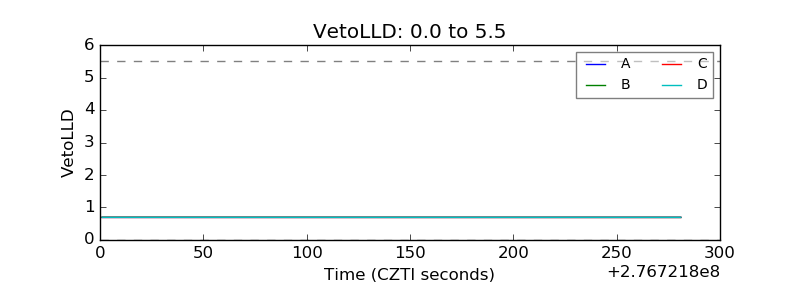 |
| Alpha Counter | 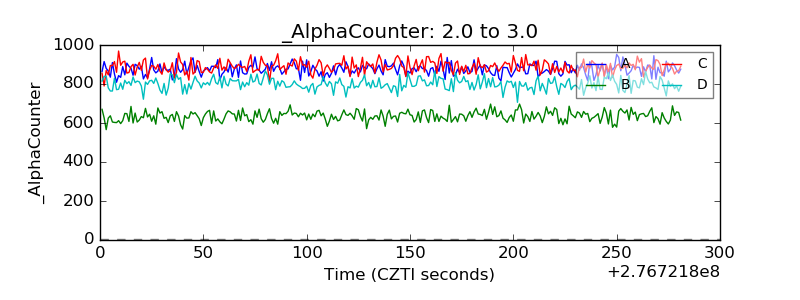 |
| _CPM_Rate | 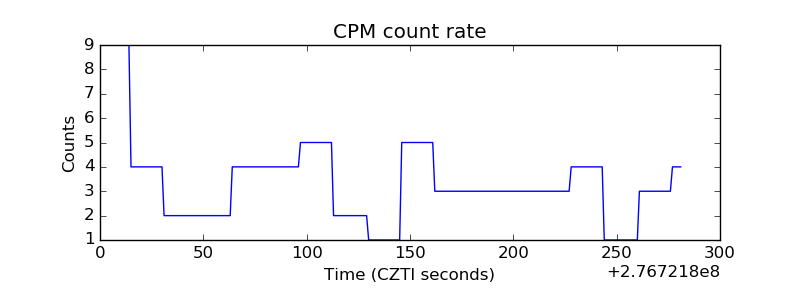 |
| CZT Counter | 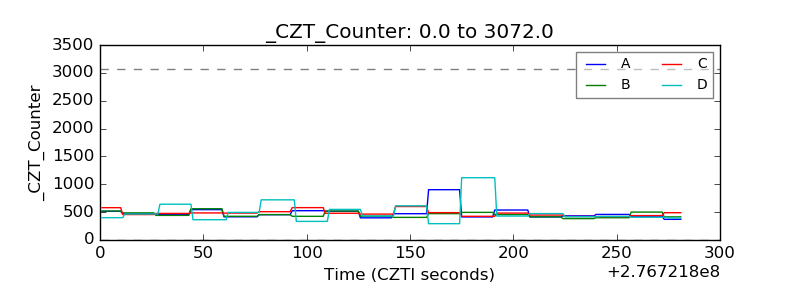 |
| +2.5 Volts monitor |  |
| +5 Volts monitor |  |
| _ROLL_ROT | 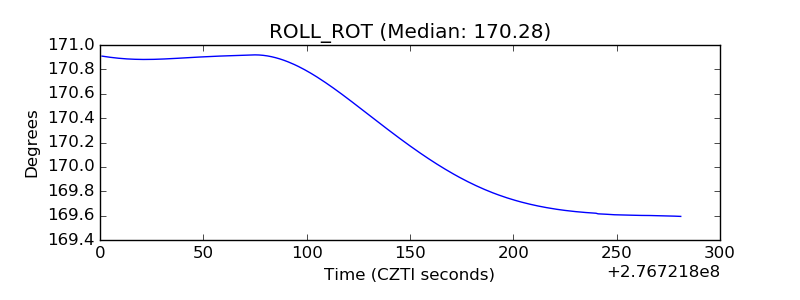 |
| _Roll_DEC | 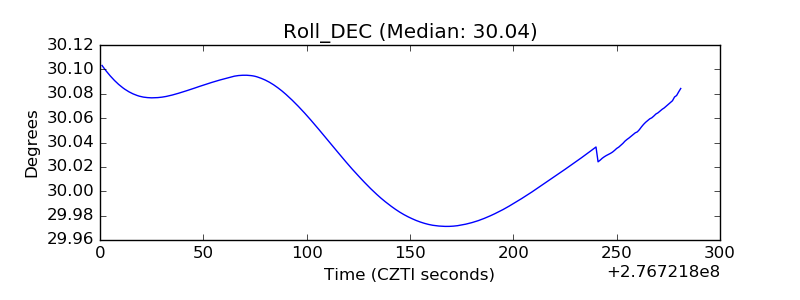 |
| _Roll_RA | 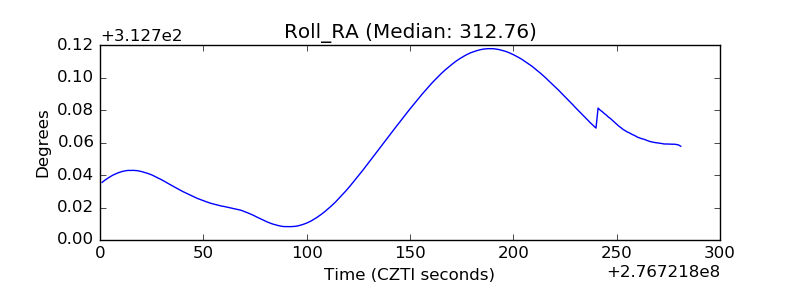 |
| Veto Counter | 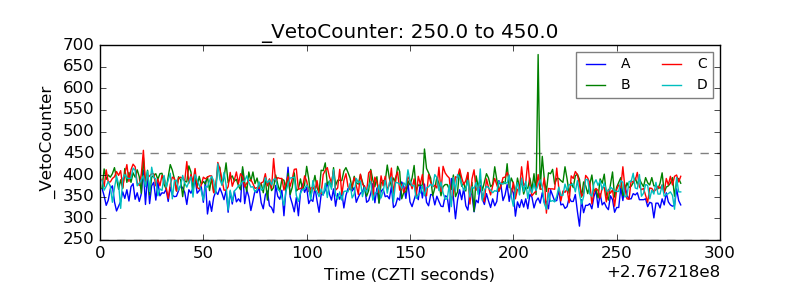 |