| Param | Original file | Final file |
|---|---|---|
| Filename | modeM0/AS1T03_034T01_9000002500_16860cztM0_level2.evt | modeM0/AS1T03_034T01_9000002500_16860cztM0_level2_quad_clean.evt |
| Size (bytes) | 355,697,280 | 54,512,640 |
| Size | 339.2 MB | 52.0 MB |
| Events in quadrant A | 2,277,338 | 334,264 |
| Events in quadrant B | 2,440,087 | 345,569 |
| Events in quadrant C | 2,429,393 | 326,786 |
| Events in quadrant D | 3,308,106 | 316,256 |
| Mode M9 | |||
|---|---|---|---|
| Quadrant | BADHDUFLAG | Total packets | Discarded packets |
| A | 0 | 11 | 0 |
| B | 0 | 11 | 0 |
| C | 0 | 11 | 0 |
| D | 0 | 11 | 0 |
| Mode M0 | |||
|---|---|---|---|
| Quadrant | BADHDUFLAG | Total packets | Discarded packets |
| A | 0 | 9624 | 1 |
| B | 0 | 10191 | 1 |
| C | 0 | 9912 | 1 |
| D | 0 | 13023 | 1 |
| Mode SS | |||
|---|---|---|---|
| Quadrant | BADHDUFLAG | Total packets | Discarded packets |
| A | 0 | 96 | 0 |
| B | 0 | 96 | 0 |
| C | 0 | 96 | 0 |
| D | 0 | 96 | 0 |
| Quadrant | Total seconds | Saturated seconds | Saturation percentage |
|---|---|---|---|
| A | 4658 | 16 | 0.343495% |
| B | 4658 | 46 | 0.987548% |
| C | 4658 | 45 | 0.966080% |
| D | 4658 | 230 | 4.937742% |
Noise dominated data is calculated using 1-second bins in cleaned event files. If a bin has >2000 counts, and if more than 50% of those come from <1% of pixels, then it is considered to be noise-dominated and hence unusable.
| Quadrant | # 1 sec bins | Bins with >0 counts | Bins with >2000 counts | High rate bins dominated by noise | Noise dominated (total time) | Noise dominated (detector-on time) | Marked lightcurve |
|---|---|---|---|---|---|---|---|
| A | 5814 | 4660 | 0 | 0 | 0.00% | 0.00% | 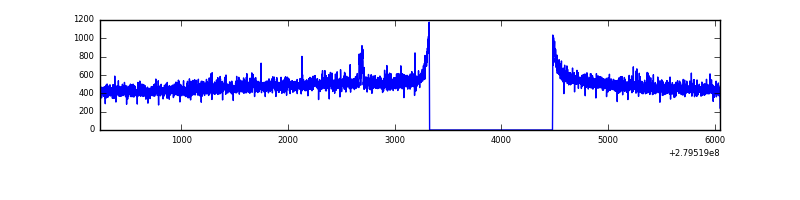 |
| B | 5814 | 4660 | 1 | 1 | 0.02% | 0.02% | 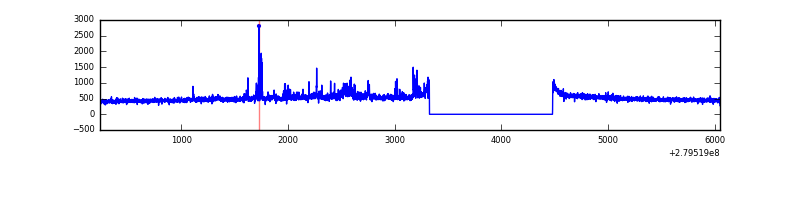 |
| C | 5814 | 4660 | 0 | 0 | 0.00% | 0.00% | 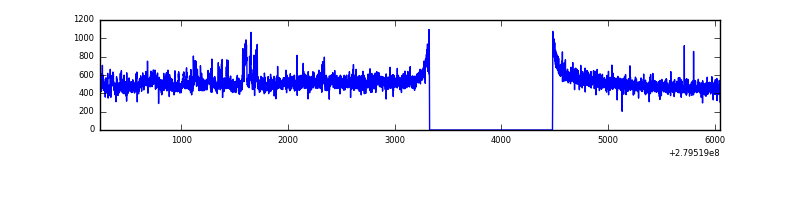 |
| D | 5814 | 4660 | 142 | 142 | 2.44% | 3.05% | 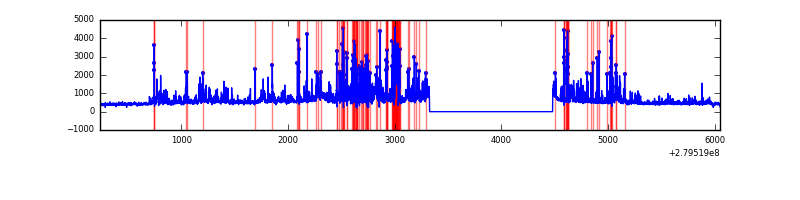 |
Top three noisy pixels from each quadrant. If the there are fewer than three noisy pixels in the level2.evt file, extra rows are filled as -1
| Pixel properties | Quadrant properties | ||||||
|---|---|---|---|---|---|---|---|
| Quadrant | DetID | PixID | Counts | Sigma | Mean | Median | Sigma |
| A | 0 | 23 | 14197 | 114.74 | 587 | 575 | 118.7 |
| A | 0 | 226 | 6134 | 46.83 | 587 | 575 | 118.7 |
| A | 3 | 137 | 4272 | 31.14 | 587 | 575 | 118.7 |
| B | 15 | 35 | 105460 | 938.42 | 586 | 572 | 111.8 |
| B | 3 | 209 | 16446 | 142.02 | 586 | 572 | 111.8 |
| B | 0 | 197 | 13032 | 111.48 | 586 | 572 | 111.8 |
| C | 3 | 233 | 131240 | 983.77 | 566 | 570 | 132.8 |
| C | 14 | 238 | 88367 | 660.99 | 566 | 570 | 132.8 |
| C | 13 | 61 | 4021 | 25.98 | 566 | 570 | 132.8 |
| D | 1 | 52 | 1170918 | 8540.99 | 561 | 545 | 137.0 |
| D | 2 | 234 | 18613 | 131.85 | 561 | 545 | 137.0 |
| D | 15 | 145 | 13029 | 91.1 | 561 | 545 | 137.0 |
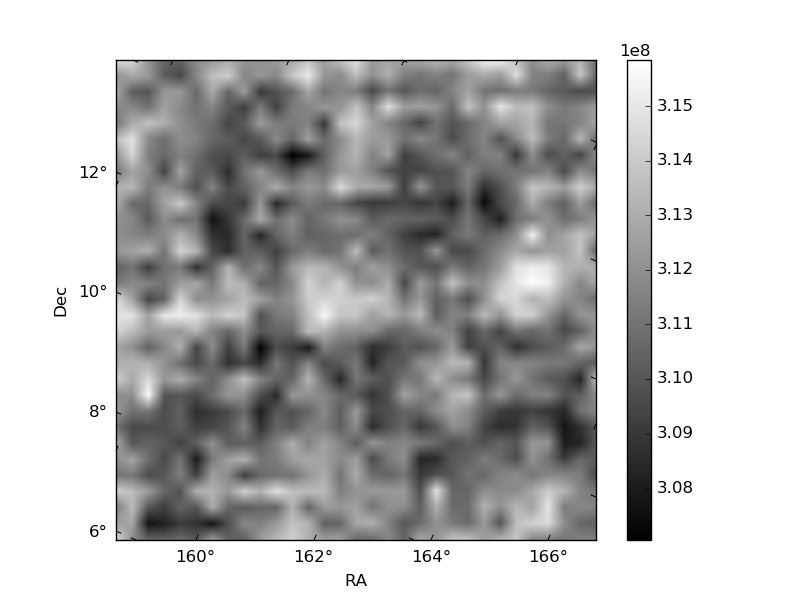
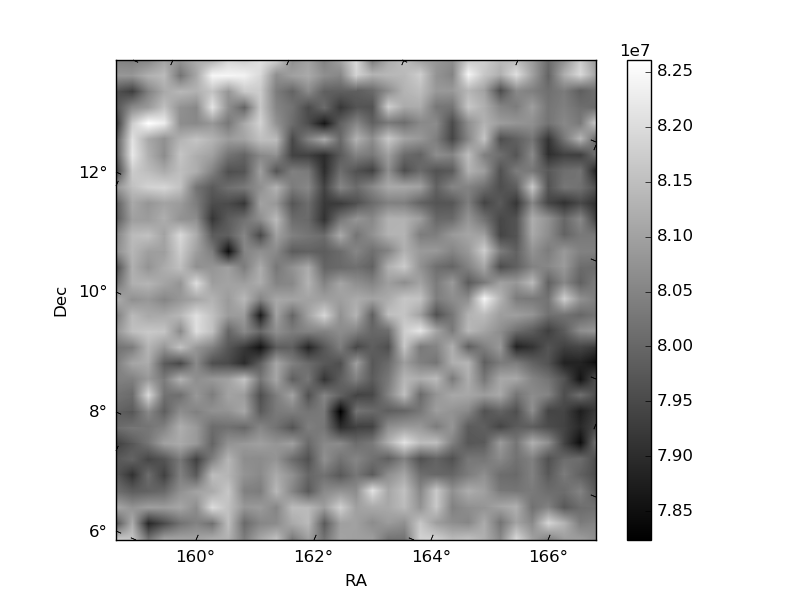
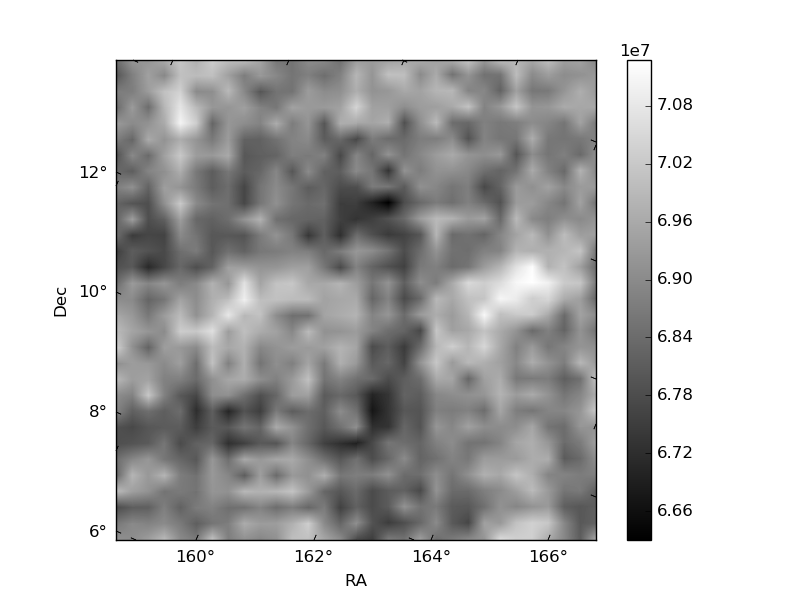
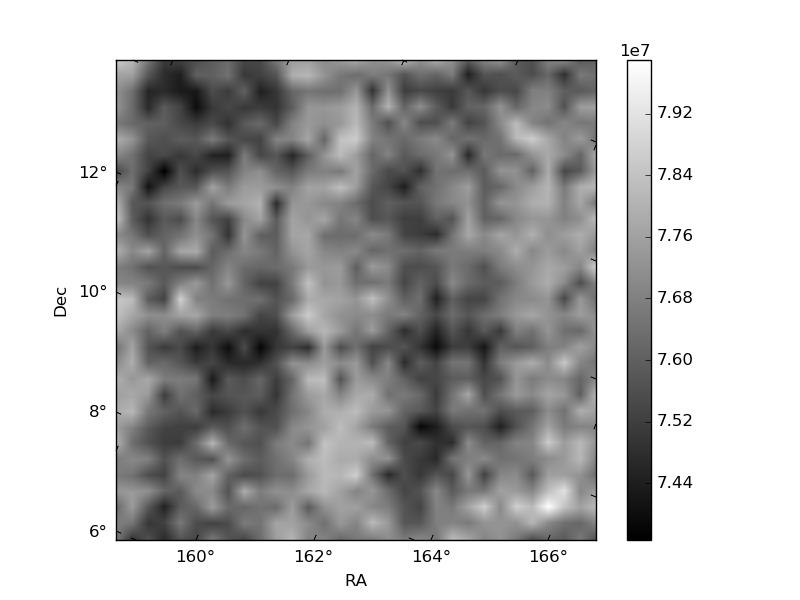
Histogram calculated using DETX and DETY for each event in the final _common_clean file
| Quadrant A | 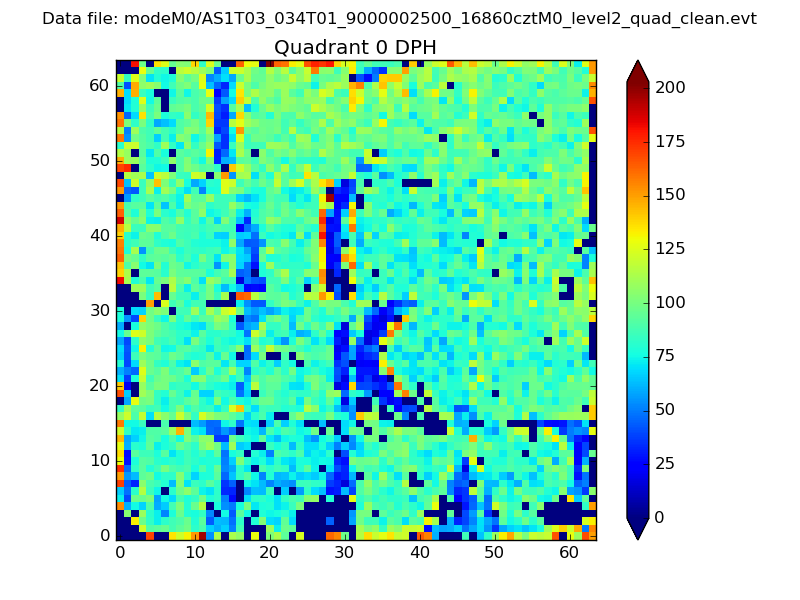 |
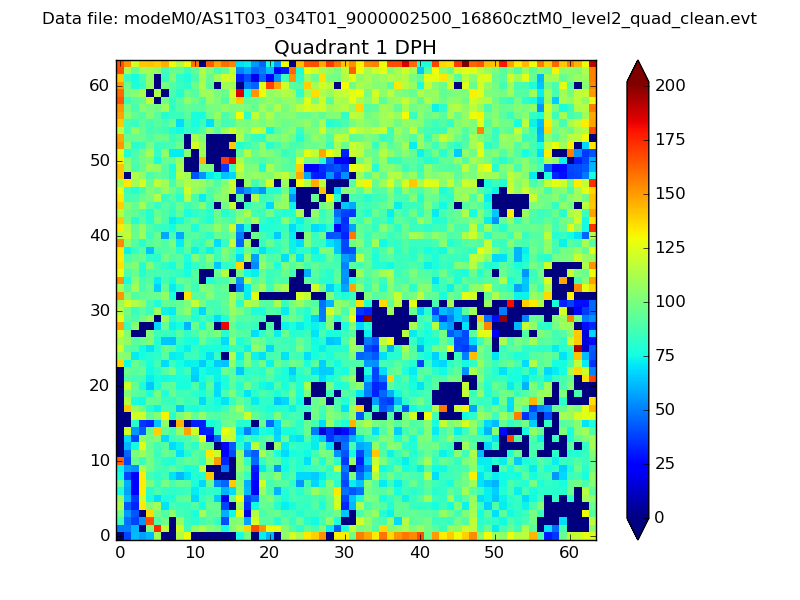 |
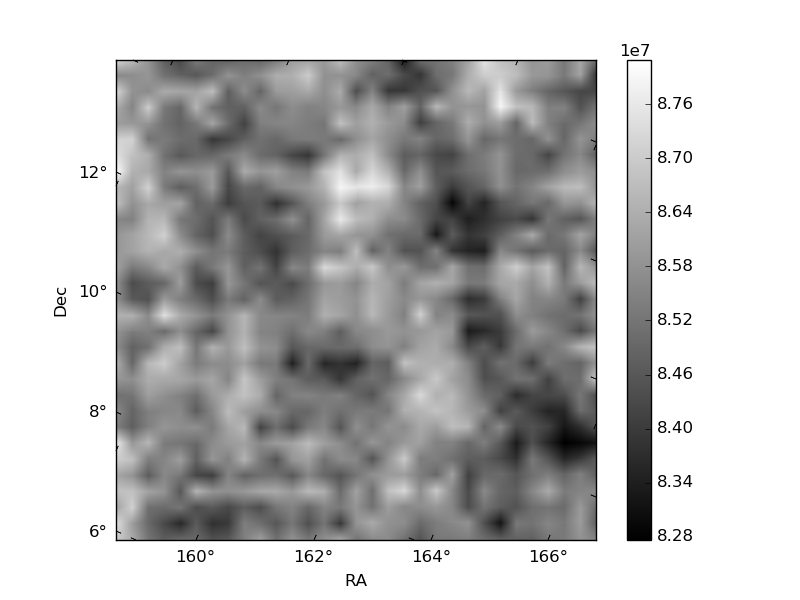
Quadrant B |
|---|---|---|---|
| Quadrant D | 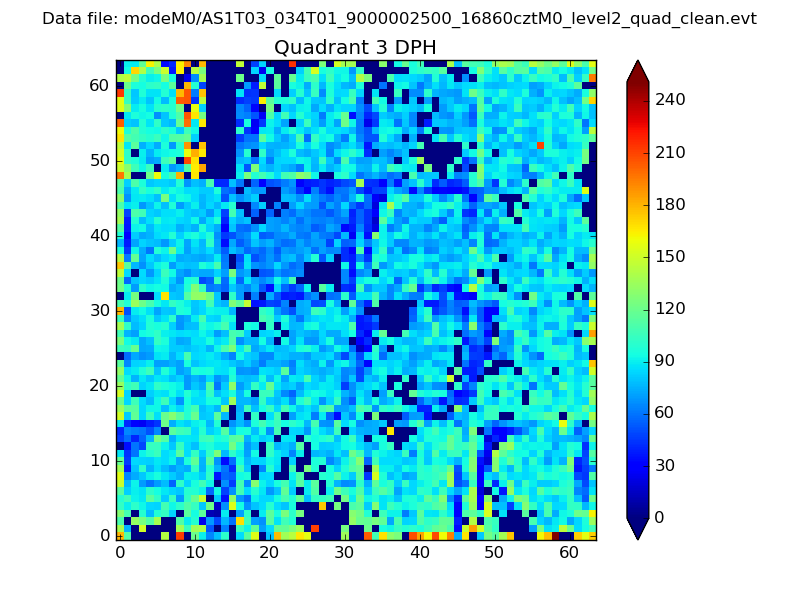 |
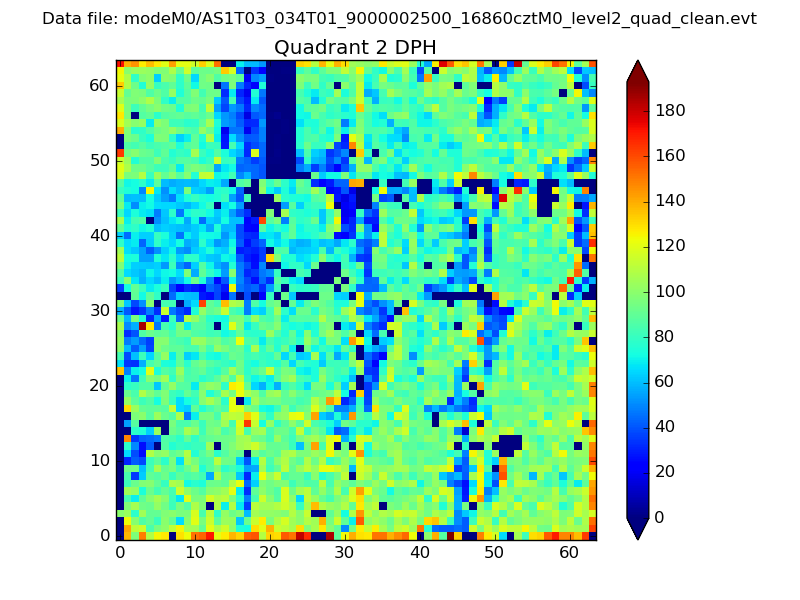 |
Quadrant C |
| Plot type | Count rate plots | Images |
|---|---|---|
| Comparison with Poisson distribution Blue bars denote a histogram of data divided into 1 sec bins. Red curve is a Poisson curve with rate = median count rate of data. |
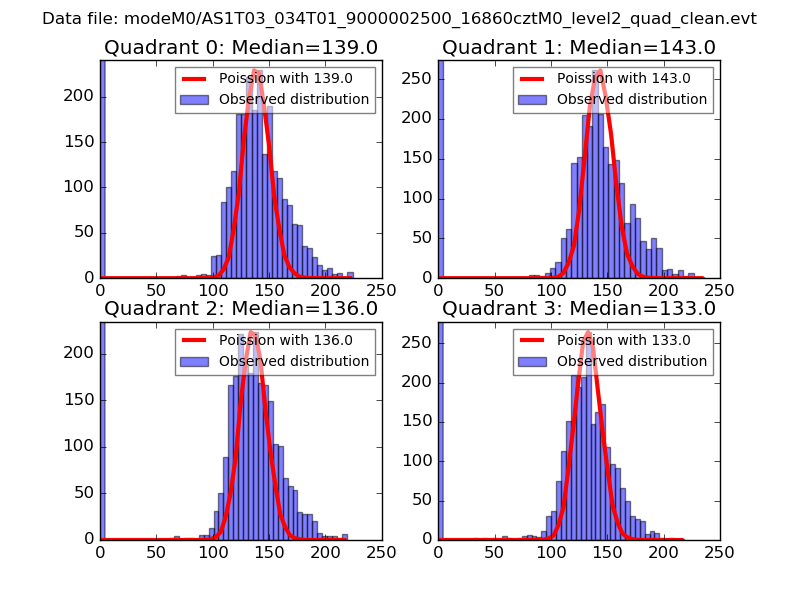 |
 |
| Quadrant-wise count rates Data is divided into 100 sec bins |
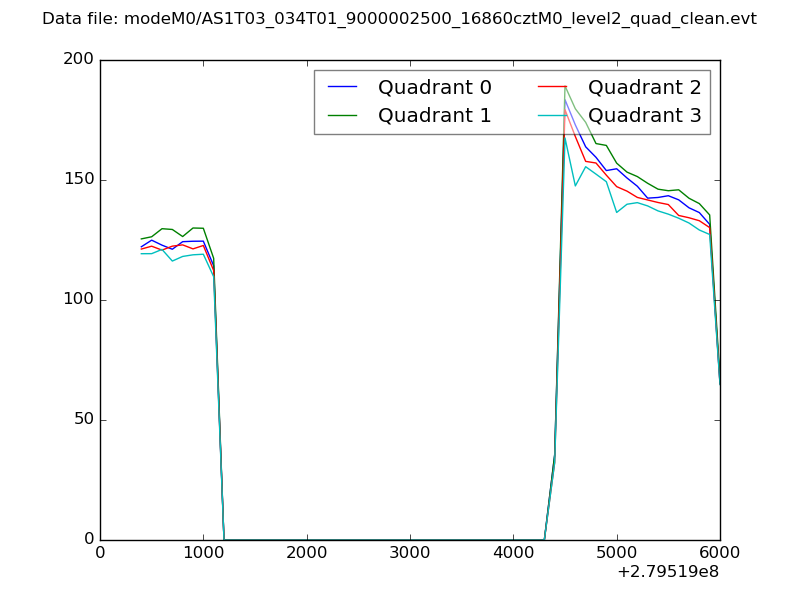 |
|
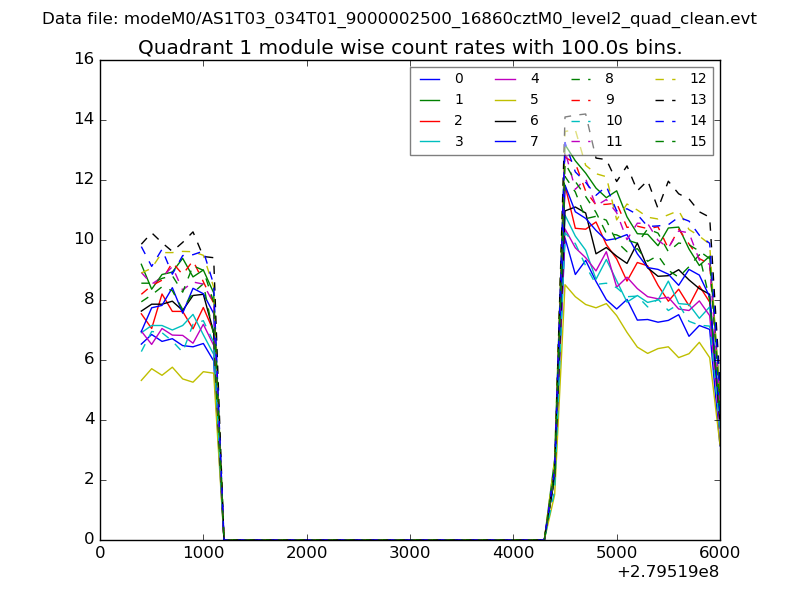
| Module-wise count rates for Quadrant A Data is divided into 100 sec bins |
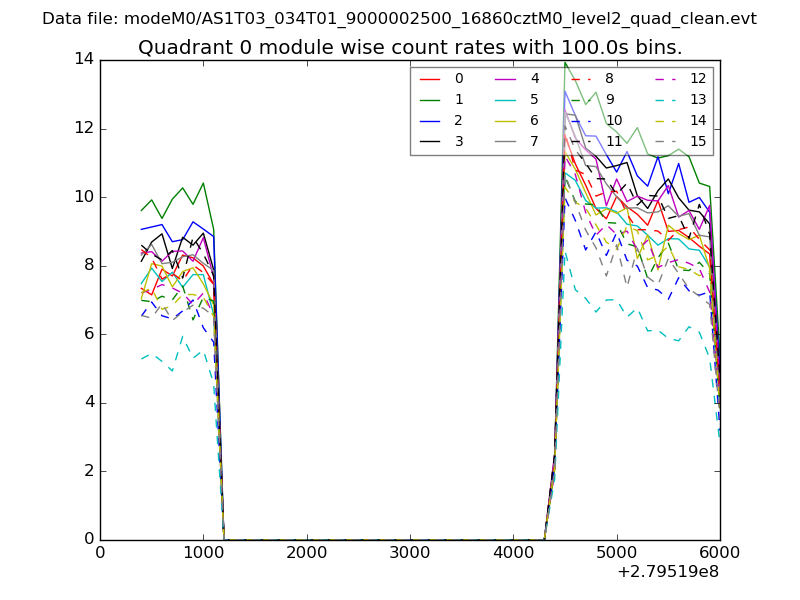 |
 |
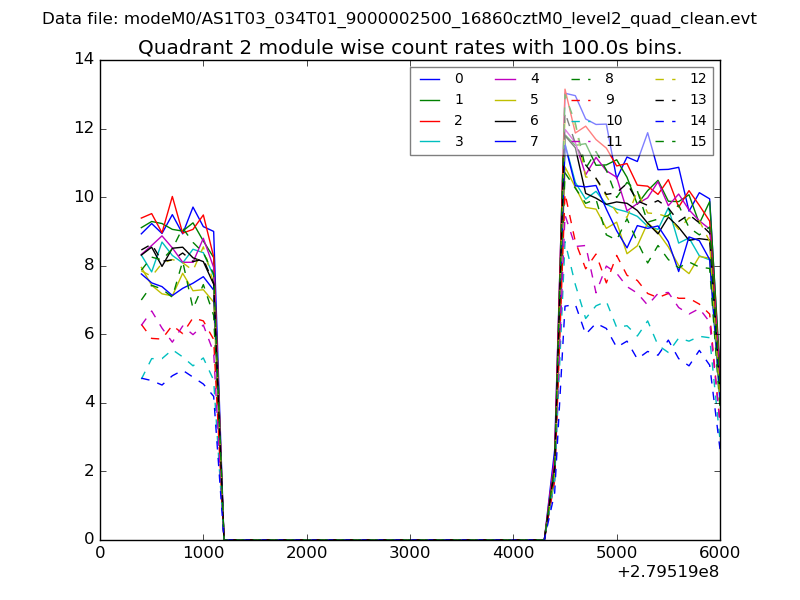
| Module-wise count rates for Quadrant B Data is divided into 100 sec bins |
 |
 |
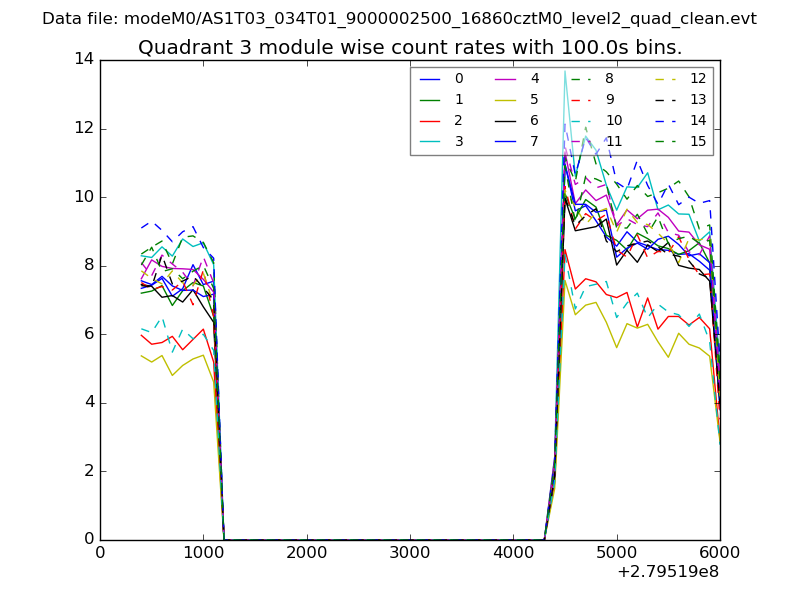
| Module-wise count rates for Quadrant C Data is divided into 100 sec bins |
 |
 |
| Module-wise count rates for Quadrant D Data is divided into 100 sec bins |
 |
 |
| Parameter | Plot |
|---|---|
| CZT HV Monitor | 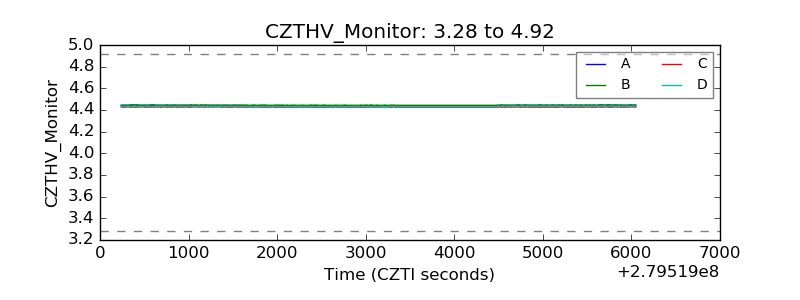 |
| D_VDD | 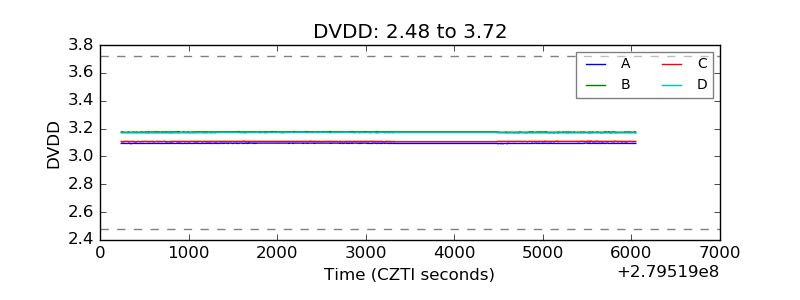 |
| Temperature 1 | 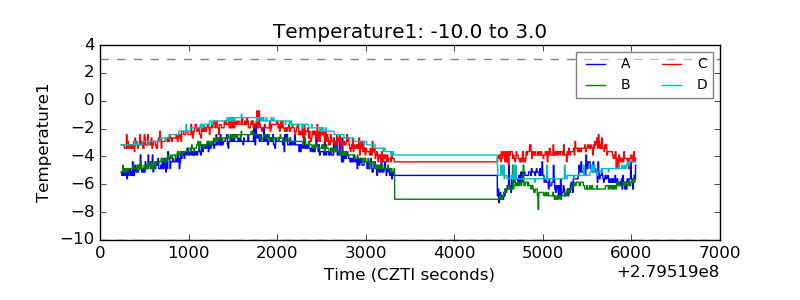 |
| Veto HV Monitor | 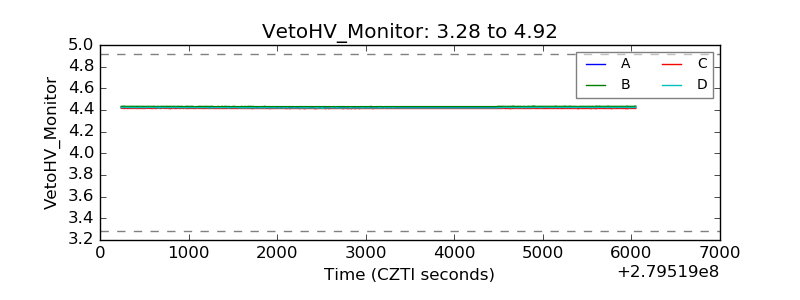 |
| Veto LLD | 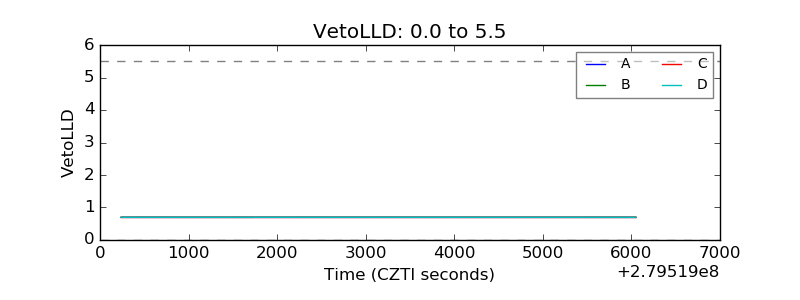 |
| Alpha Counter | 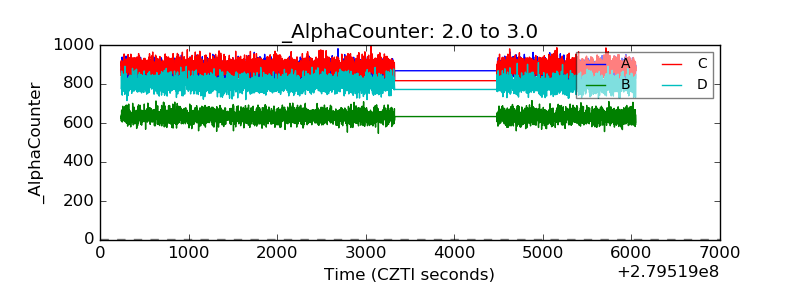 |
| _CPM_Rate | 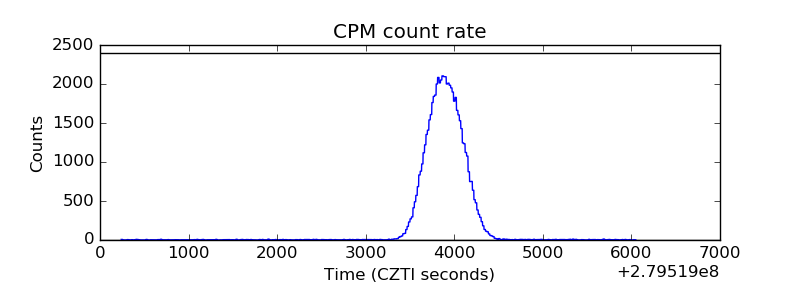 |
| CZT Counter | 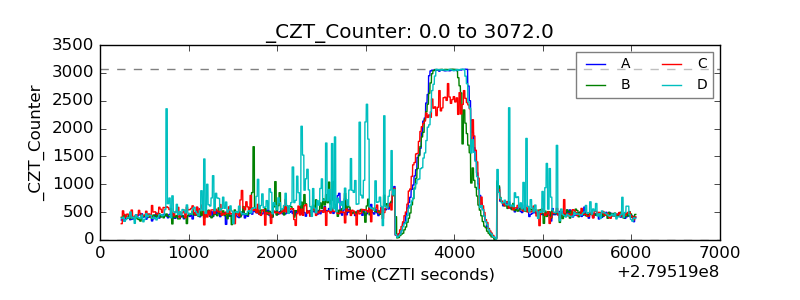 |
| +2.5 Volts monitor |  |
| +5 Volts monitor | 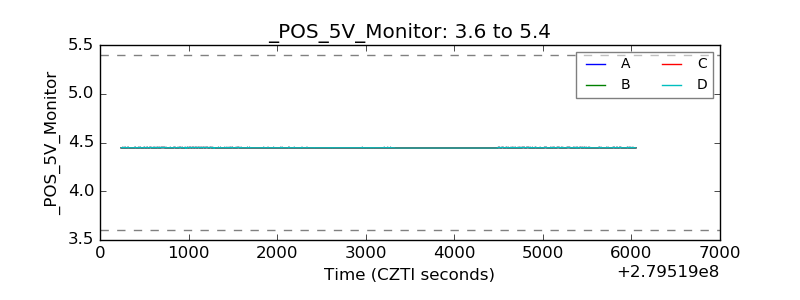 |
| _ROLL_ROT | 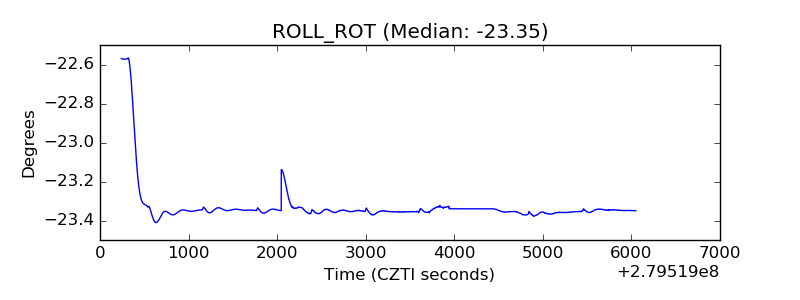 |
| _Roll_DEC |  |
| _Roll_RA | 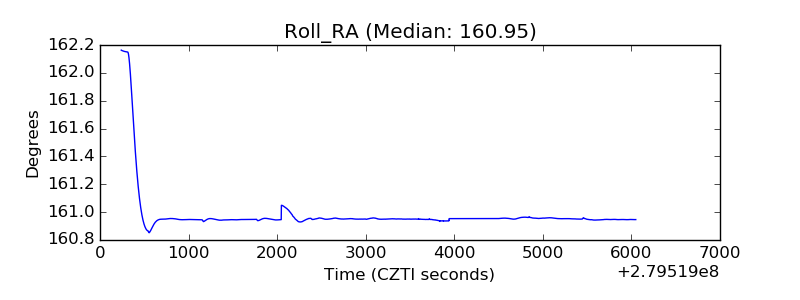 |
| Veto Counter | 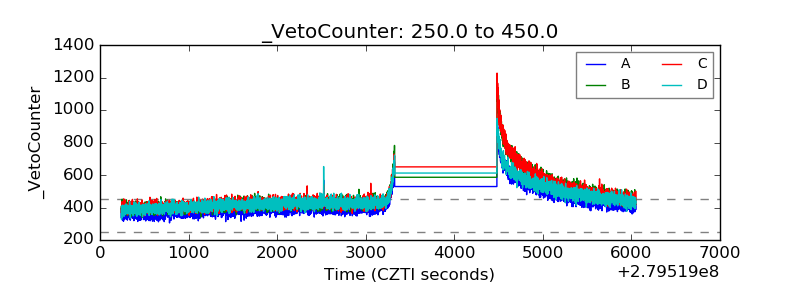 |