| Param | Original file | Final file |
|---|---|---|
| Filename | modeM0/AS1A05_056T01_9000002540_17128cztM0_level2.evt | modeM0/AS1A05_056T01_9000002540_17128cztM0_level2_quad_clean.evt |
| Size (bytes) | 682,050,240 | 96,281,280 |
| Size | 650.5 MB | 91.8 MB |
| Events in quadrant A | 4,281,605 | 595,074 |
| Events in quadrant B | 4,321,709 | 603,117 |
| Events in quadrant C | 5,441,435 | 565,668 |
| Events in quadrant D | 6,030,355 | 556,300 |
| Mode M0 | |||
|---|---|---|---|
| Quadrant | BADHDUFLAG | Total packets | Discarded packets |
| A | 0 | 18546 | 2 |
| B | 0 | 18424 | 2 |
| C | 0 | 21698 | 2 |
| D | 0 | 23750 | 2 |
| Mode M9 | |||
|---|---|---|---|
| Quadrant | BADHDUFLAG | Total packets | Discarded packets |
| A | 0 | 3 | 0 |
| B | 0 | 3 | 0 |
| C | 0 | 3 | 0 |
| D | 0 | 3 | 0 |
| Mode SS | |||
|---|---|---|---|
| Quadrant | BADHDUFLAG | Total packets | Discarded packets |
| A | 0 | 174 | 0 |
| B | 0 | 174 | 0 |
| C | 0 | 174 | 0 |
| D | 0 | 174 | 0 |
| Quadrant | Total seconds | Saturated seconds | Saturation percentage |
|---|---|---|---|
| A | 8570 | 506 | 5.904317% |
| B | 8570 | 558 | 6.511085% |
| C | 8570 | 633 | 7.386231% |
| D | 8571 | 846 | 9.870494% |
Noise dominated data is calculated using 1-second bins in cleaned event files. If a bin has >2000 counts, and if more than 50% of those come from <1% of pixels, then it is considered to be noise-dominated and hence unusable.
| Quadrant | # 1 sec bins | Bins with >0 counts | Bins with >2000 counts | High rate bins dominated by noise | Noise dominated (total time) | Noise dominated (detector-on time) | Marked lightcurve |
|---|---|---|---|---|---|---|---|
| A | 8790 | 8570 | 0 | 0 | 0.00% | 0.00% | 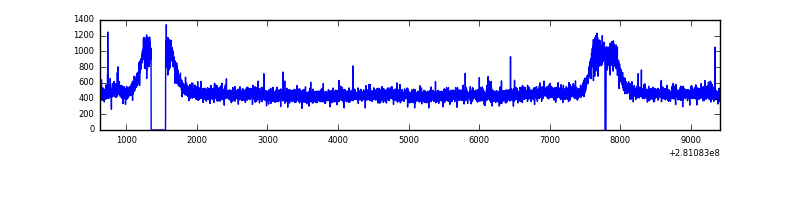 |
| B | 8790 | 8571 | 0 | 0 | 0.00% | 0.00% | 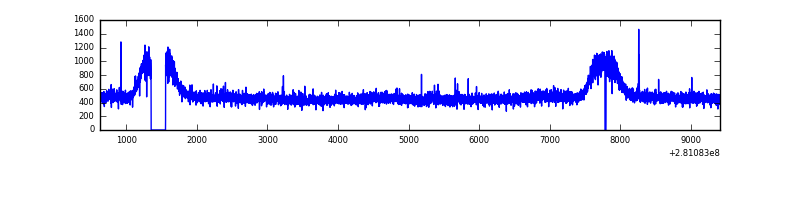 |
| C | 8790 | 8571 | 3 | 3 | 0.03% | 0.04% | 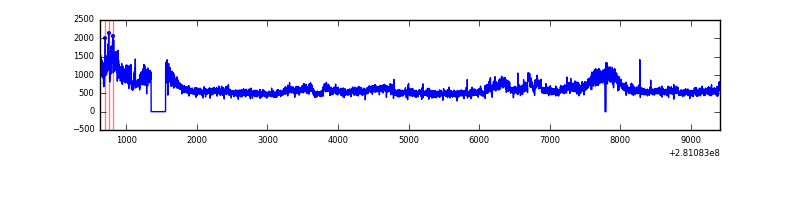 |
| D | 8791 | 8571 | 360 | 360 | 4.10% | 4.20% | 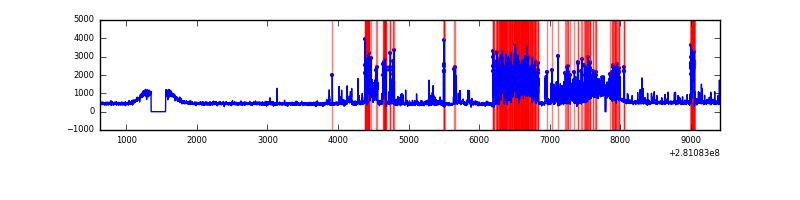 |
Top three noisy pixels from each quadrant. If the there are fewer than three noisy pixels in the level2.evt file, extra rows are filled as -1
| Pixel properties | Quadrant properties | ||||||
|---|---|---|---|---|---|---|---|
| Quadrant | DetID | PixID | Counts | Sigma | Mean | Median | Sigma |
| A | 12 | 189 | 21438 | 89.43 | 1105 | 1080 | 227.6 |
| A | 4 | 2 | 11086 | 43.95 | 1105 | 1080 | 227.6 |
| A | 0 | 226 | 9441 | 36.73 | 1105 | 1080 | 227.6 |
| B | 12 | 111 | 27709 | 121.68 | 1099 | 1069 | 218.9 |
| B | 11 | 111 | 24120 | 105.29 | 1099 | 1069 | 218.9 |
| B | 14 | 111 | 21177 | 91.84 | 1099 | 1069 | 218.9 |
| C | 3 | 233 | 1116255 | 4399.59 | 1060 | 1065 | 253.5 |
| C | 14 | 238 | 156144 | 611.81 | 1060 | 1065 | 253.5 |
| C | 8 | 128 | 15702 | 57.75 | 1060 | 1065 | 253.5 |
| D | 5 | 222 | 1993328 | 7535.46 | 1068 | 1038 | 264.4 |
| D | 2 | 234 | 29669 | 108.29 | 1068 | 1038 | 264.4 |
| D | 7 | 38 | 20324 | 72.94 | 1068 | 1038 | 264.4 |
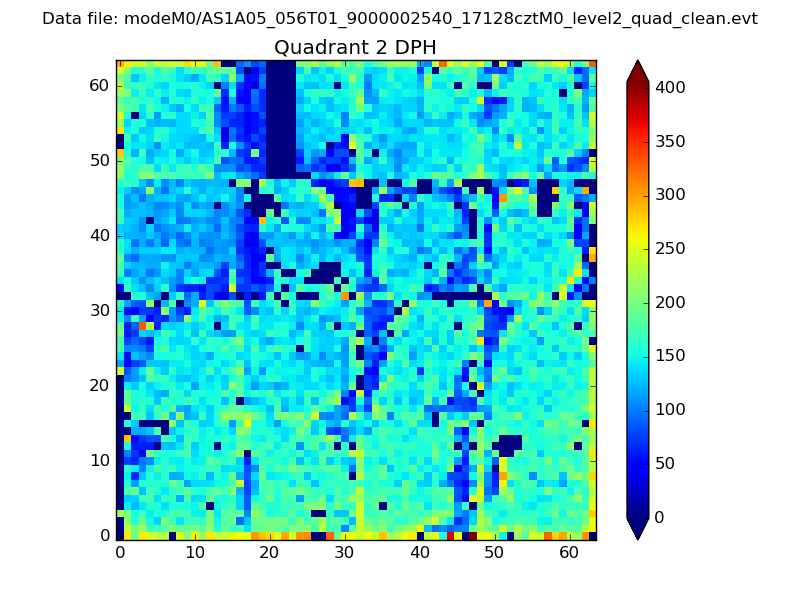
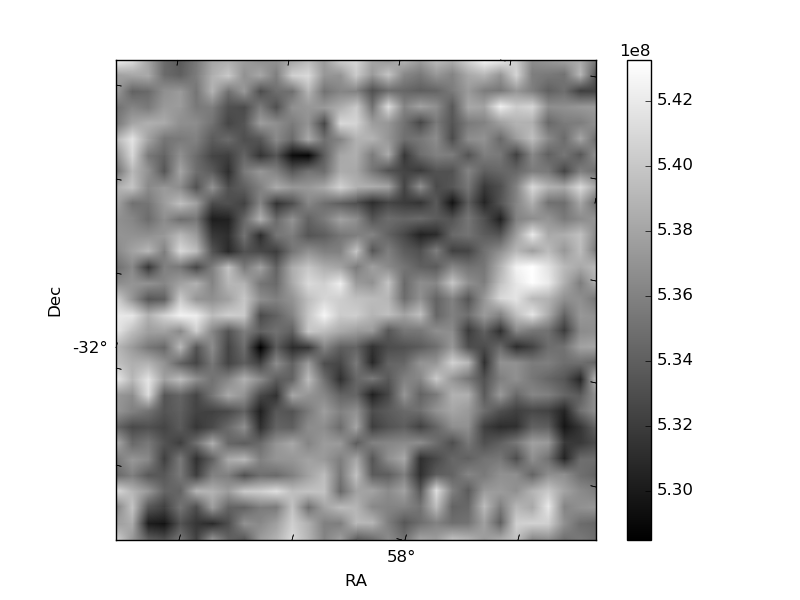
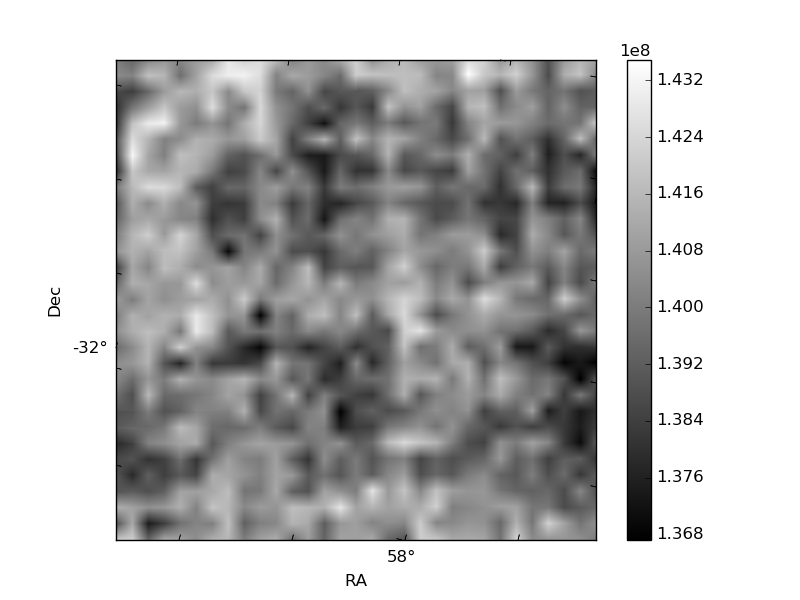
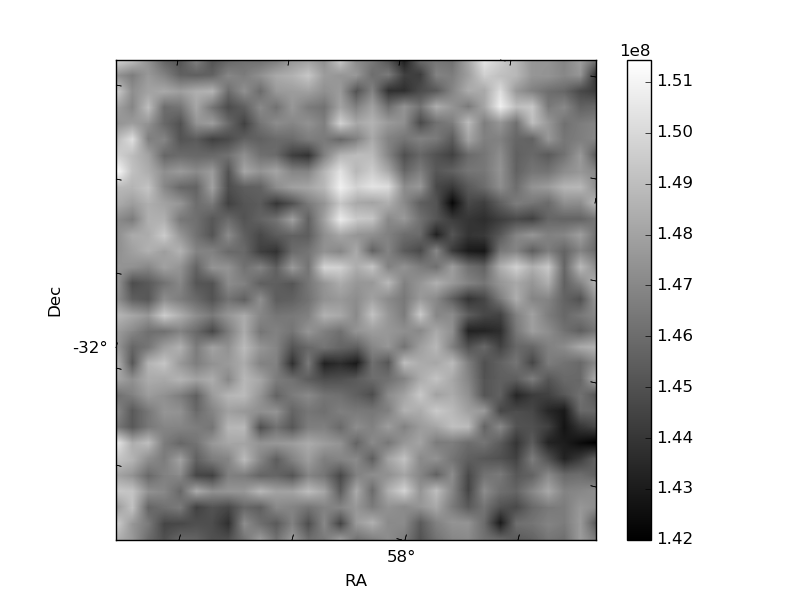
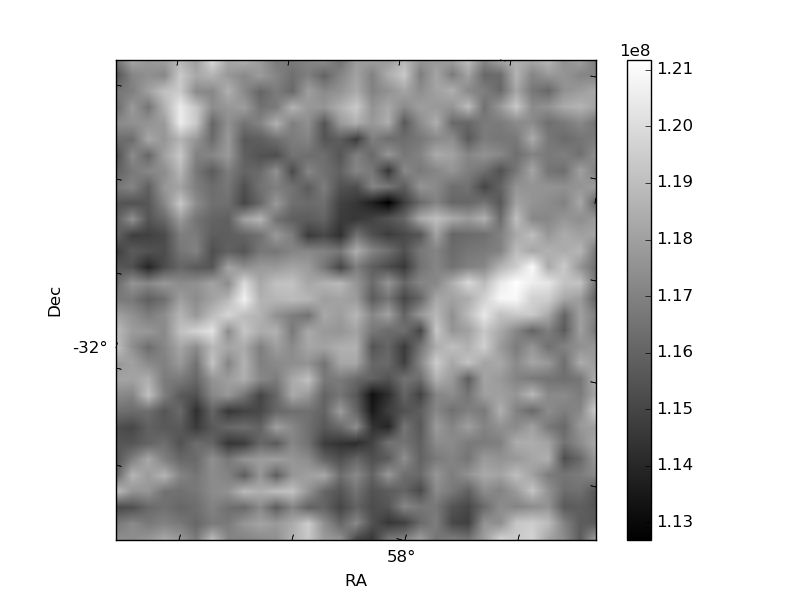
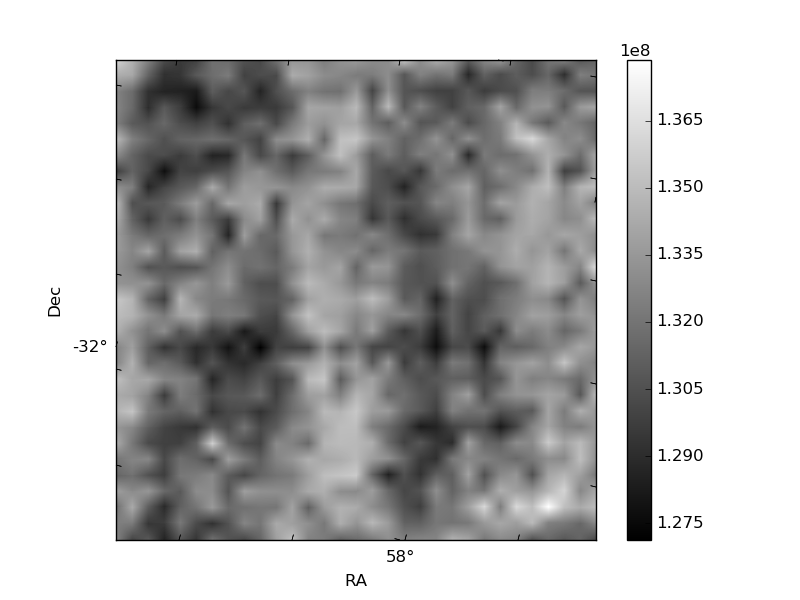
Histogram calculated using DETX and DETY for each event in the final _common_clean file
| Quadrant A | 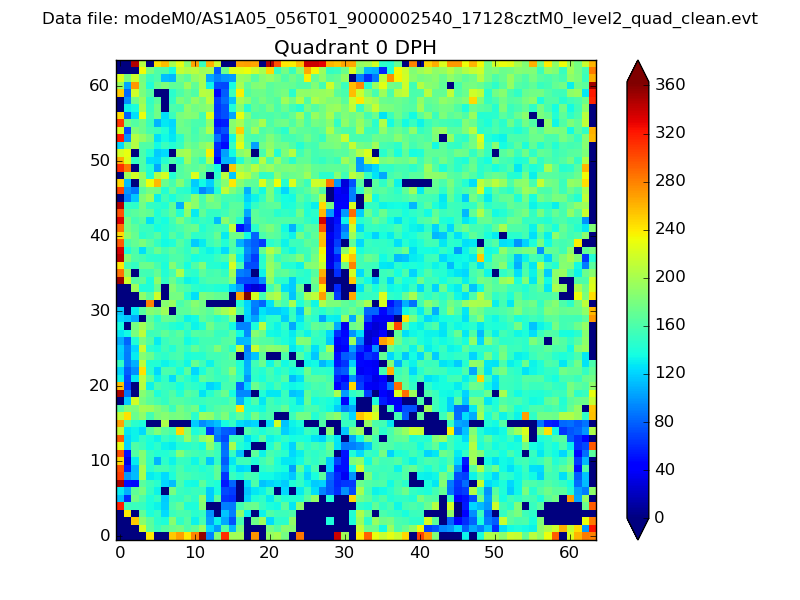 |
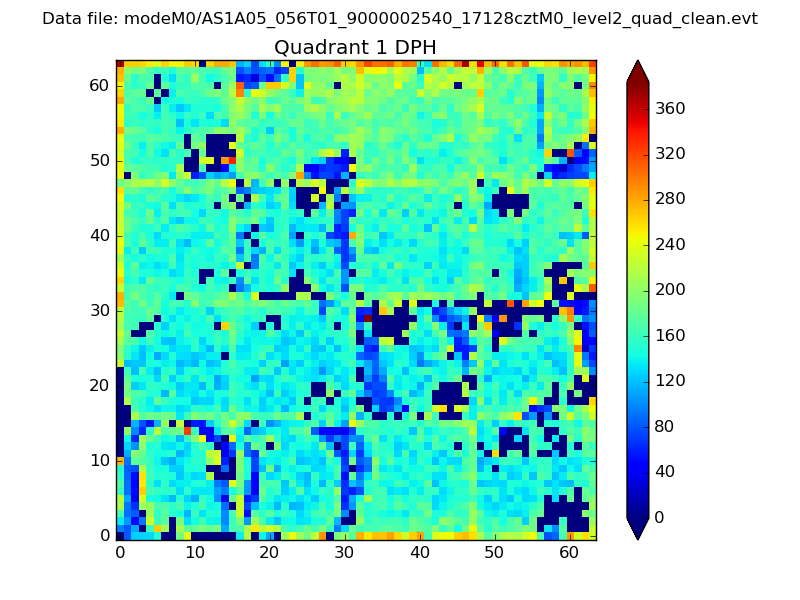 |
Quadrant B |
|---|---|---|---|
| Quadrant D | 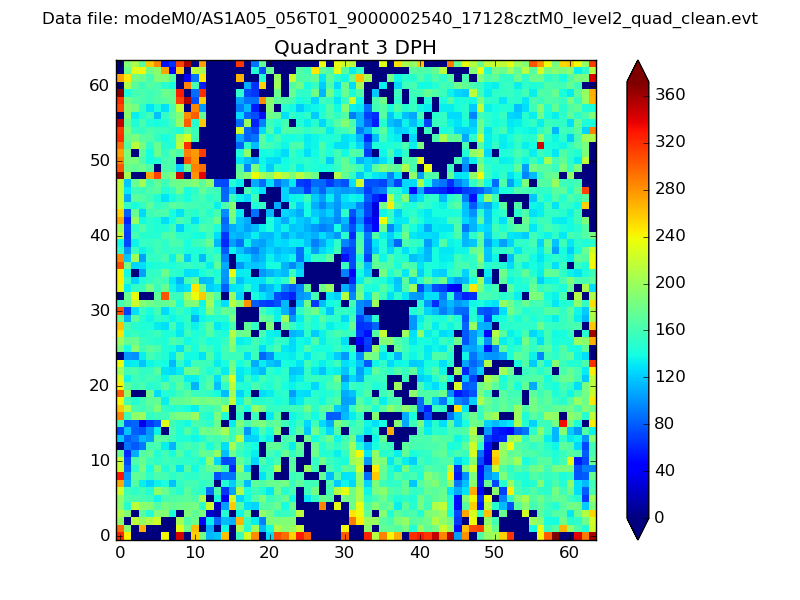 |
 |
Quadrant C |
| Plot type | Count rate plots | Images |
|---|---|---|
| Comparison with Poisson distribution Blue bars denote a histogram of data divided into 1 sec bins. Red curve is a Poisson curve with rate = median count rate of data. |
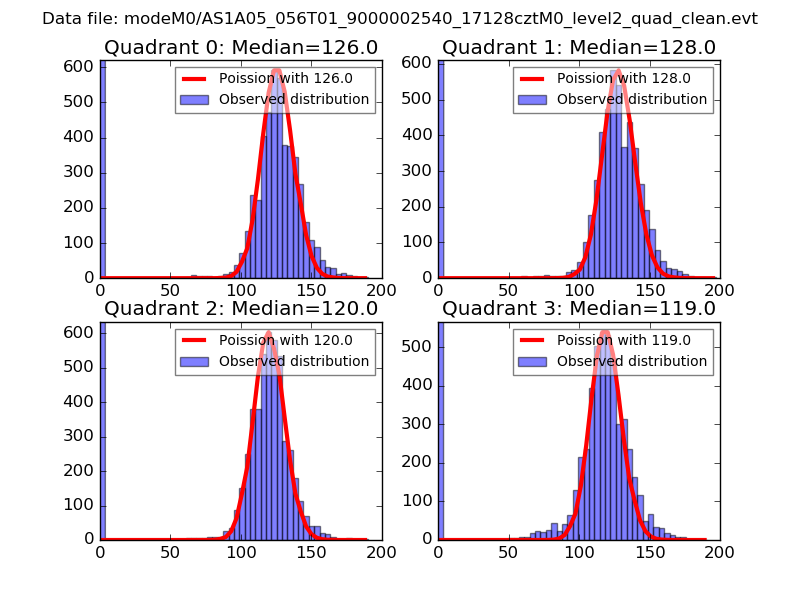 |
 |
| Quadrant-wise count rates Data is divided into 100 sec bins |
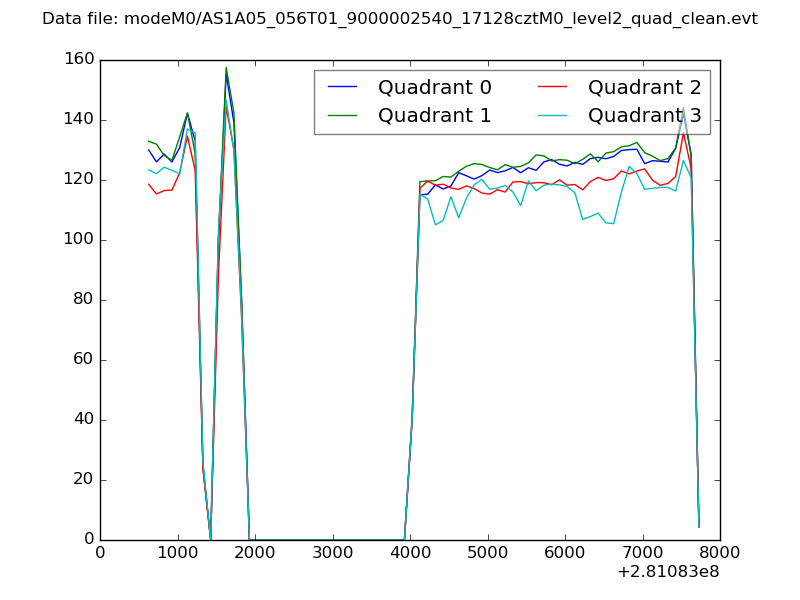 |
|
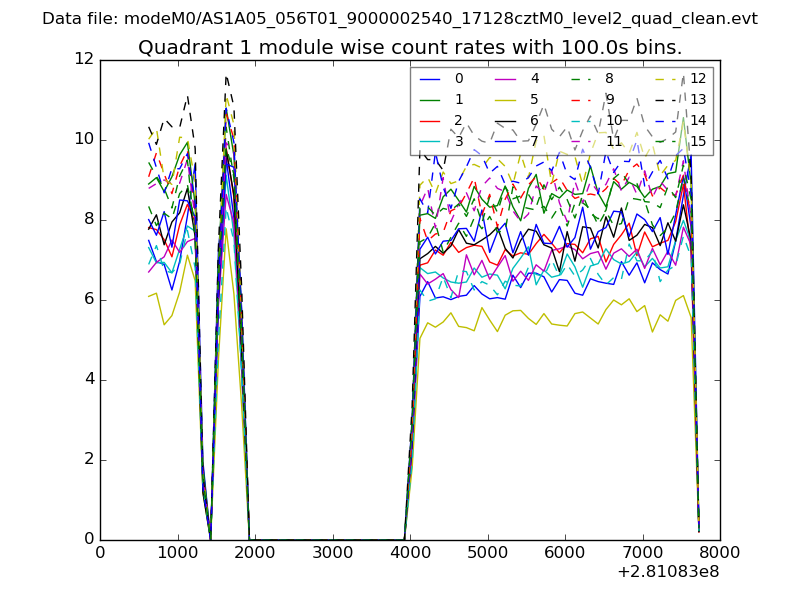
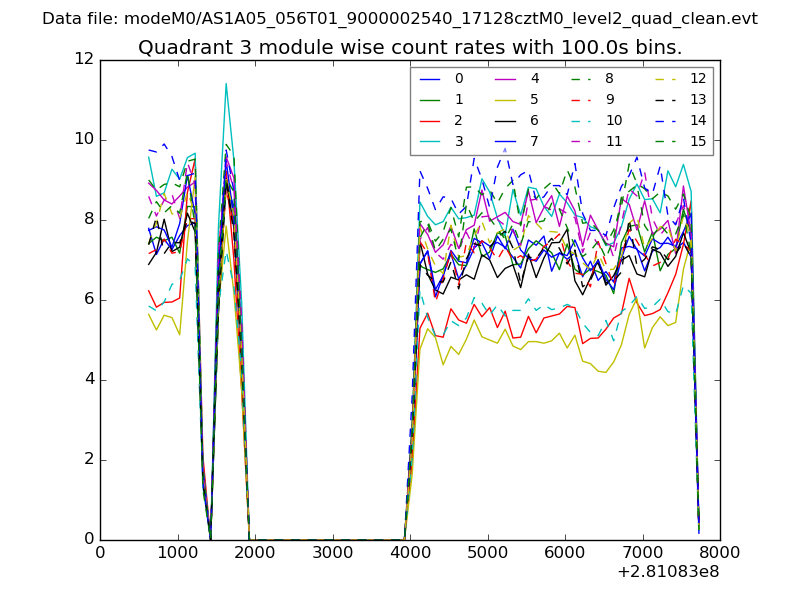
| Module-wise count rates for Quadrant A Data is divided into 100 sec bins |
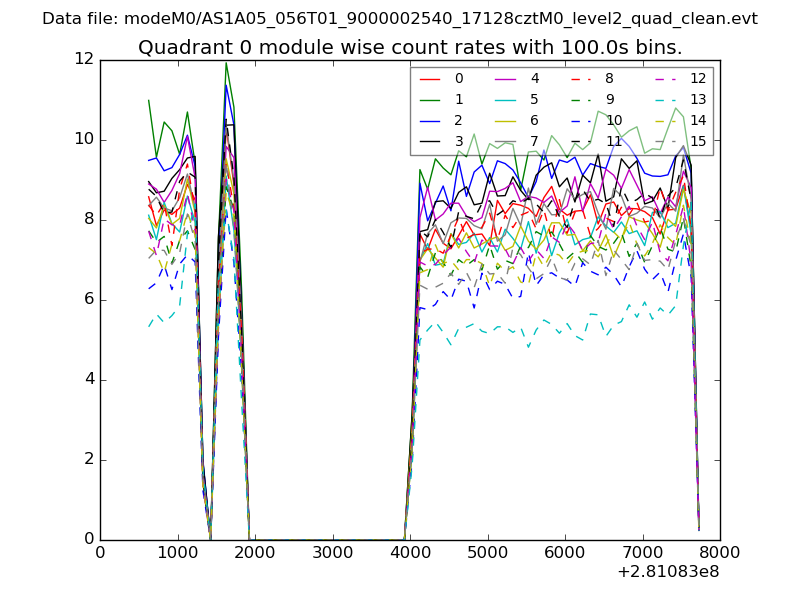 |
 |
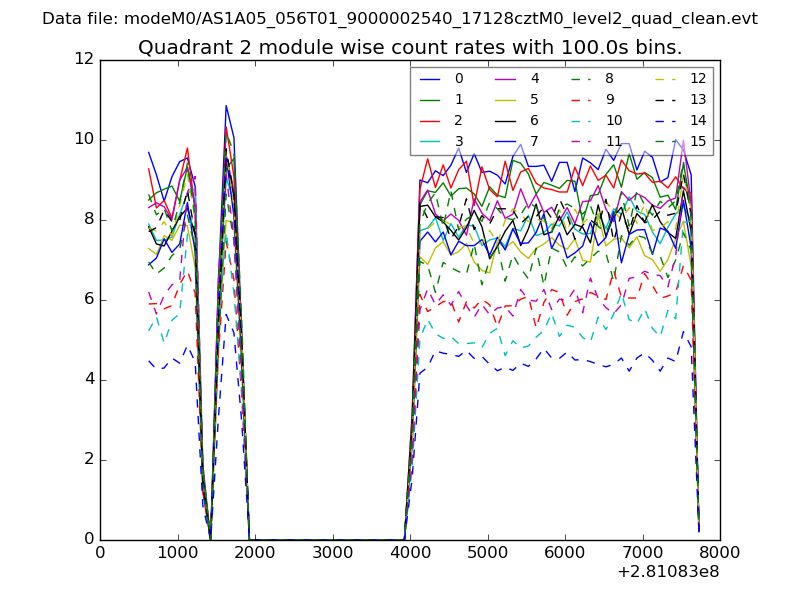
| Module-wise count rates for Quadrant B Data is divided into 100 sec bins |
 |
 |
| Module-wise count rates for Quadrant C Data is divided into 100 sec bins |
 |
 |
| Module-wise count rates for Quadrant D Data is divided into 100 sec bins |
 |
 |
| Parameter | Plot |
|---|---|
| CZT HV Monitor | 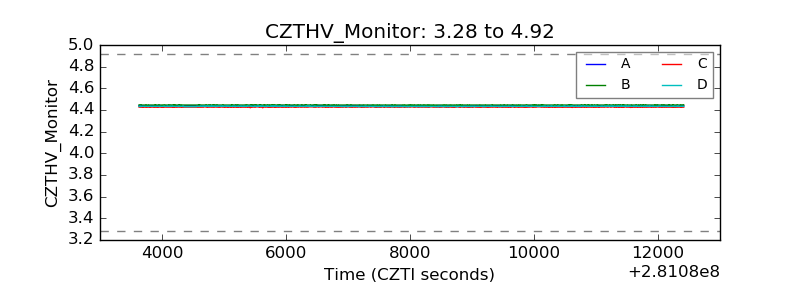 |
| D_VDD | 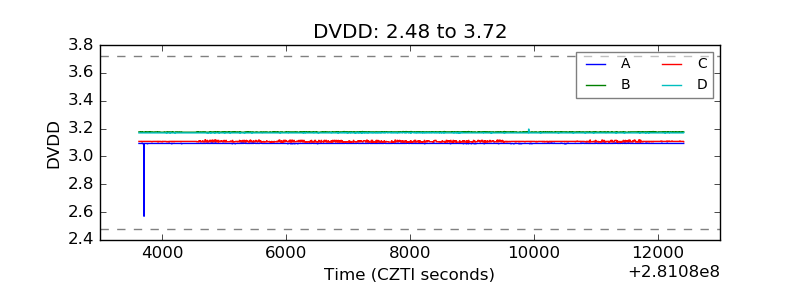 |
| Temperature 1 | 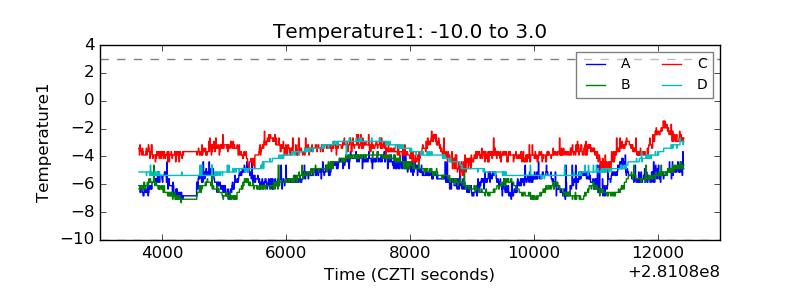 |
| Veto HV Monitor | 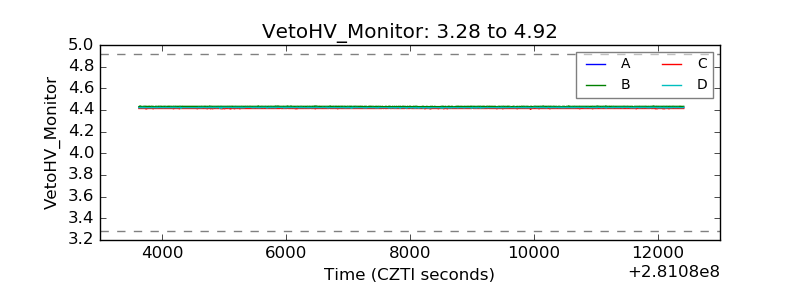 |
| Veto LLD | 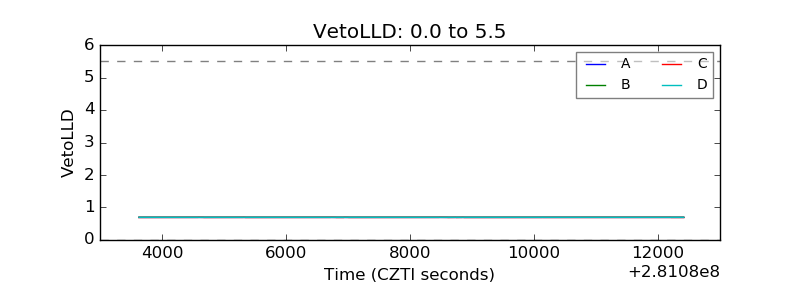 |
| Alpha Counter | 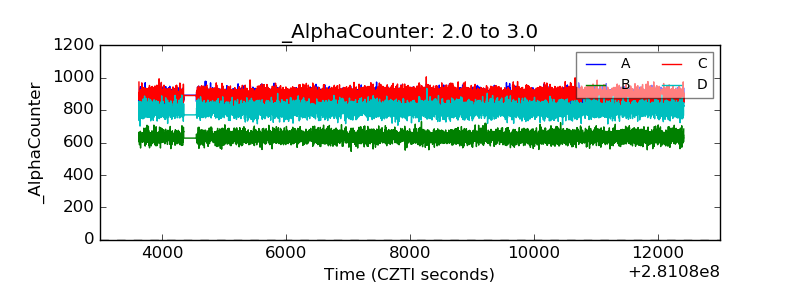 |
| _CPM_Rate | 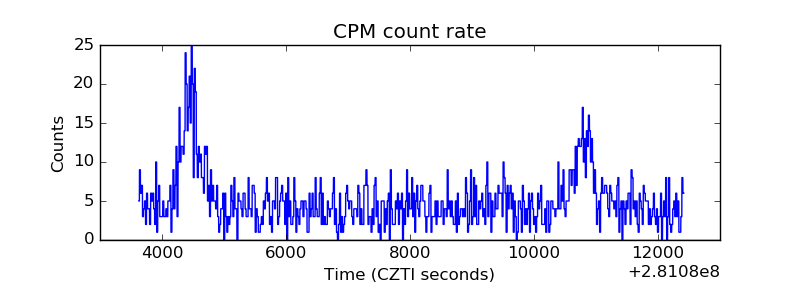 |
| CZT Counter | 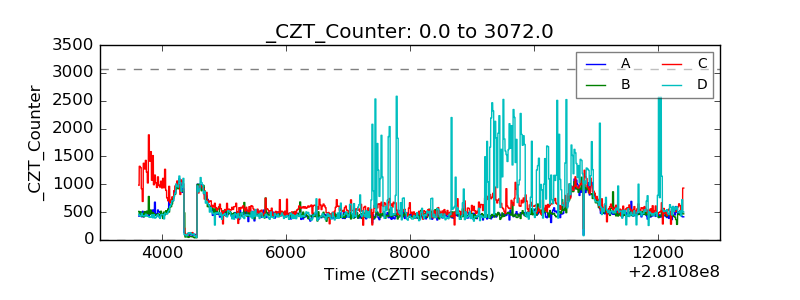 |
| +2.5 Volts monitor |  |
| +5 Volts monitor |  |
| _ROLL_ROT | 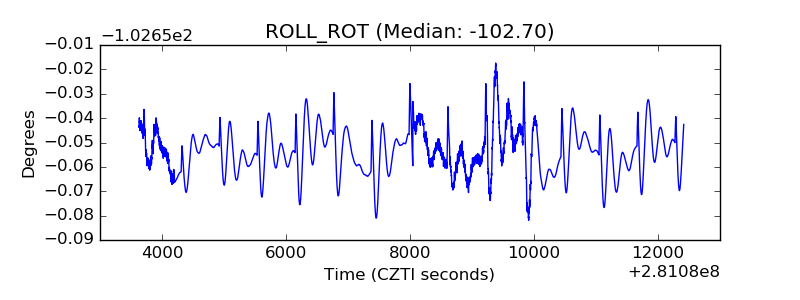 |
| _Roll_DEC | 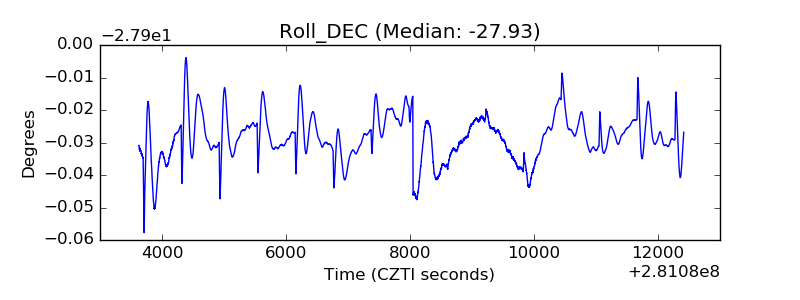 |
| _Roll_RA | 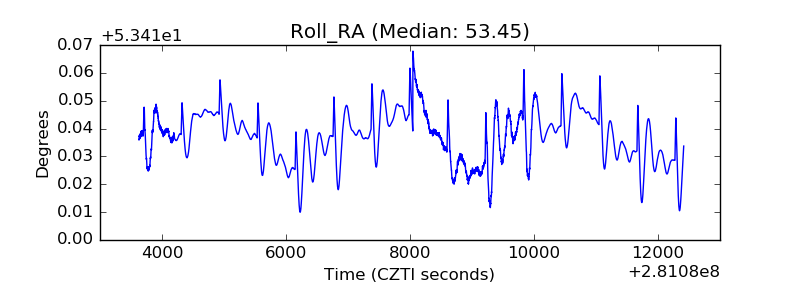 |
| Veto Counter | 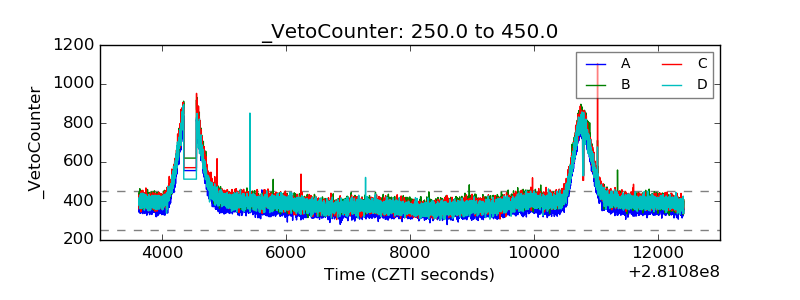 |