| Param | Original file | Final file |
|---|---|---|
| Filename | modeM0/AS1T03_059T01_9000002546_17158cztM0_level2.evt | modeM0/AS1T03_059T01_9000002546_17158cztM0_level2_quad_clean.evt |
| Size (bytes) | 365,754,240 | 71,781,120 |
| Size | 348.8 MB | 68.5 MB |
| Events in quadrant A | 2,691,368 | 447,793 |
| Events in quadrant B | 2,697,023 | 453,426 |
| Events in quadrant C | 2,739,889 | 431,481 |
| Events in quadrant D | 2,550,158 | 432,083 |
| Mode M0 | |||
|---|---|---|---|
| Quadrant | BADHDUFLAG | Total packets | Discarded packets |
| A | 0 | 12013 | 0 |
| B | 0 | 11942 | 0 |
| C | 0 | 11966 | 2 |
| D | 0 | 11898 | 0 |
| Mode SS | |||
|---|---|---|---|
| Quadrant | BADHDUFLAG | Total packets | Discarded packets |
| A | 0 | 116 | 0 |
| B | 0 | 116 | 0 |
| C | 0 | 116 | 0 |
| D | 0 | 116 | 0 |
| Quadrant | Total seconds | Saturated seconds | Saturation percentage |
|---|---|---|---|
| A | 5851 | 31 | 0.529824% |
| B | 5852 | 39 | 0.666439% |
| C | 5851 | 59 | 1.008375% |
| D | 5851 | 14 | 0.239275% |
Noise dominated data is calculated using 1-second bins in cleaned event files. If a bin has >2000 counts, and if more than 50% of those come from <1% of pixels, then it is considered to be noise-dominated and hence unusable.
| Quadrant | # 1 sec bins | Bins with >0 counts | Bins with >2000 counts | High rate bins dominated by noise | Noise dominated (total time) | Noise dominated (detector-on time) | Marked lightcurve |
|---|---|---|---|---|---|---|---|
| A | 5851 | 5851 | 0 | 0 | 0.00% | 0.00% | 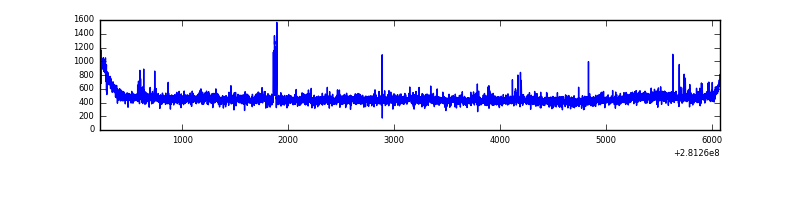 |
| B | 5852 | 5852 | 0 | 0 | 0.00% | 0.00% | 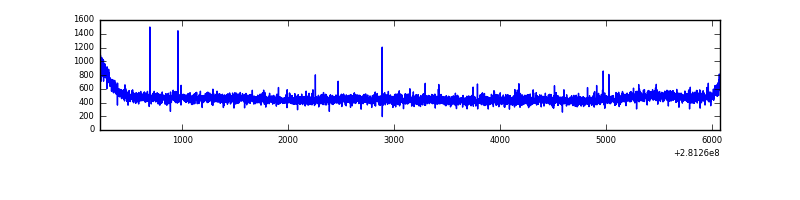 |
| C | 5851 | 5851 | 1 | 1 | 0.02% | 0.02% | 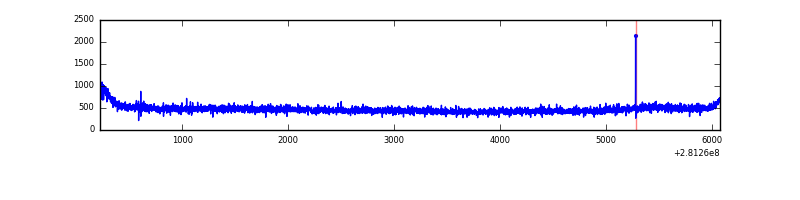 |
| D | 5851 | 5851 | 2 | 2 | 0.03% | 0.03% | 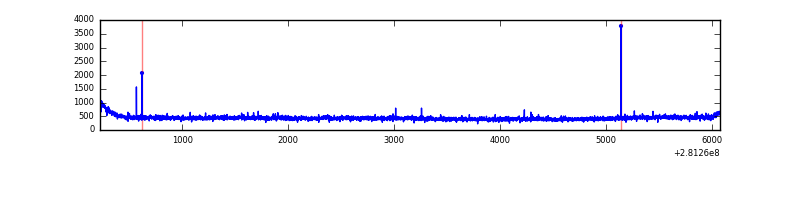 |
Top three noisy pixels from each quadrant. If the there are fewer than three noisy pixels in the level2.evt file, extra rows are filled as -1
| Pixel properties | Quadrant properties | ||||||
|---|---|---|---|---|---|---|---|
| Quadrant | DetID | PixID | Counts | Sigma | Mean | Median | Sigma |
| A | 12 | 189 | 27156 | 189.71 | 688 | 672 | 139.6 |
| A | 12 | 96 | 21391 | 148.41 | 688 | 672 | 139.6 |
| A | 0 | 226 | 5855 | 37.13 | 688 | 672 | 139.6 |
| B | 12 | 111 | 16674 | 118.27 | 690 | 672 | 135.3 |
| B | 11 | 111 | 14403 | 101.49 | 690 | 672 | 135.3 |
| B | 14 | 111 | 12530 | 87.64 | 690 | 672 | 135.3 |
| C | 14 | 238 | 100696 | 638.83 | 662 | 667 | 156.6 |
| C | 3 | 233 | 54386 | 343.07 | 662 | 667 | 156.6 |
| C | 13 | 61 | 4692 | 25.71 | 662 | 667 | 156.6 |
| D | 2 | 234 | 24787 | 148.36 | 669 | 649 | 162.7 |
| D | 2 | 152 | 12363 | 72.0 | 669 | 649 | 162.7 |
| D | 12 | 235 | 8214 | 46.49 | 669 | 649 | 162.7 |
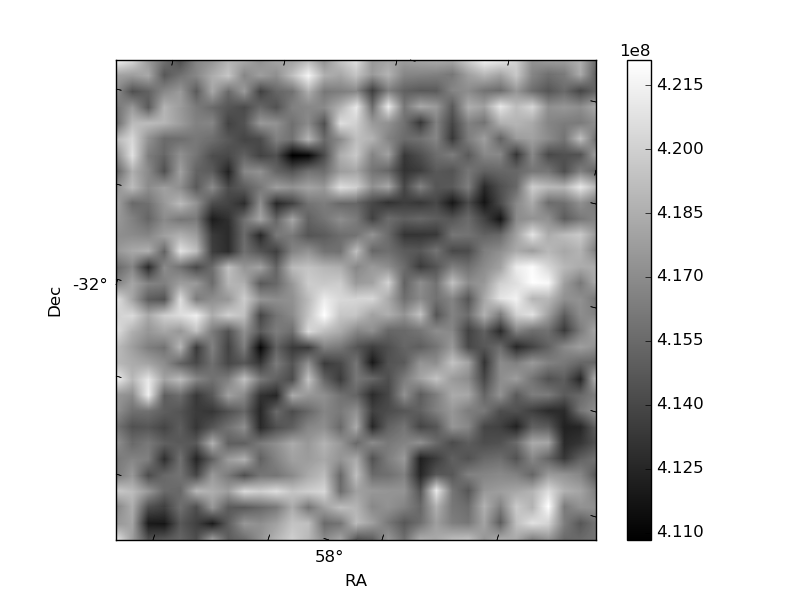
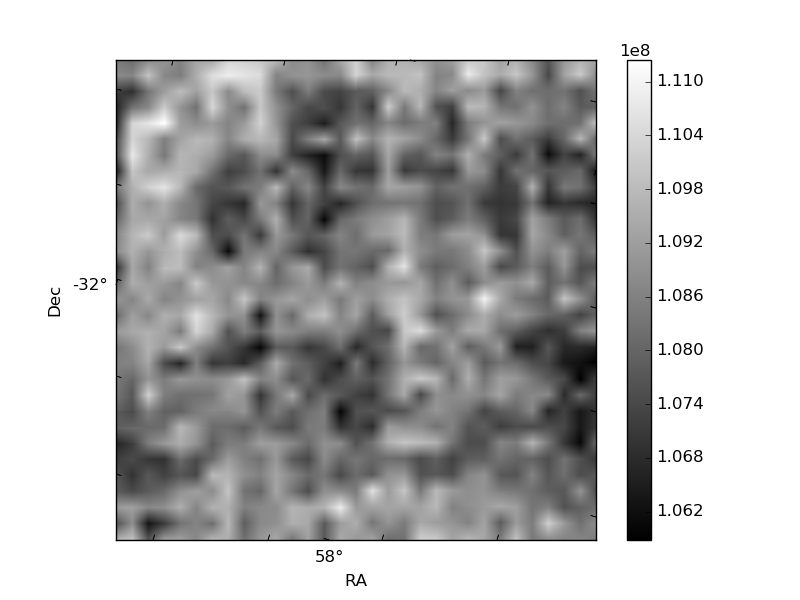
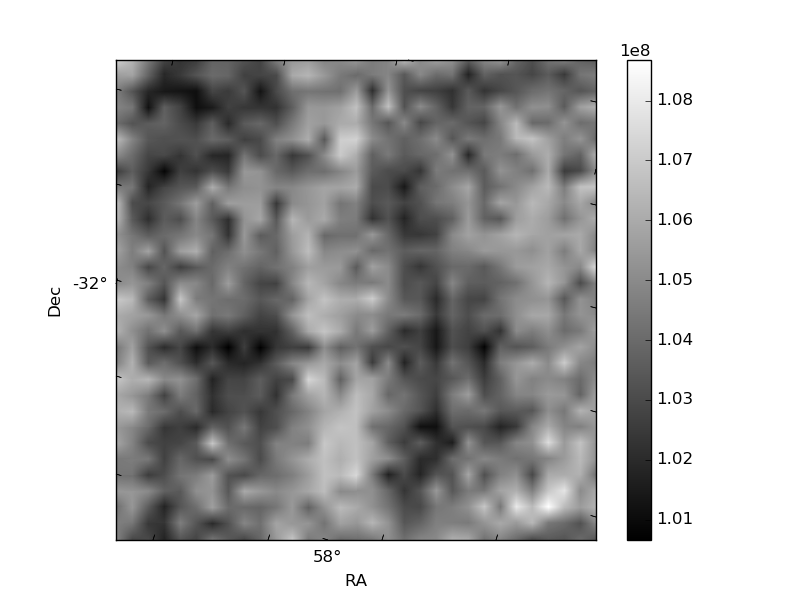
Histogram calculated using DETX and DETY for each event in the final _common_clean file
| Quadrant A | 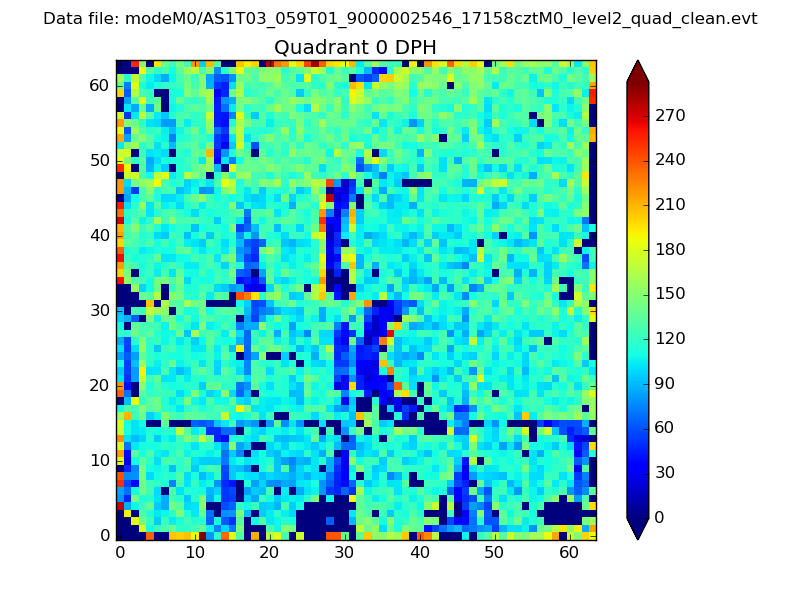 |
 |
Quadrant B |
|---|---|---|---|
| Quadrant D | 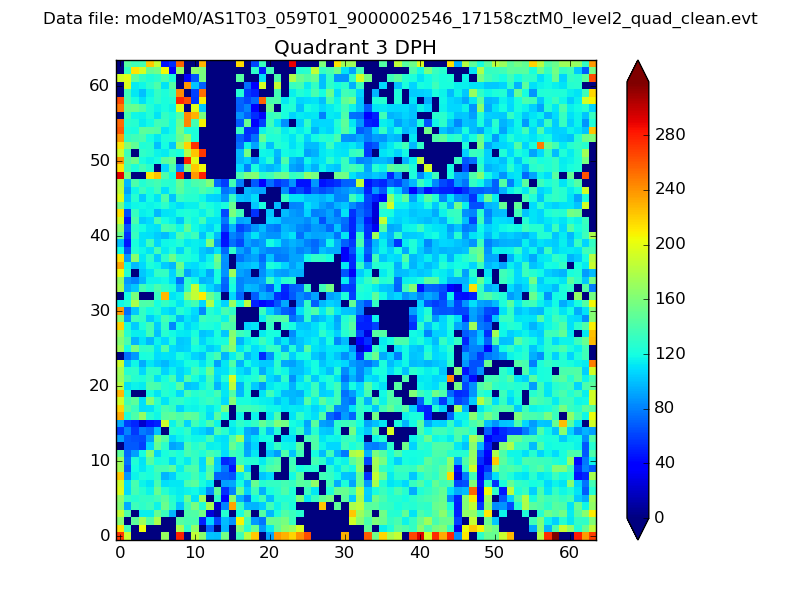 |
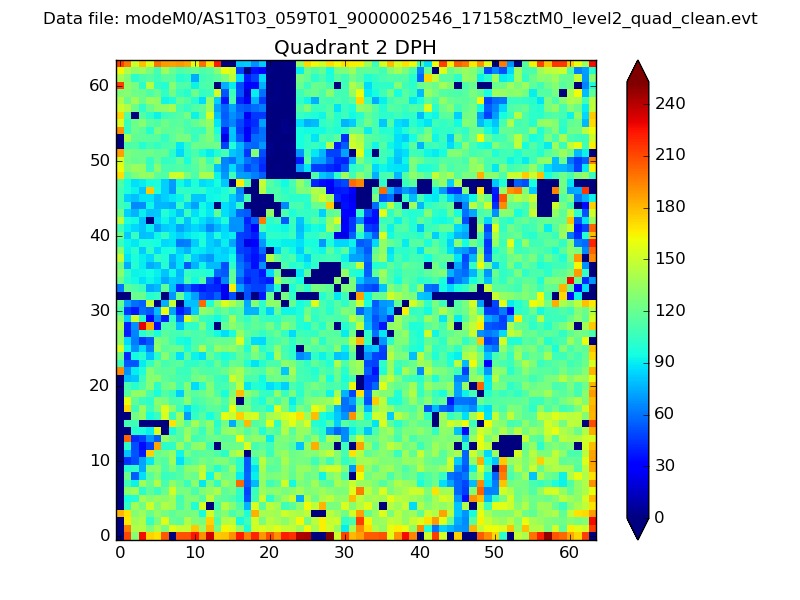 |
Quadrant C |
| Plot type | Count rate plots | Images |
|---|---|---|
| Comparison with Poisson distribution Blue bars denote a histogram of data divided into 1 sec bins. Red curve is a Poisson curve with rate = median count rate of data. |
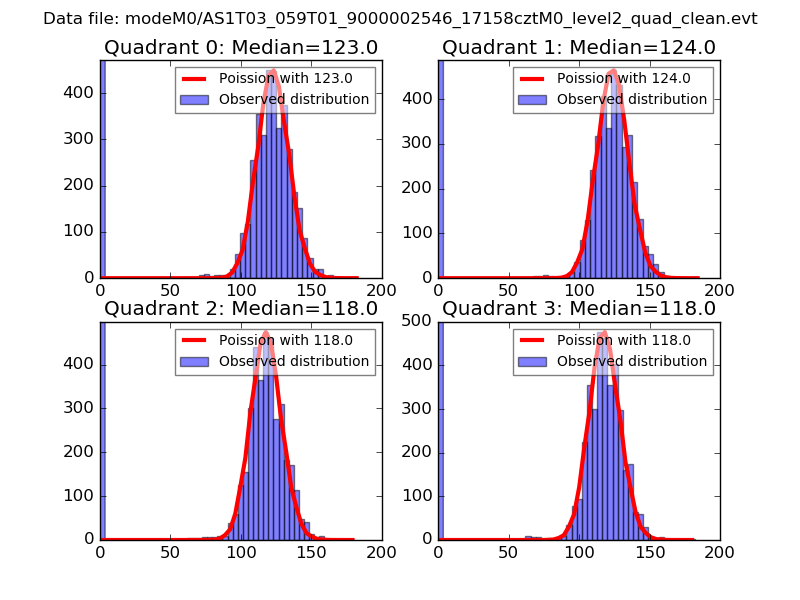 |
 |
| Quadrant-wise count rates Data is divided into 100 sec bins |
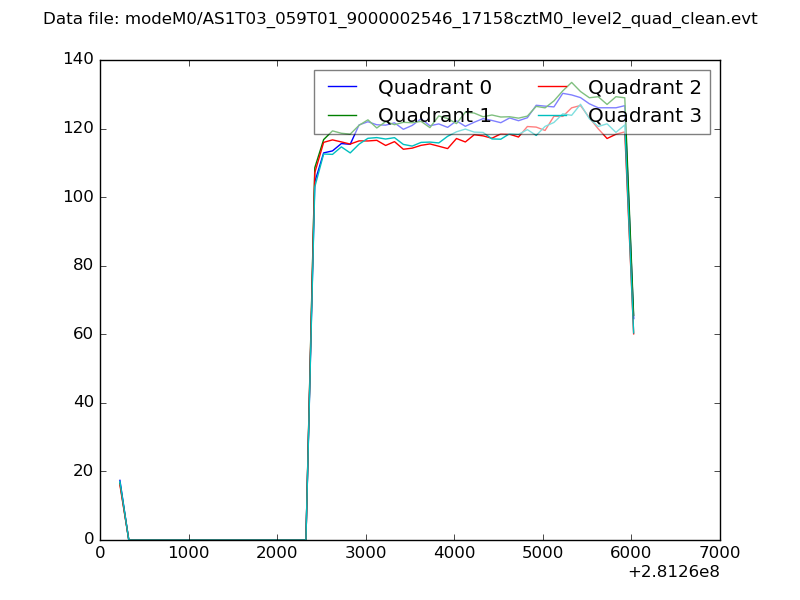 |
|
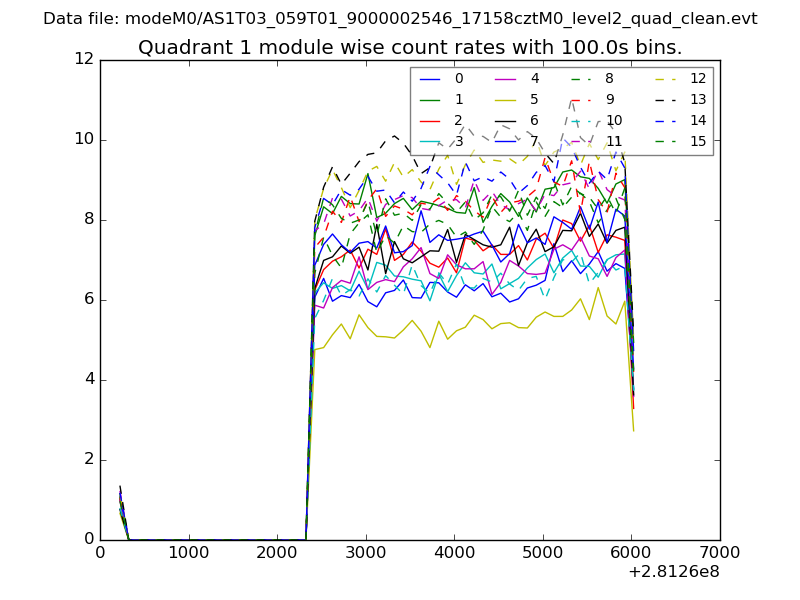
| Module-wise count rates for Quadrant A Data is divided into 100 sec bins |
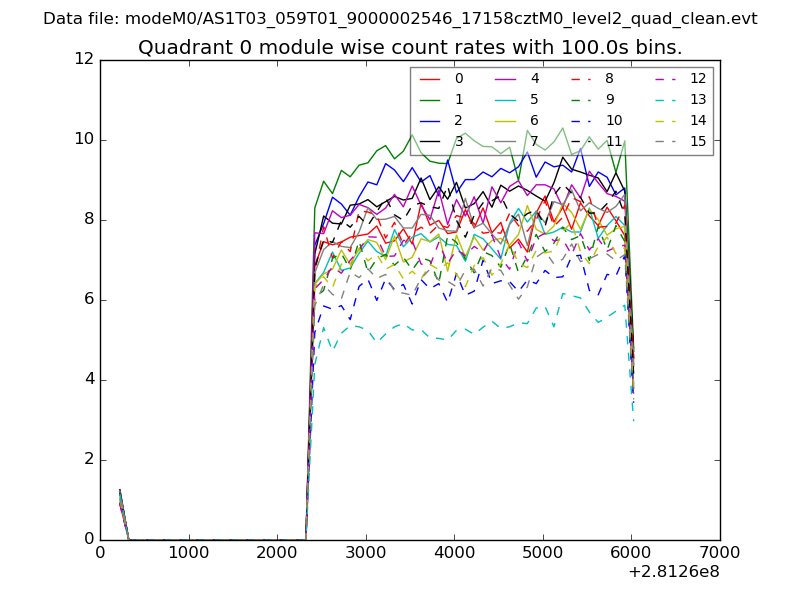 |
 |
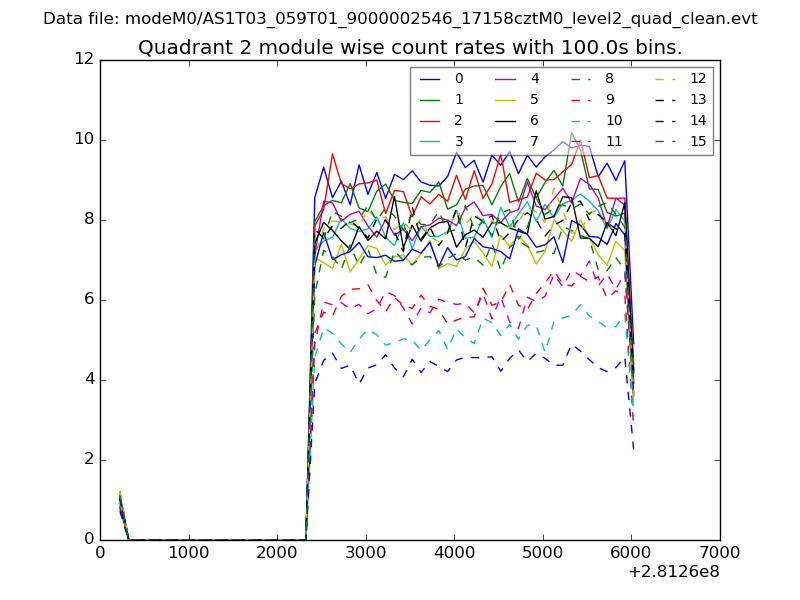
| Module-wise count rates for Quadrant B Data is divided into 100 sec bins |
 |
 |
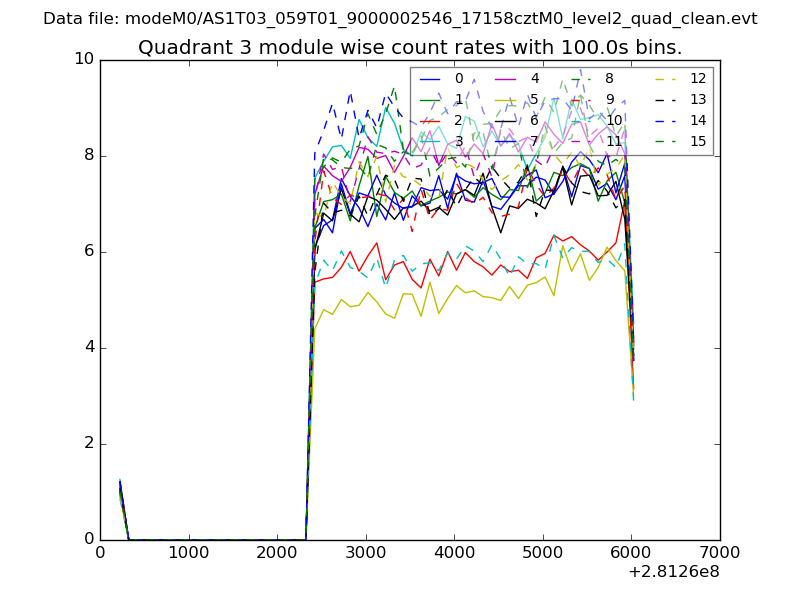
| Module-wise count rates for Quadrant C Data is divided into 100 sec bins |
 |
 |
| Module-wise count rates for Quadrant D Data is divided into 100 sec bins |
 |
 |
| Parameter | Plot |
|---|---|
| CZT HV Monitor | 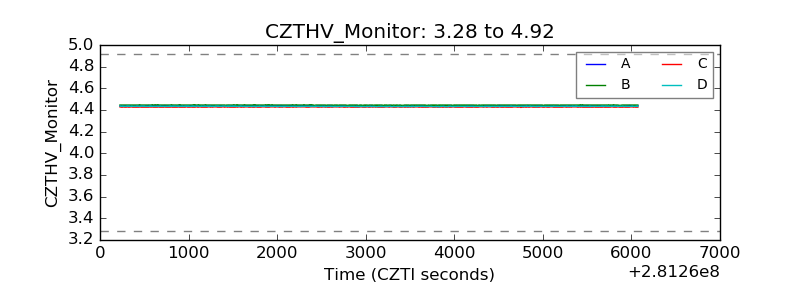 |
| D_VDD | 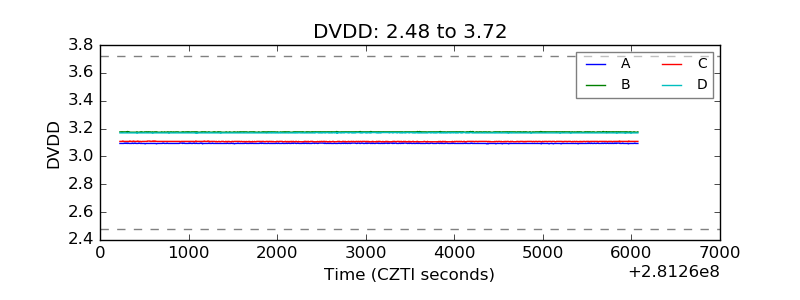 |
| Temperature 1 | 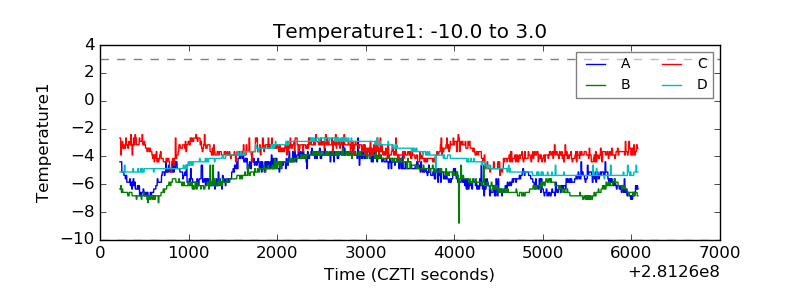 |
| Veto HV Monitor | 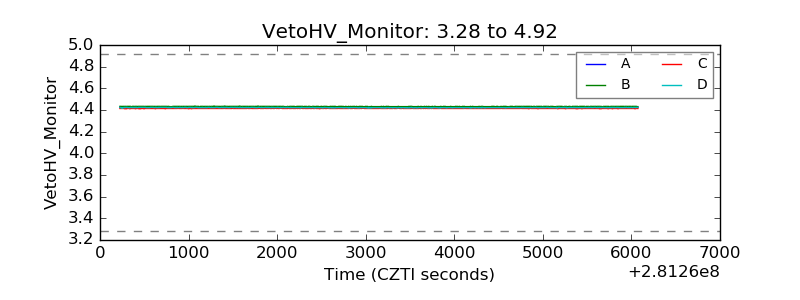 |
| Veto LLD | 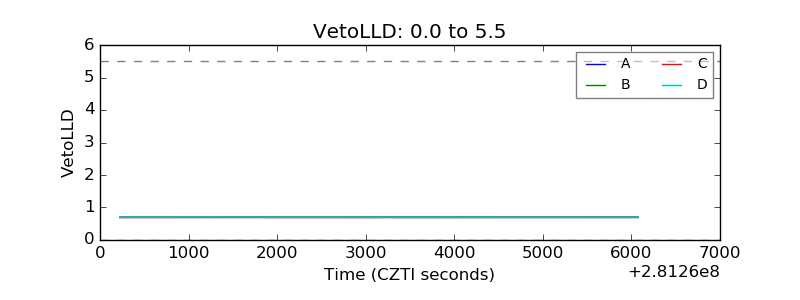 |
| Alpha Counter | 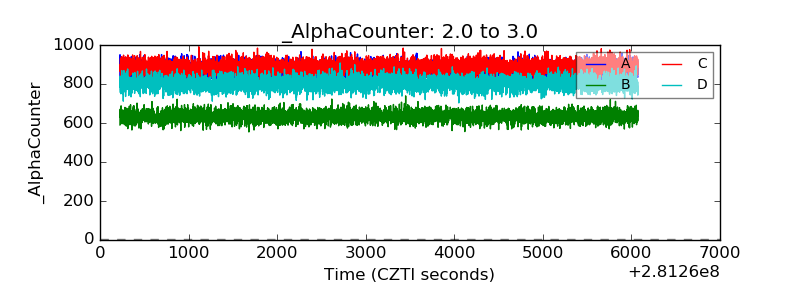 |
| _CPM_Rate |  |
| CZT Counter | 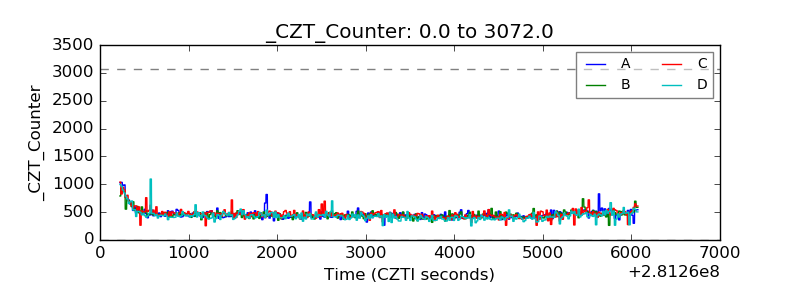 |
| +2.5 Volts monitor | 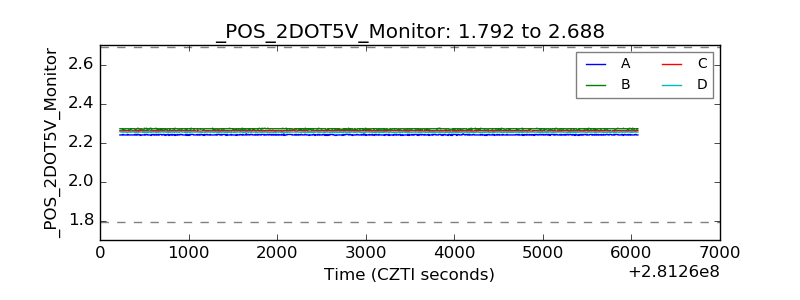 |
| +5 Volts monitor | 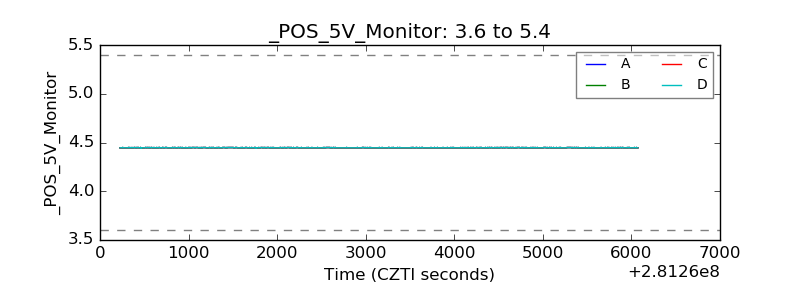 |
| _ROLL_ROT | 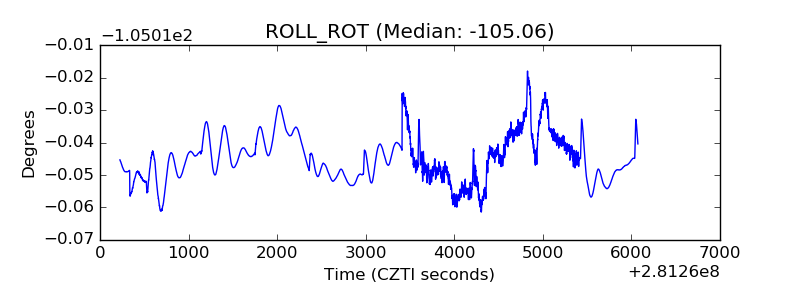 |
| _Roll_DEC | 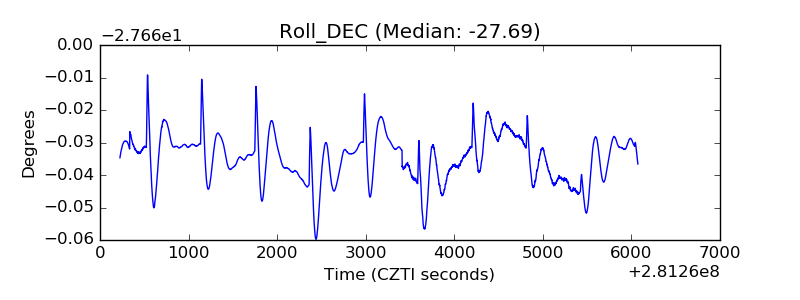 |
| _Roll_RA | 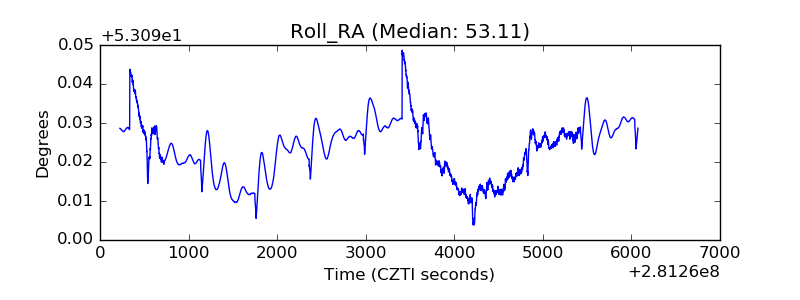 |
| Veto Counter | 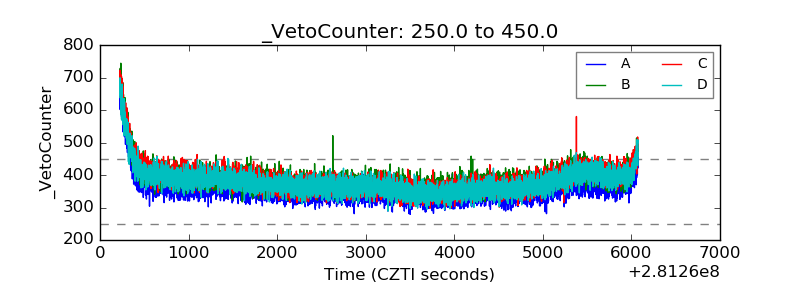 |