| Param | Original file | Final file |
|---|---|---|
| Filename | modeM0/AS1A05_010T02_9000002556_17285cztM0_level2.evt | modeM0/AS1A05_010T02_9000002556_17285cztM0_level2_quad_clean.evt |
| Size (bytes) | 27,573,120 | 4,262,400 |
| Size | 26.3 MB | 4.1 MB |
| Events in quadrant A | 98,099 | 28,540 |
| Events in quadrant B | 105,088 | 28,536 |
| Events in quadrant C | 100,237 | 26,462 |
| Events in quadrant D | 512,099 | 20,243 |
| Mode M0 | |||
|---|---|---|---|
| Quadrant | BADHDUFLAG | Total packets | Discarded packets |
| A | 0 | 472 | 0 |
| B | 0 | 486 | 0 |
| C | 0 | 473 | 0 |
| D | 0 | 1681 | 0 |
| Mode SS | |||
|---|---|---|---|
| Quadrant | BADHDUFLAG | Total packets | Discarded packets |
| A | 0 | 4 | 0 |
| B | 0 | 4 | 0 |
| C | 0 | 4 | 0 |
| D | 0 | 4 | 0 |
| Quadrant | Total seconds | Saturated seconds | Saturation percentage |
|---|---|---|---|
| A | 236 | 0 | 0.000000% |
| B | 236 | 0 | 0.000000% |
| C | 236 | 1 | 0.423729% |
| D | 236 | 129 | 54.661017% |
Noise dominated data is calculated using 1-second bins in cleaned event files. If a bin has >2000 counts, and if more than 50% of those come from <1% of pixels, then it is considered to be noise-dominated and hence unusable.
| Quadrant | # 1 sec bins | Bins with >0 counts | Bins with >2000 counts | High rate bins dominated by noise | Noise dominated (total time) | Noise dominated (detector-on time) | Marked lightcurve |
|---|---|---|---|---|---|---|---|
| A | 236 | 236 | 0 | 0 | 0.00% | 0.00% | 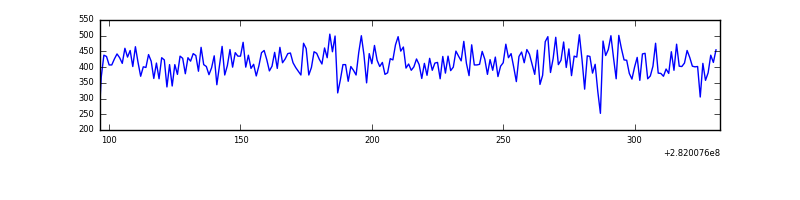 |
| B | 236 | 236 | 0 | 0 | 0.00% | 0.00% | 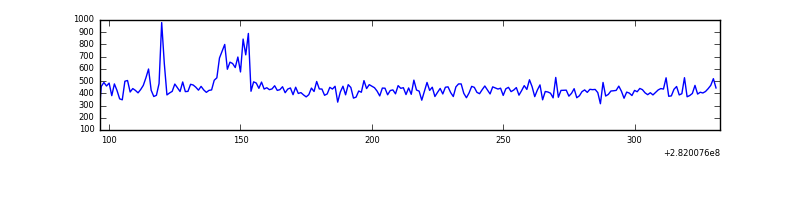 |
| C | 236 | 236 | 0 | 0 | 0.00% | 0.00% | 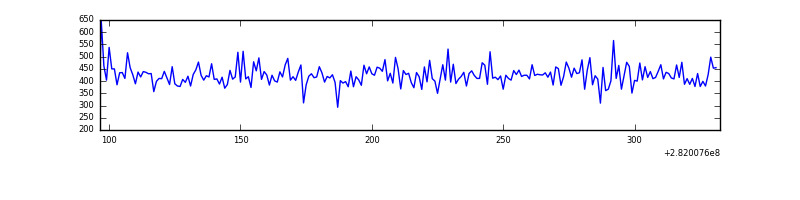 |
| D | 236 | 236 | 151 | 151 | 63.98% | 63.98% | 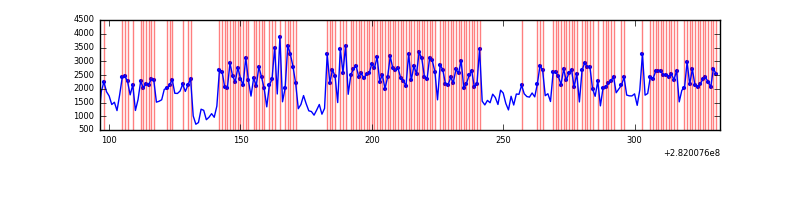 |
Top three noisy pixels from each quadrant. If the there are fewer than three noisy pixels in the level2.evt file, extra rows are filled as -1
| Pixel properties | Quadrant properties | ||||||
|---|---|---|---|---|---|---|---|
| Quadrant | DetID | PixID | Counts | Sigma | Mean | Median | Sigma |
| A | 0 | 226 | 222 | 27.38 | 25 | 24 | 7.2 |
| A | 3 | 137 | 189 | 22.82 | 25 | 24 | 7.2 |
| A | 12 | 194 | 187 | 22.54 | 25 | 24 | 7.2 |
| B | 15 | 201 | 4878 | 683.54 | 25 | 24 | 7.1 |
| B | 12 | 111 | 618 | 83.65 | 25 | 24 | 7.1 |
| B | 11 | 111 | 513 | 68.86 | 25 | 24 | 7.1 |
| C | 14 | 238 | 3673 | 480.2 | 24 | 24 | 7.6 |
| C | 3 | 233 | 1277 | 164.89 | 24 | 24 | 7.6 |
| C | 13 | 61 | 180 | 20.53 | 24 | 24 | 7.6 |
| D | 11 | 176 | 423643 | 61126.54 | 20 | 20 | 6.9 |
| D | 13 | 189 | 3445 | 494.21 | 20 | 20 | 6.9 |
| D | 13 | 232 | 2398 | 343.13 | 20 | 20 | 6.9 |
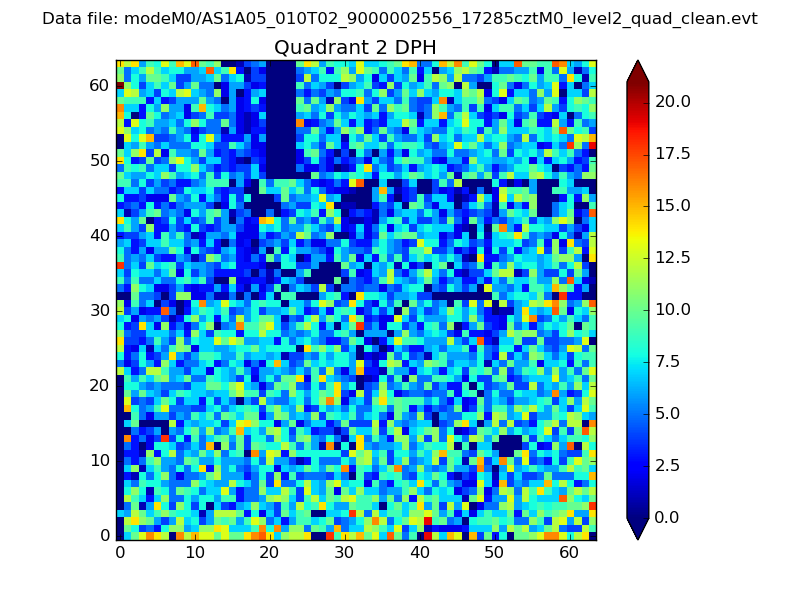
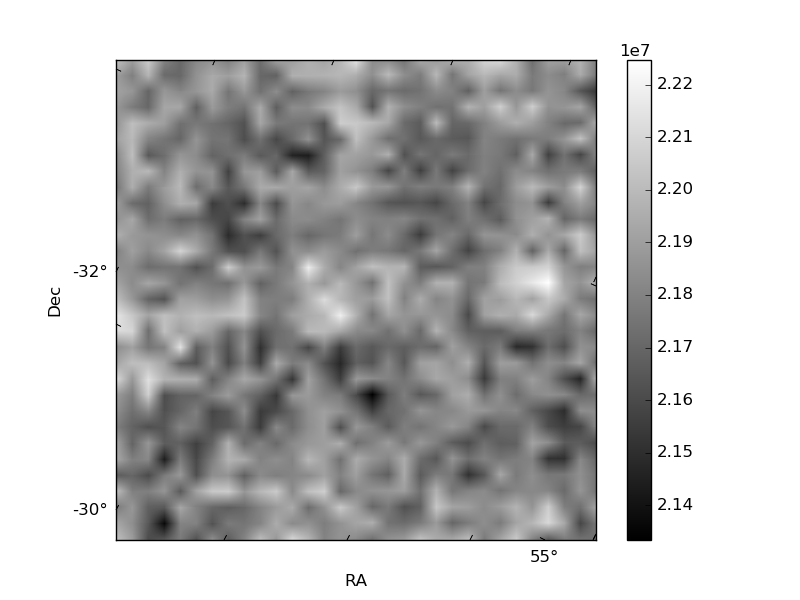
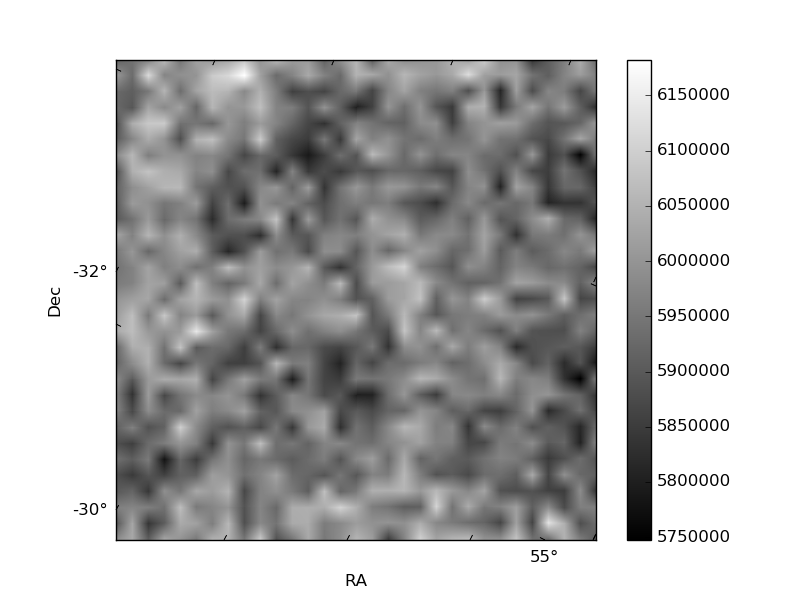
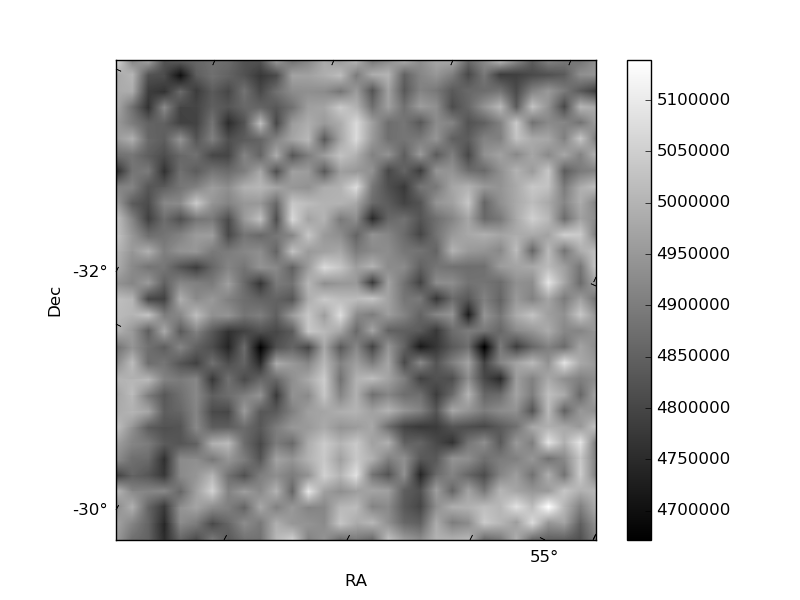
Histogram calculated using DETX and DETY for each event in the final _common_clean file
| Quadrant A | 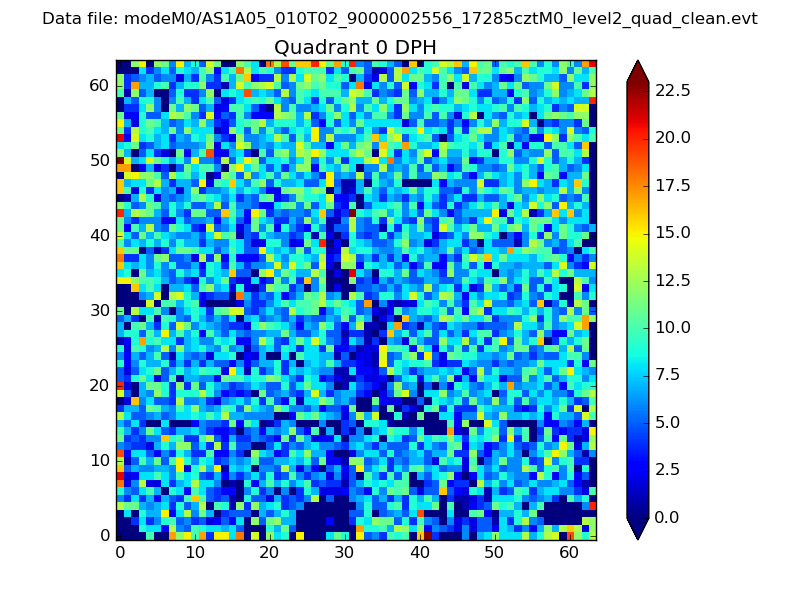 |
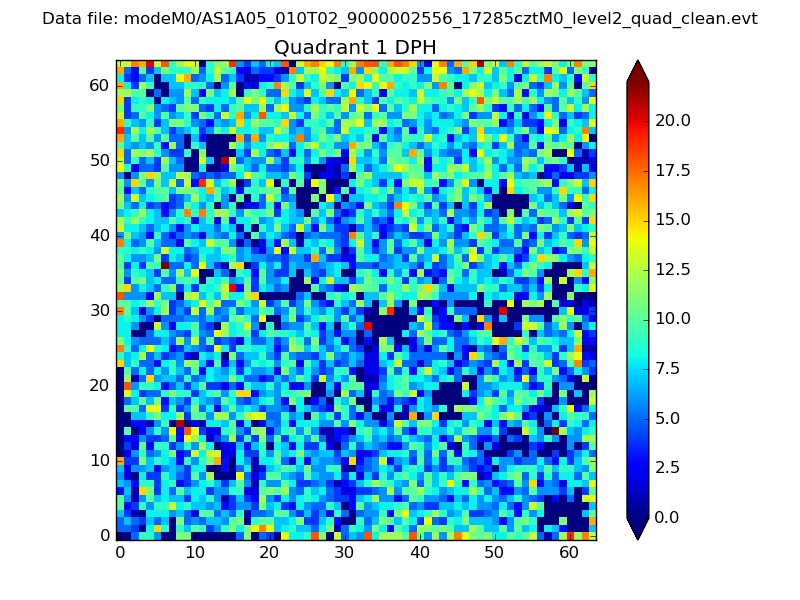 |
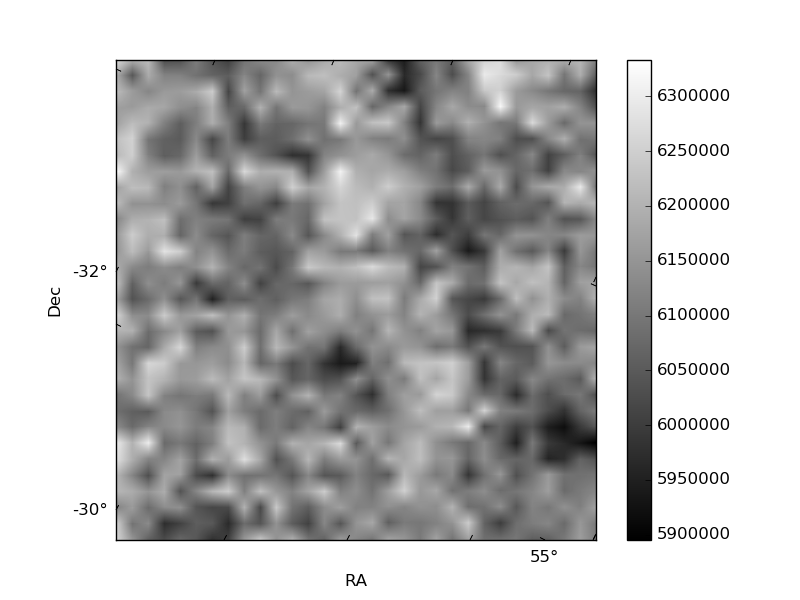
Quadrant B |
|---|---|---|---|
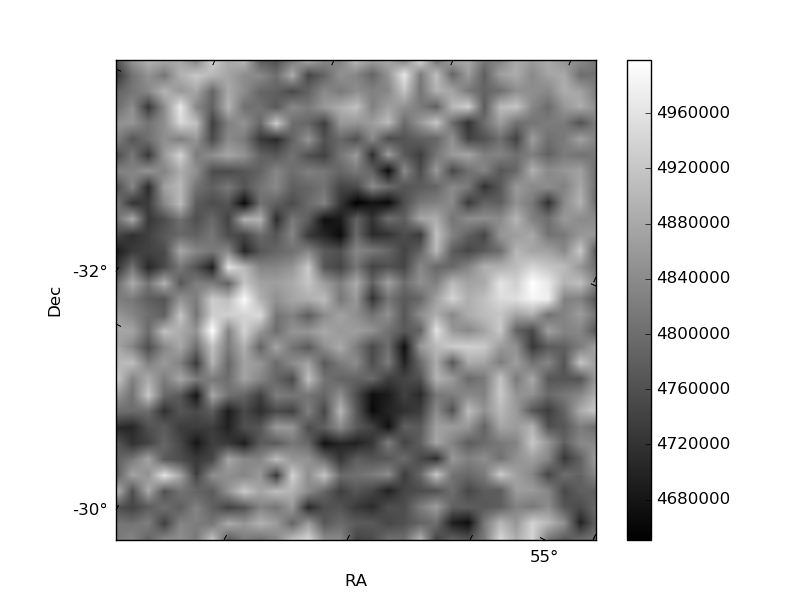
| Quadrant D | 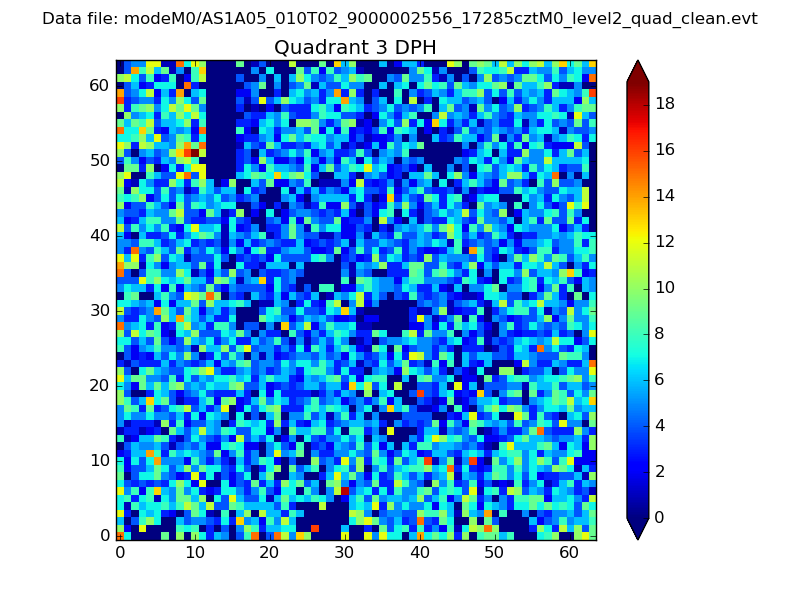 |
 |
Quadrant C |
| Plot type | Count rate plots | Images |
|---|---|---|
| Comparison with Poisson distribution Blue bars denote a histogram of data divided into 1 sec bins. Red curve is a Poisson curve with rate = median count rate of data. |
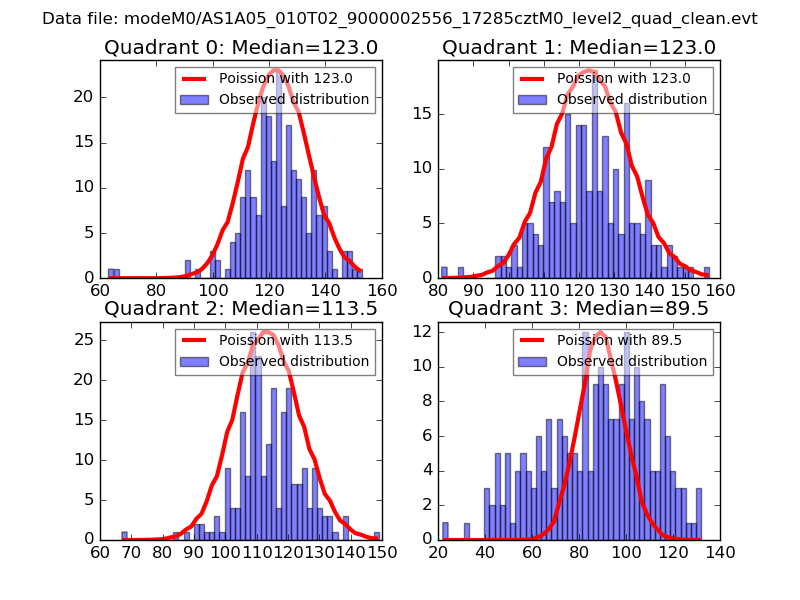 |
 |
| Quadrant-wise count rates Data is divided into 100 sec bins |
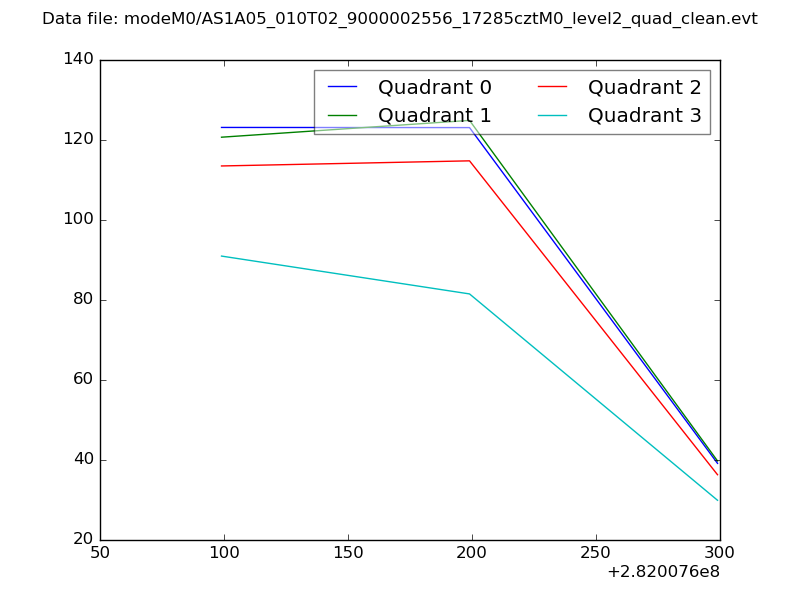 |
|
| Module-wise count rates for Quadrant A Data is divided into 100 sec bins |
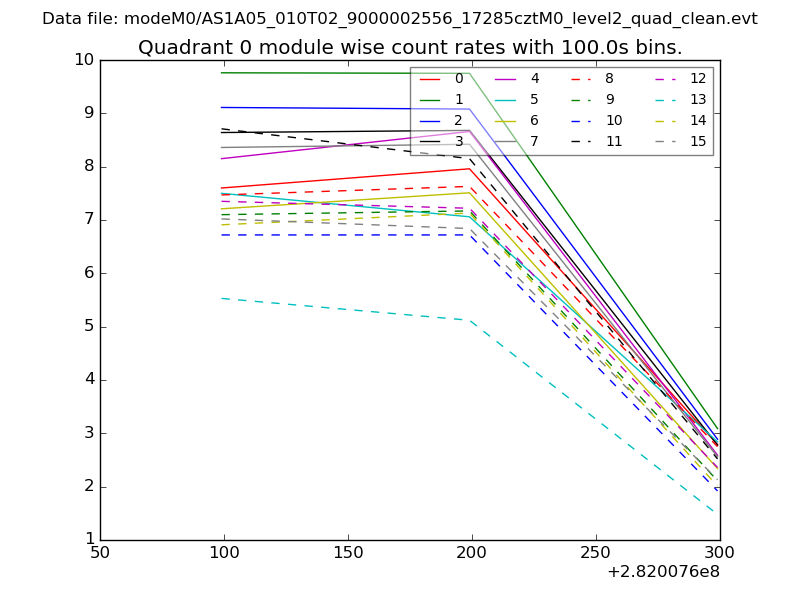 |
 |
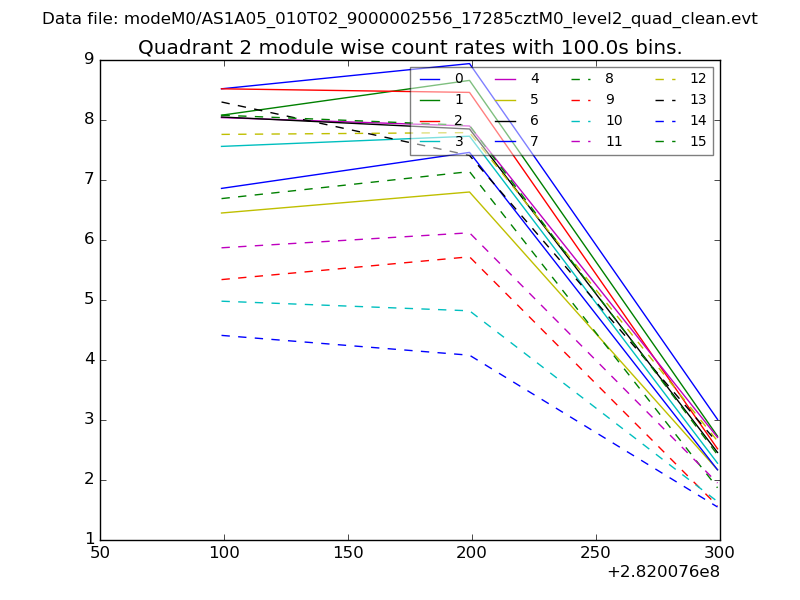
| Module-wise count rates for Quadrant B Data is divided into 100 sec bins |
 |
 |
| Module-wise count rates for Quadrant C Data is divided into 100 sec bins |
 |
 |
| Module-wise count rates for Quadrant D Data is divided into 100 sec bins |
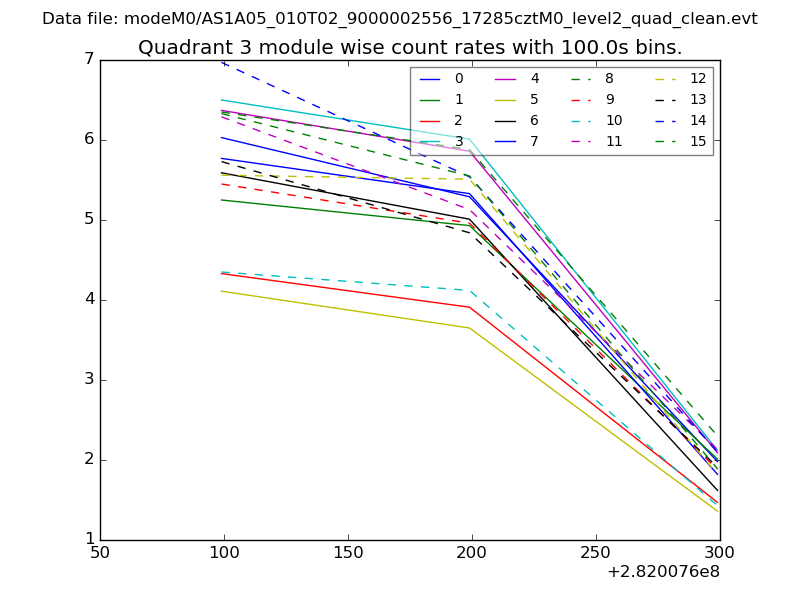 |
 |
| Parameter | Plot |
|---|---|
| CZT HV Monitor | 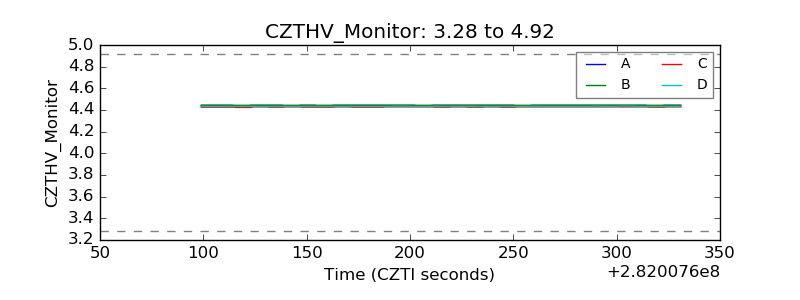 |
| D_VDD | 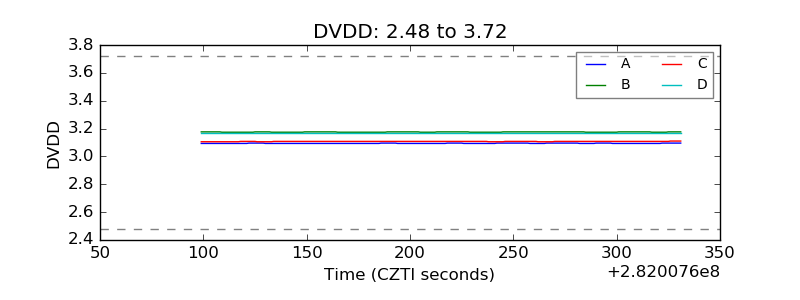 |
| Temperature 1 |  |
| Veto HV Monitor | 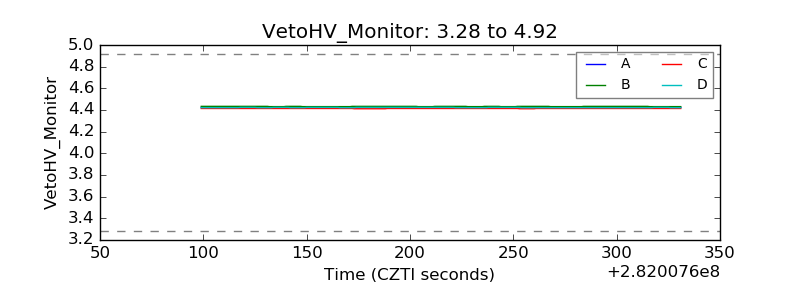 |
| Veto LLD | 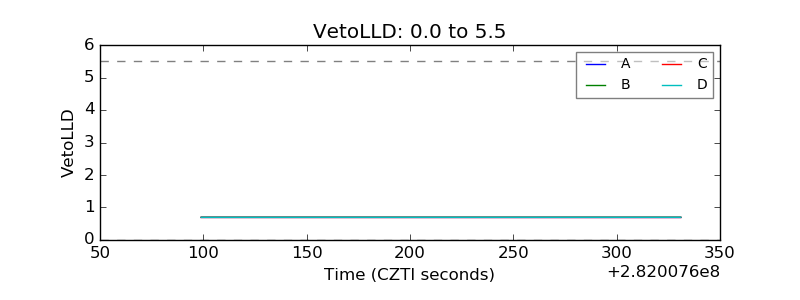 |
| Alpha Counter | 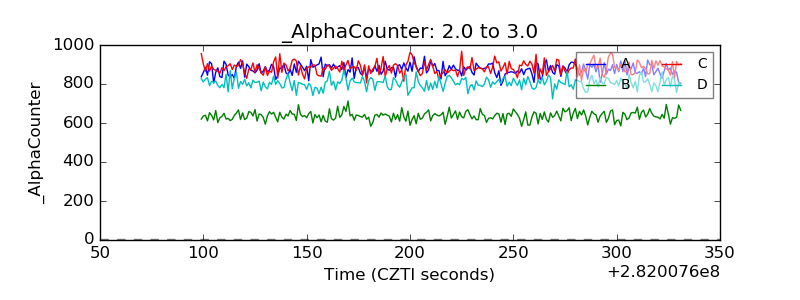 |
| _CPM_Rate | 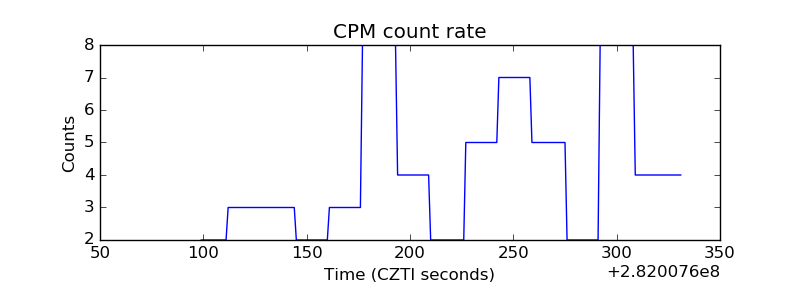 |
| CZT Counter |  |
| +2.5 Volts monitor |  |
| +5 Volts monitor |  |
| _ROLL_ROT | 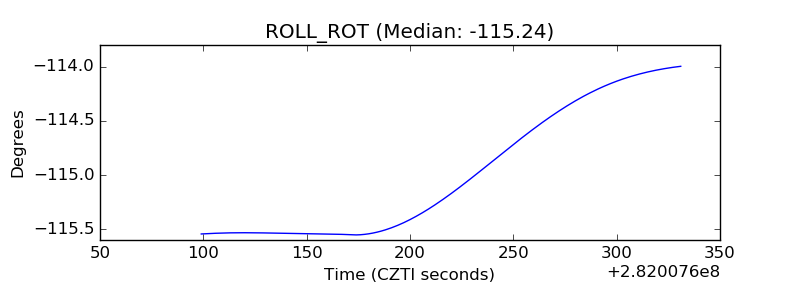 |
| _Roll_DEC |  |
| _Roll_RA | 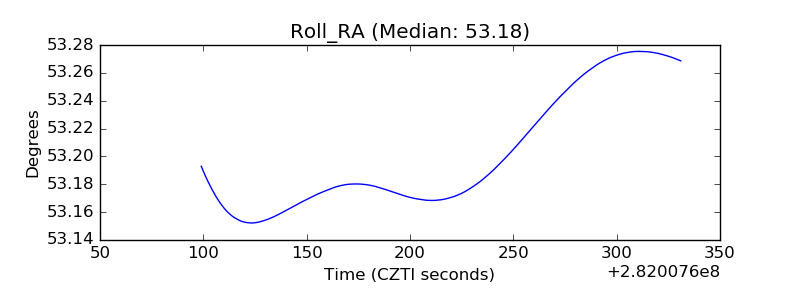 |
| Veto Counter |  |