| Param | Original file | Final file |
|---|---|---|
| Filename | modeM0/AS1A05_010T02_9000002556_17317cztM0_level2.evt | modeM0/AS1A05_010T02_9000002556_17317cztM0_level2_quad_clean.evt |
| Size (bytes) | 608,754,240 | 115,413,120 |
| Size | 580.6 MB | 110.1 MB |
| Events in quadrant A | 4,270,388 | 744,275 |
| Events in quadrant B | 4,115,361 | 747,012 |
| Events in quadrant C | 4,079,906 | 701,667 |
| Events in quadrant D | 5,376,626 | 694,560 |
| Mode M0 | |||
|---|---|---|---|
| Quadrant | BADHDUFLAG | Total packets | Discarded packets |
| A | 0 | 18471 | 2 |
| B | 0 | 18084 | 2 |
| C | 0 | 17995 | 2 |
| D | 0 | 21847 | 2 |
| Mode M9 | |||
|---|---|---|---|
| Quadrant | BADHDUFLAG | Total packets | Discarded packets |
| A | 0 | 5 | 0 |
| B | 0 | 5 | 0 |
| C | 0 | 5 | 0 |
| D | 0 | 5 | 0 |
| Mode SS | |||
|---|---|---|---|
| Quadrant | BADHDUFLAG | Total packets | Discarded packets |
| A | 0 | 180 | 0 |
| B | 0 | 180 | 0 |
| C | 0 | 180 | 0 |
| D | 0 | 180 | 0 |
| Quadrant | Total seconds | Saturated seconds | Saturation percentage |
|---|---|---|---|
| A | 8742 | 112 | 1.281171% |
| B | 8742 | 171 | 1.956074% |
| C | 8742 | 192 | 2.196294% |
| D | 8742 | 287 | 3.283002% |
Noise dominated data is calculated using 1-second bins in cleaned event files. If a bin has >2000 counts, and if more than 50% of those come from <1% of pixels, then it is considered to be noise-dominated and hence unusable.
| Quadrant | # 1 sec bins | Bins with >0 counts | Bins with >2000 counts | High rate bins dominated by noise | Noise dominated (total time) | Noise dominated (detector-on time) | Marked lightcurve |
|---|---|---|---|---|---|---|---|
| A | 9357 | 8745 | 0 | 0 | 0.00% | 0.00% | 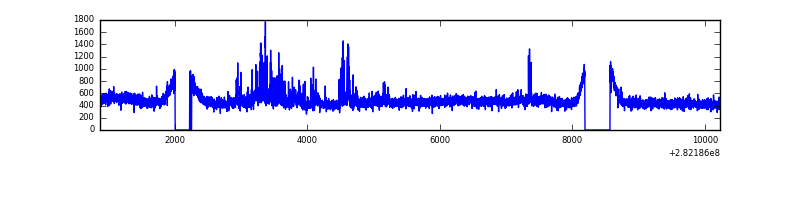 |
| B | 9357 | 8745 | 0 | 0 | 0.00% | 0.00% | 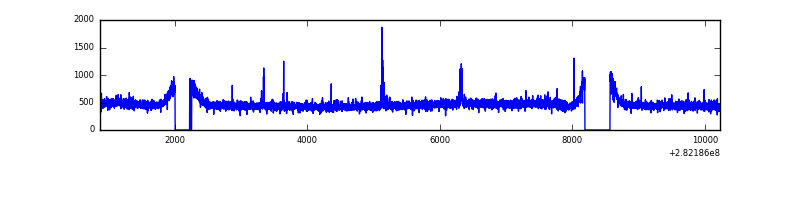 |
| C | 9357 | 8745 | 0 | 0 | 0.00% | 0.00% | 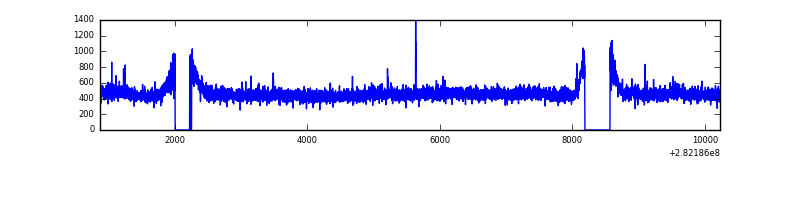 |
| D | 9357 | 8745 | 169 | 169 | 1.81% | 1.93% | 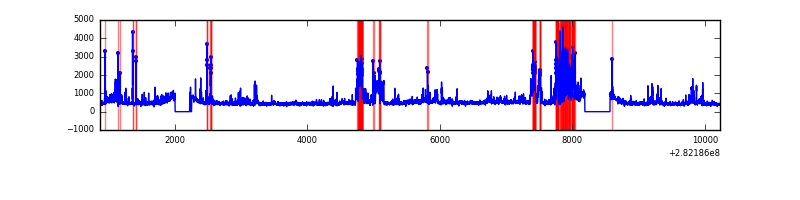 |
Top three noisy pixels from each quadrant. If the there are fewer than three noisy pixels in the level2.evt file, extra rows are filled as -1
| Pixel properties | Quadrant properties | ||||||
|---|---|---|---|---|---|---|---|
| Quadrant | DetID | PixID | Counts | Sigma | Mean | Median | Sigma |
| A | 13 | 210 | 275431 | 1306.98 | 1039 | 1014 | 210.0 |
| A | 0 | 226 | 8928 | 37.69 | 1039 | 1014 | 210.0 |
| A | 3 | 137 | 8242 | 34.43 | 1039 | 1014 | 210.0 |
| B | 12 | 111 | 25086 | 119.7 | 1038 | 1012 | 201.1 |
| B | 0 | 230 | 24432 | 116.45 | 1038 | 1012 | 201.1 |
| B | 11 | 111 | 21774 | 103.23 | 1038 | 1012 | 201.1 |
| C | 14 | 238 | 153083 | 650.17 | 994 | 1000 | 233.9 |
| C | 3 | 233 | 20656 | 84.03 | 994 | 1000 | 233.9 |
| C | 8 | 128 | 15256 | 60.95 | 994 | 1000 | 233.9 |
| D | 5 | 222 | 1090263 | 4490.27 | 1001 | 970 | 242.6 |
| D | 11 | 176 | 252501 | 1036.86 | 1001 | 970 | 242.6 |
| D | 1 | 52 | 193603 | 794.07 | 1001 | 970 | 242.6 |
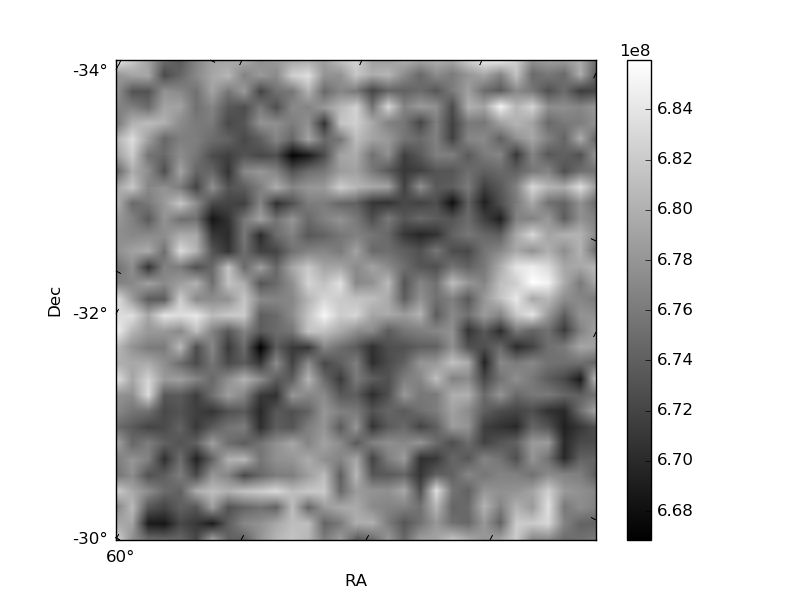
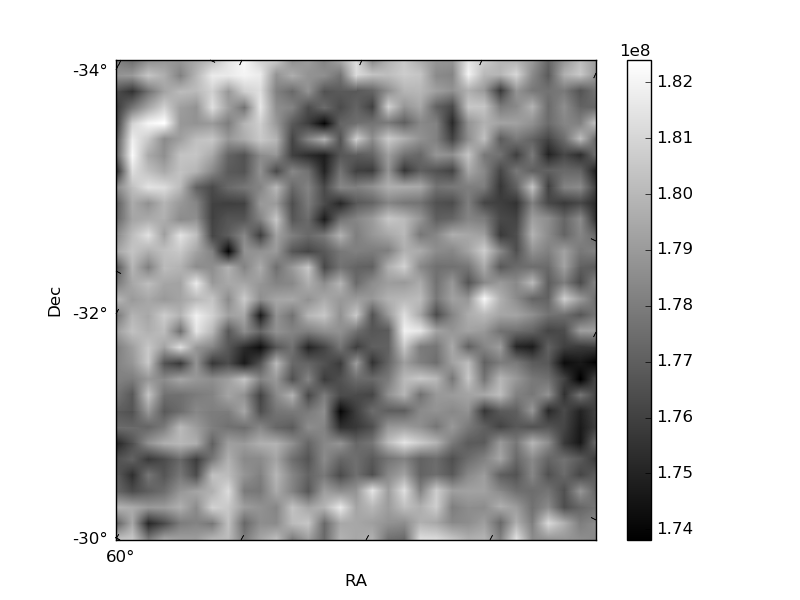
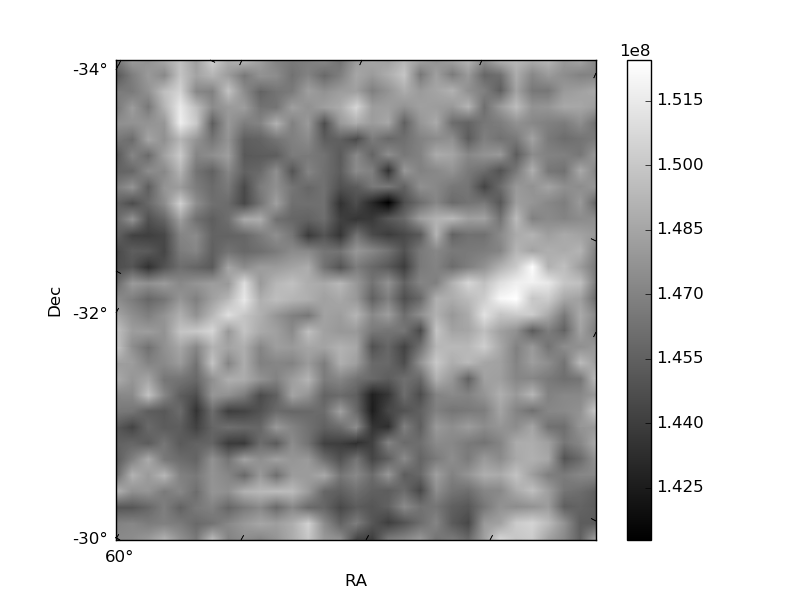
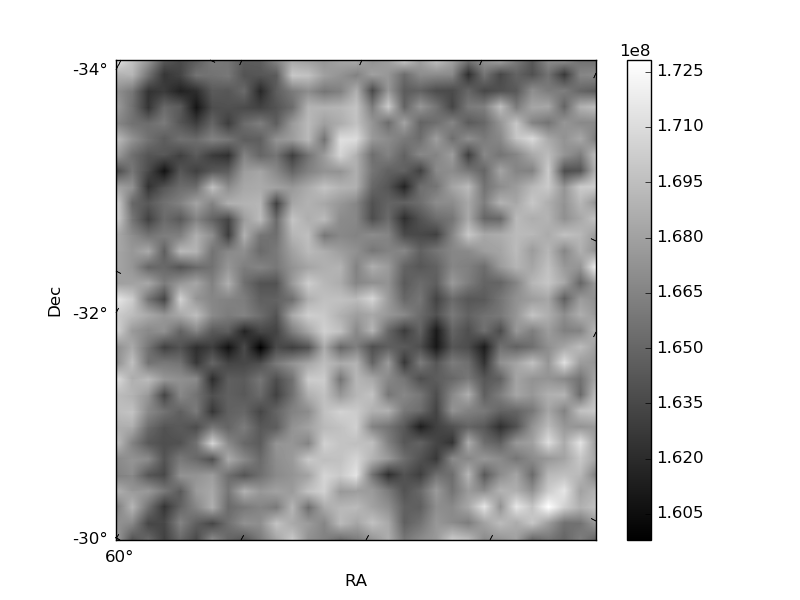
Histogram calculated using DETX and DETY for each event in the final _common_clean file
| Quadrant A | 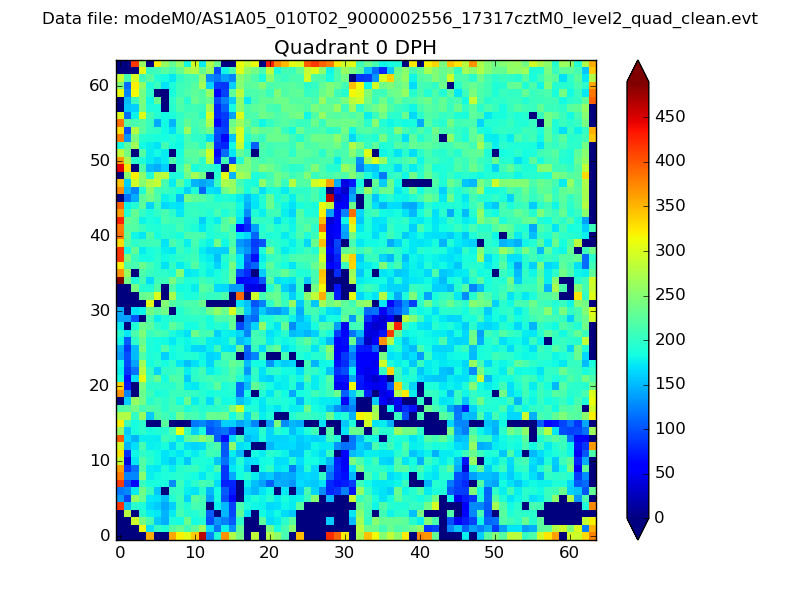 |
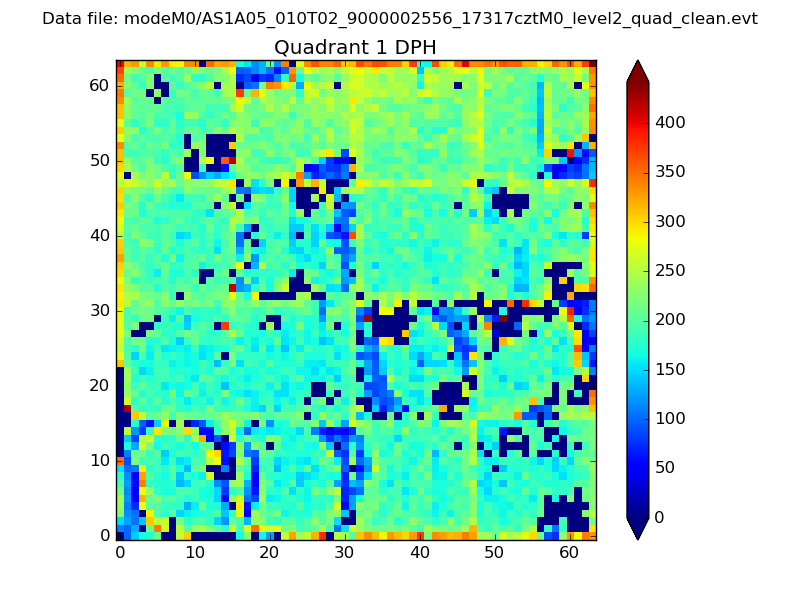 |
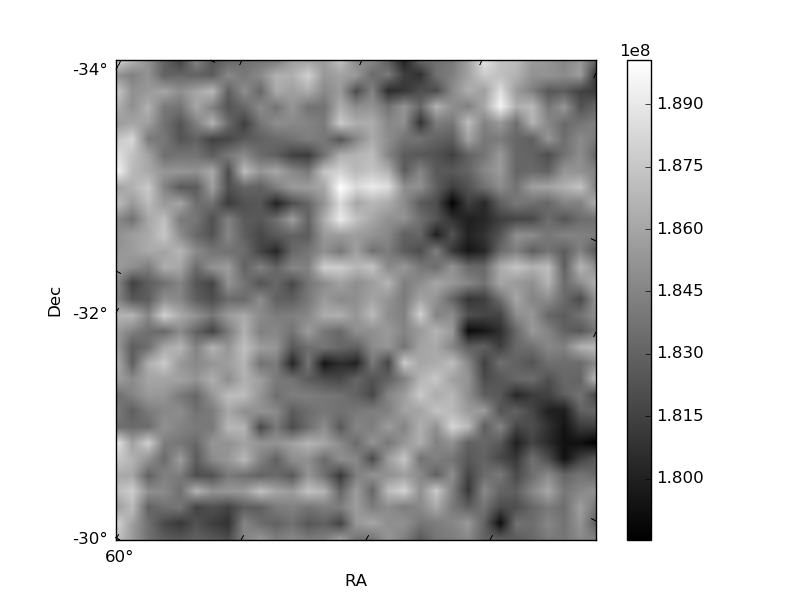
Quadrant B |
|---|---|---|---|
| Quadrant D | 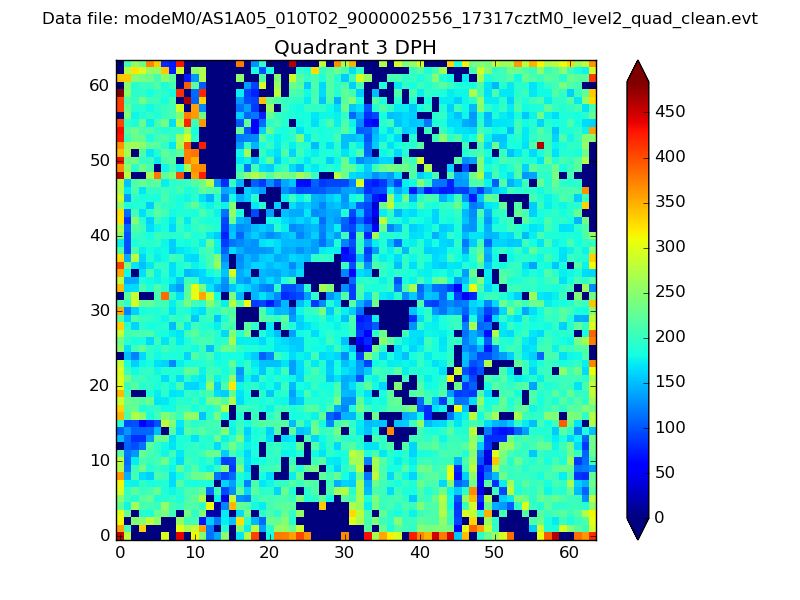 |
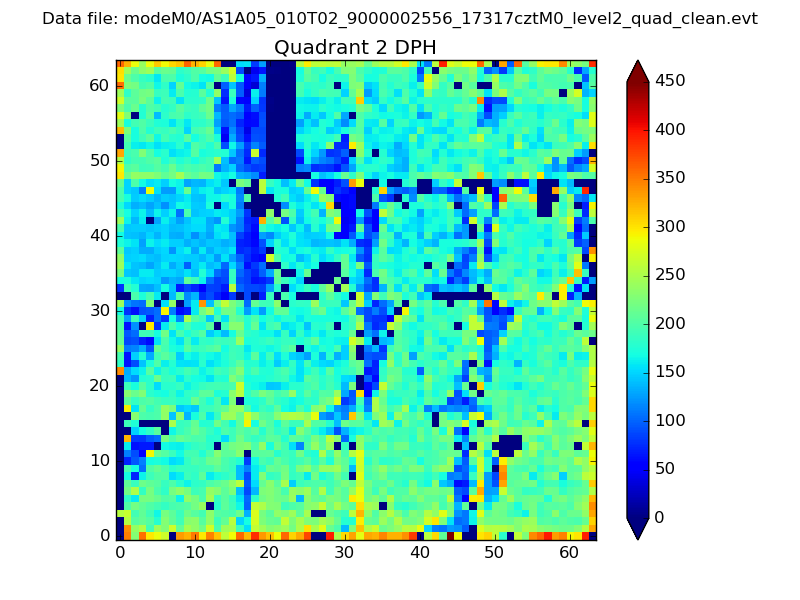 |
Quadrant C |
| Plot type | Count rate plots | Images |
|---|---|---|
| Comparison with Poisson distribution Blue bars denote a histogram of data divided into 1 sec bins. Red curve is a Poisson curve with rate = median count rate of data. |
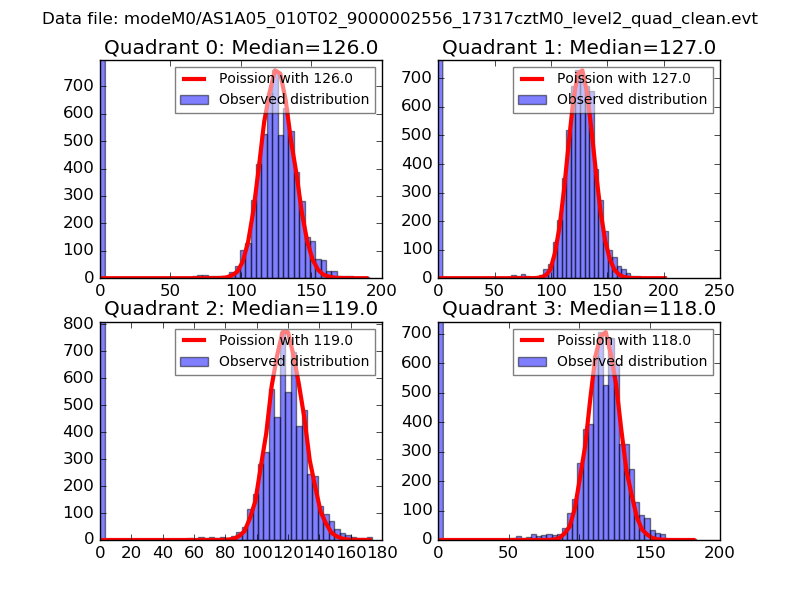 |
 |
| Quadrant-wise count rates Data is divided into 100 sec bins |
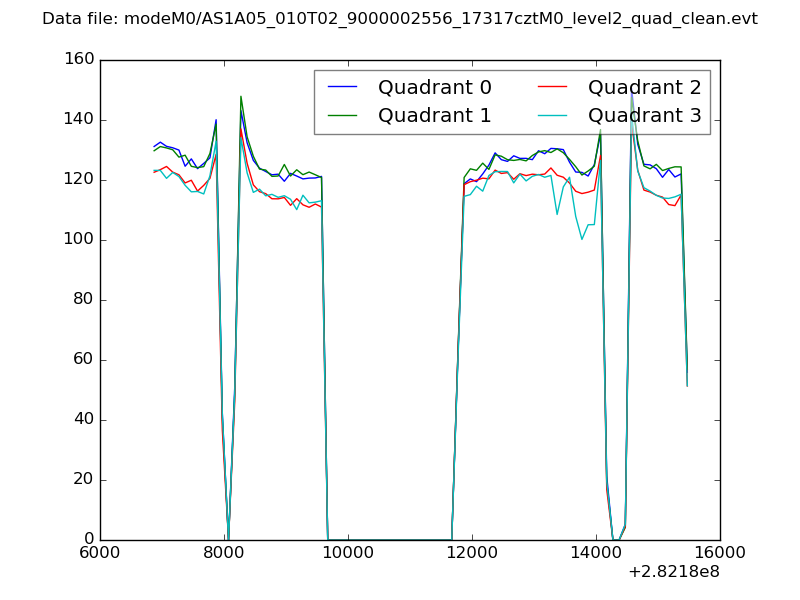 |
|
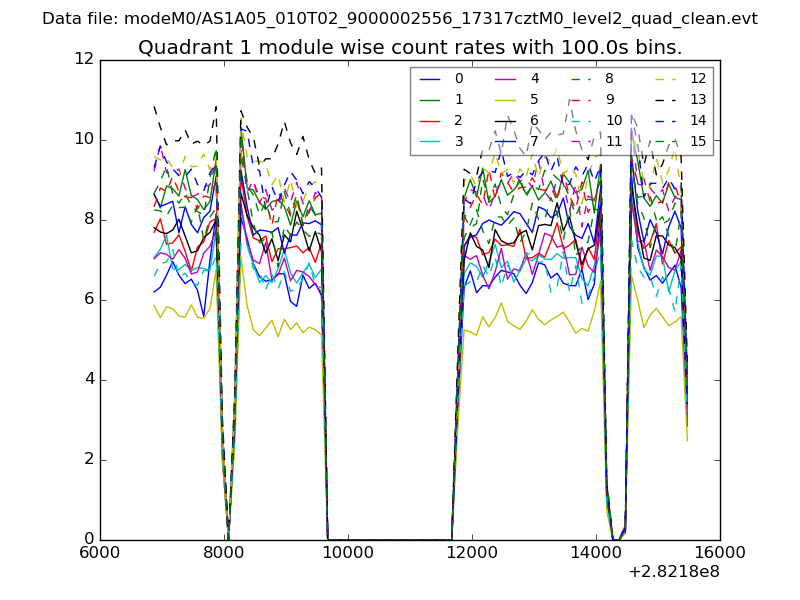
| Module-wise count rates for Quadrant A Data is divided into 100 sec bins |
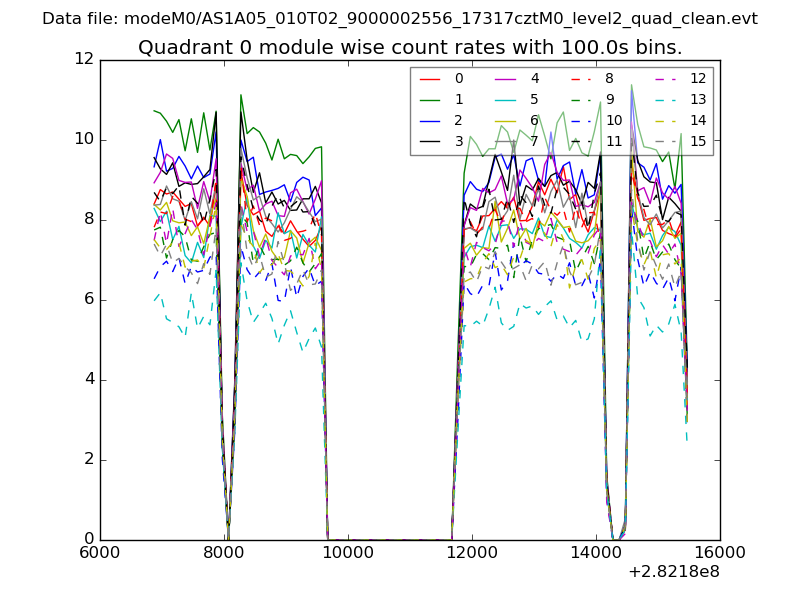 |
 |
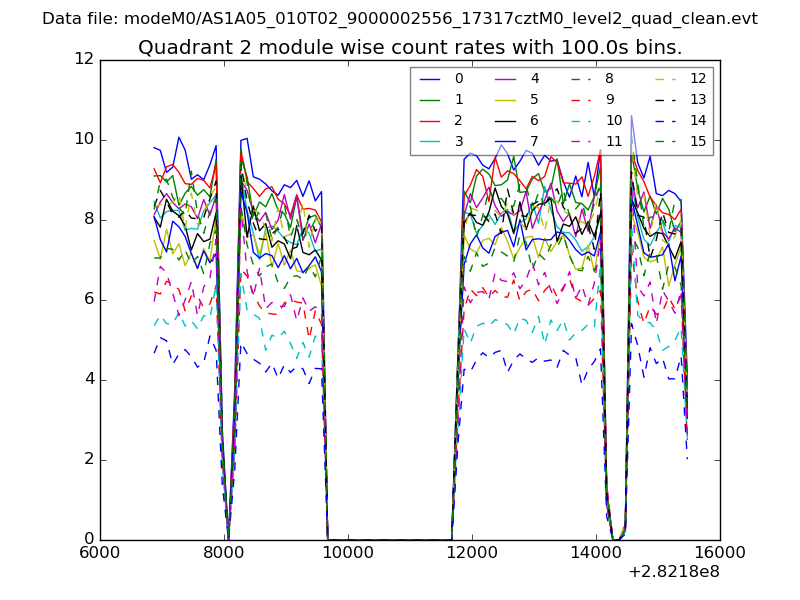
| Module-wise count rates for Quadrant B Data is divided into 100 sec bins |
 |
 |
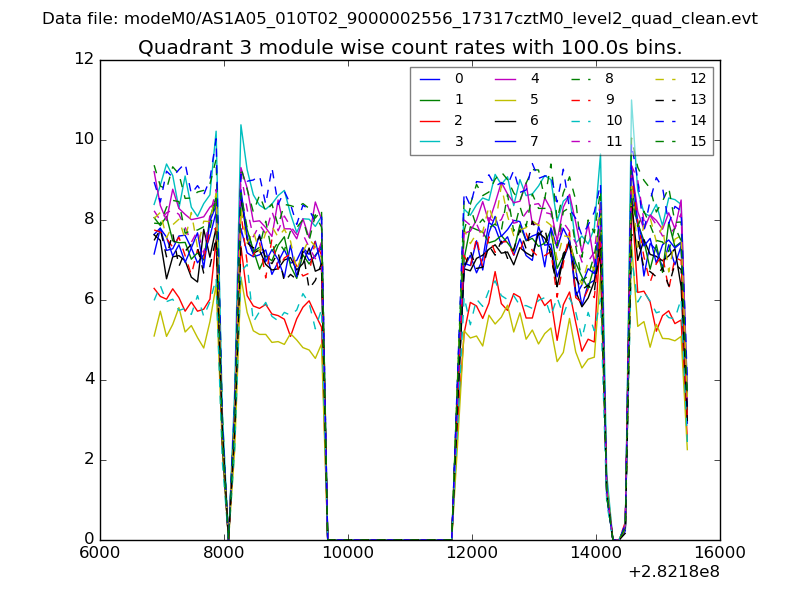
| Module-wise count rates for Quadrant C Data is divided into 100 sec bins |
 |
 |
| Module-wise count rates for Quadrant D Data is divided into 100 sec bins |
 |
 |
| Parameter | Plot |
|---|---|
| CZT HV Monitor | 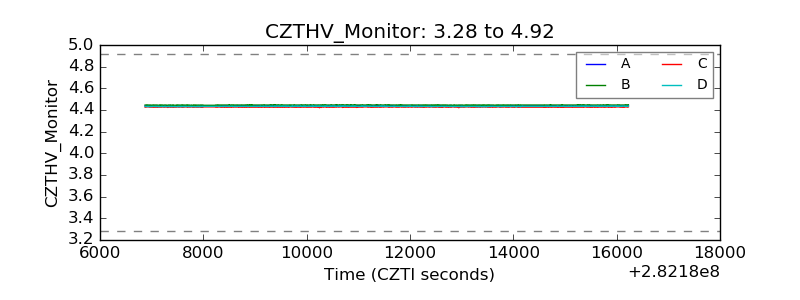 |
| D_VDD | 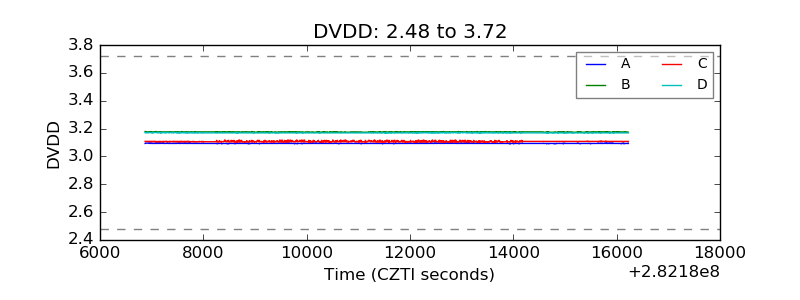 |
| Temperature 1 | 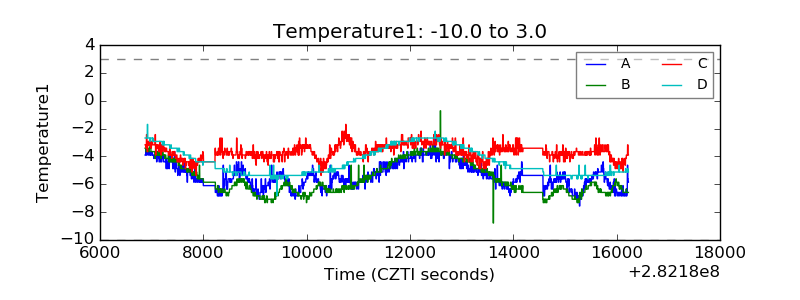 |
| Veto HV Monitor | 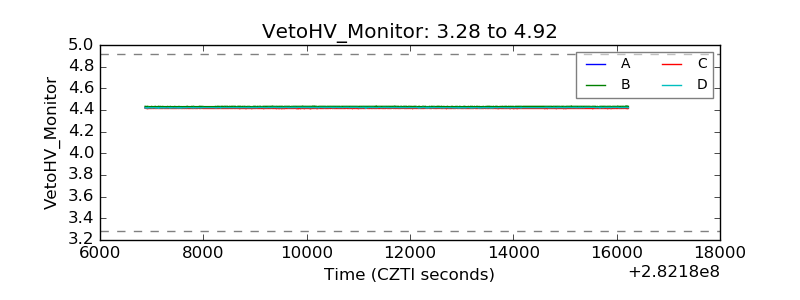 |
| Veto LLD | 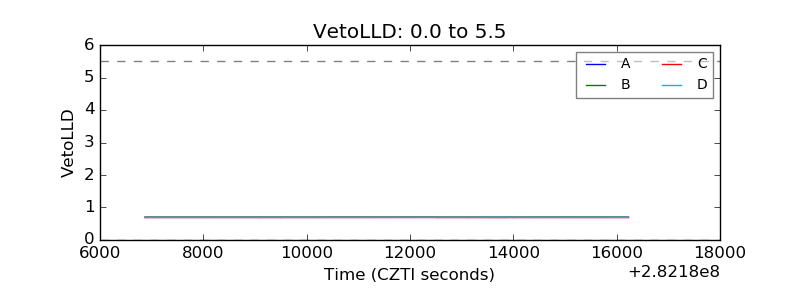 |
| Alpha Counter | 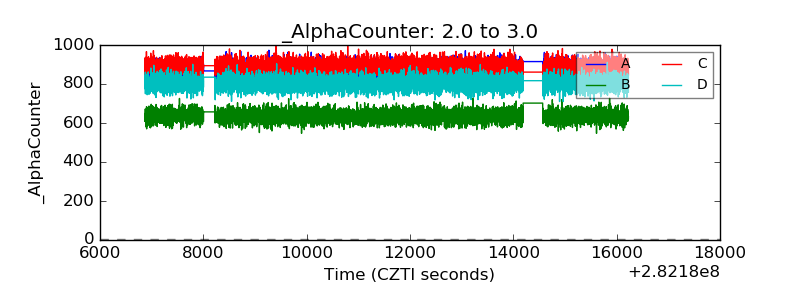 |
| _CPM_Rate | 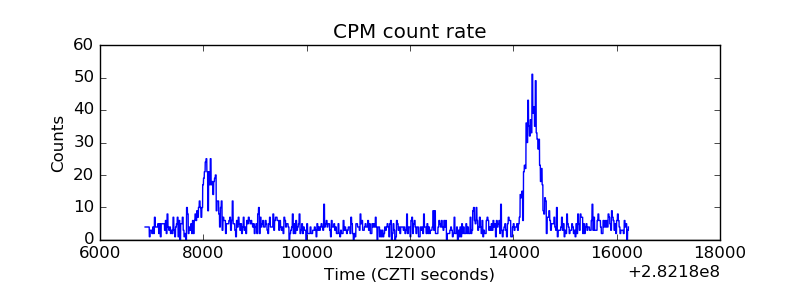 |
| CZT Counter | 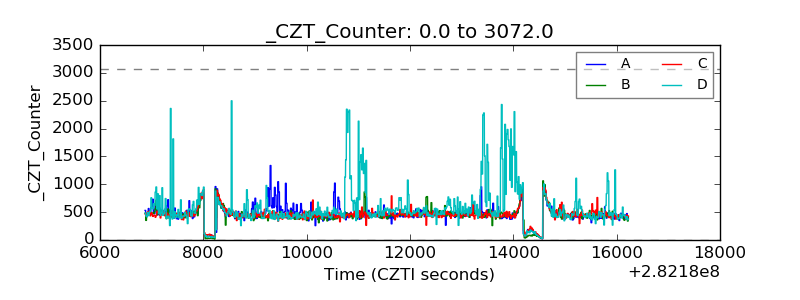 |
| +2.5 Volts monitor |  |
| +5 Volts monitor | 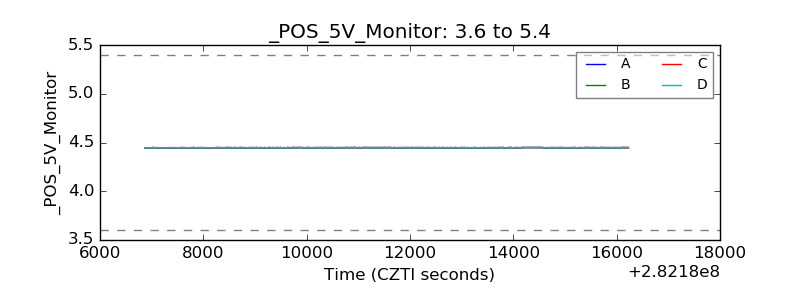 |
| _ROLL_ROT | 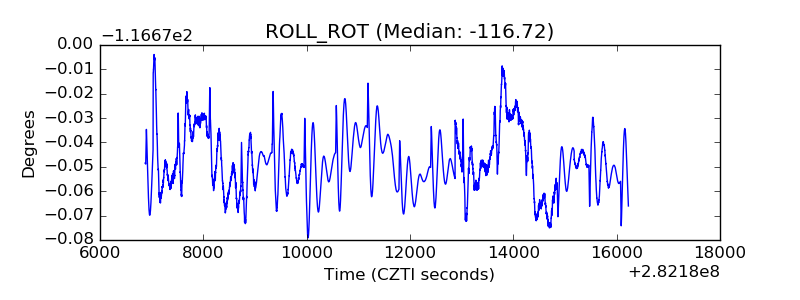 |
| _Roll_DEC | 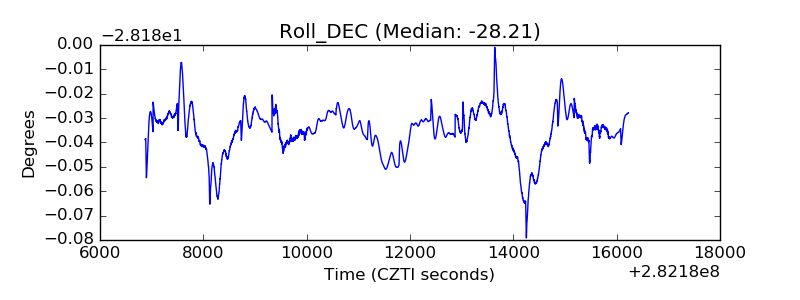 |
| _Roll_RA | 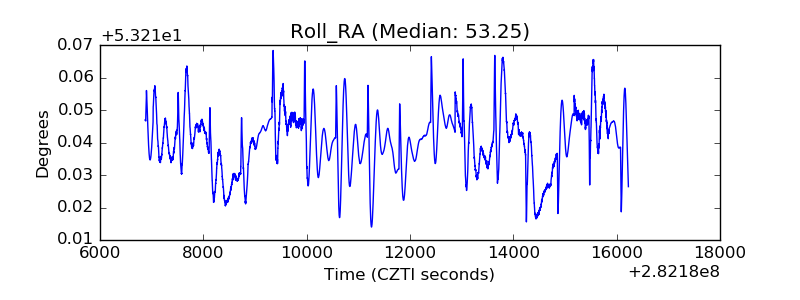 |
| Veto Counter | 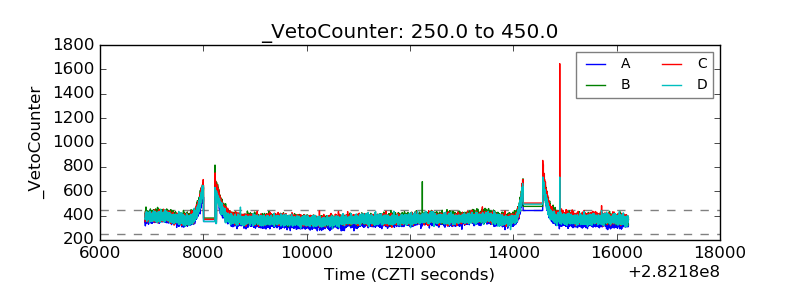 |