| Param | Original file | Final file |
|---|---|---|
| Filename | modeM0/AS1T03_032T01_9000002564_17369cztM0_level2.evt | modeM0/AS1T03_032T01_9000002564_17369cztM0_level2_quad_clean.evt |
| Size (bytes) | 249,065,280 | 24,863,040 |
| Size | 237.5 MB | 23.7 MB |
| Events in quadrant A | 1,620,847 | 139,772 |
| Events in quadrant B | 1,625,004 | 140,316 |
| Events in quadrant C | 1,653,800 | 132,607 |
| Events in quadrant D | 2,441,766 | 129,394 |
| Mode M9 | |||
|---|---|---|---|
| Quadrant | BADHDUFLAG | Total packets | Discarded packets |
| A | 0 | 1 | 0 |
| B | 0 | 2 | 0 |
| C | 0 | 2 | 0 |
| D | 0 | 2 | 0 |
| Mode SS | |||
|---|---|---|---|
| Quadrant | BADHDUFLAG | Total packets | Discarded packets |
| A | 0 | 58 | 0 |
| B | 0 | 58 | 0 |
| C | 0 | 58 | 0 |
| D | 0 | 58 | 0 |
| Mode M0 | |||
|---|---|---|---|
| Quadrant | BADHDUFLAG | Total packets | Discarded packets |
| A | 0 | 6681 | 1 |
| B | 0 | 6682 | 1 |
| C | 0 | 6879 | 1 |
| D | 0 | 9354 | 1 |
| Quadrant | Total seconds | Saturated seconds | Saturation percentage |
|---|---|---|---|
| A | 2949 | 13 | 0.440827% |
| B | 2949 | 18 | 0.610376% |
| C | 2949 | 29 | 0.983384% |
| D | 2949 | 119 | 4.035266% |
Noise dominated data is calculated using 1-second bins in cleaned event files. If a bin has >2000 counts, and if more than 50% of those come from <1% of pixels, then it is considered to be noise-dominated and hence unusable.
| Quadrant | # 1 sec bins | Bins with >0 counts | Bins with >2000 counts | High rate bins dominated by noise | Noise dominated (total time) | Noise dominated (detector-on time) | Marked lightcurve |
|---|---|---|---|---|---|---|---|
| A | 2949 | 2949 | 0 | 0 | 0.00% | 0.00% | 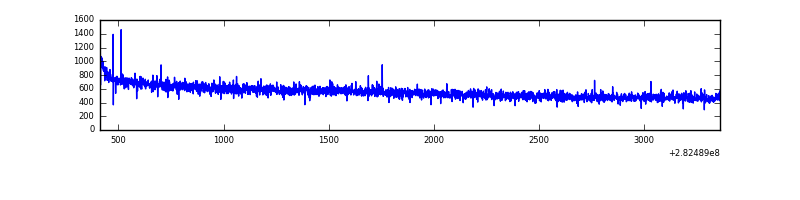 |
| B | 2949 | 2949 | 0 | 0 | 0.00% | 0.00% | 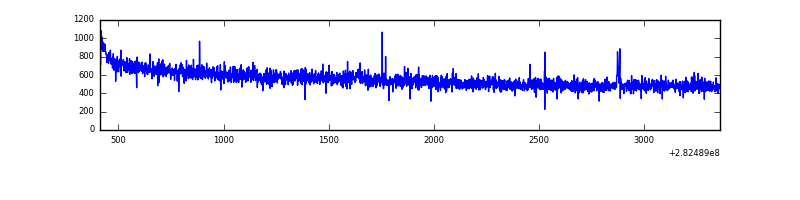 |
| C | 2949 | 2949 | 0 | 0 | 0.00% | 0.00% | 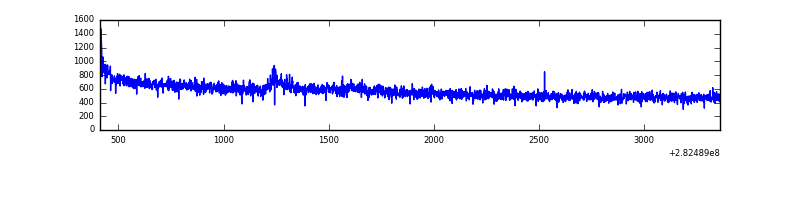 |
| D | 2949 | 2949 | 80 | 80 | 2.71% | 2.71% | 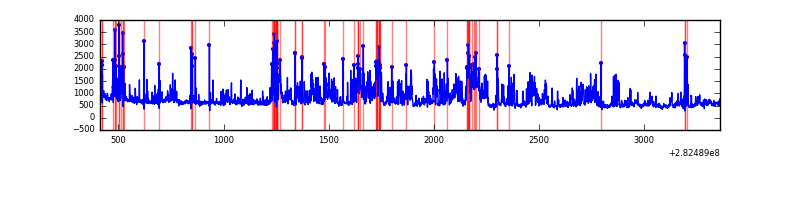 |
Top three noisy pixels from each quadrant. If the there are fewer than three noisy pixels in the level2.evt file, extra rows are filled as -1
| Pixel properties | Quadrant properties | ||||||
|---|---|---|---|---|---|---|---|
| Quadrant | DetID | PixID | Counts | Sigma | Mean | Median | Sigma |
| A | 0 | 226 | 3733 | 39.24 | 421 | 414 | 84.6 |
| A | 12 | 194 | 3138 | 32.2 | 421 | 414 | 84.6 |
| A | 3 | 137 | 2817 | 28.41 | 421 | 414 | 84.6 |
| B | 12 | 111 | 8339 | 101.86 | 415 | 407 | 77.9 |
| B | 11 | 111 | 7546 | 91.67 | 415 | 407 | 77.9 |
| B | 14 | 111 | 6202 | 74.42 | 415 | 407 | 77.9 |
| C | 14 | 238 | 63598 | 693.58 | 395 | 399 | 91.1 |
| C | 3 | 233 | 46270 | 503.41 | 395 | 399 | 91.1 |
| C | 13 | 61 | 2833 | 26.71 | 395 | 399 | 91.1 |
| D | 13 | 232 | 474732 | 4947.58 | 395 | 385 | 95.9 |
| D | 1 | 52 | 221384 | 2305.09 | 395 | 385 | 95.9 |
| D | 5 | 222 | 111689 | 1160.93 | 395 | 385 | 95.9 |
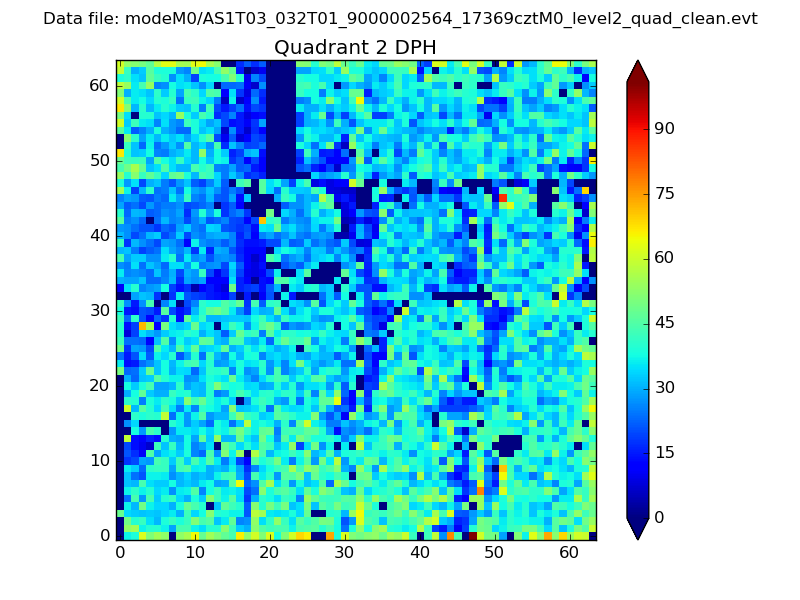
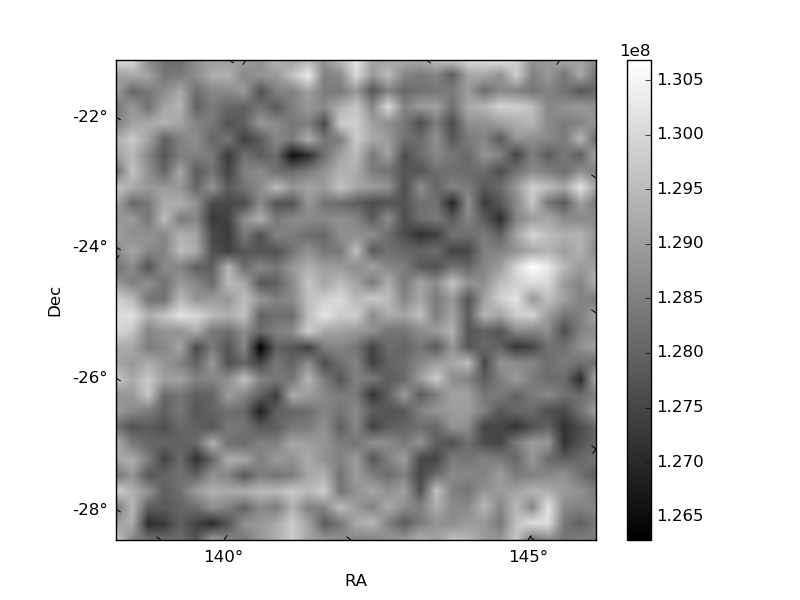
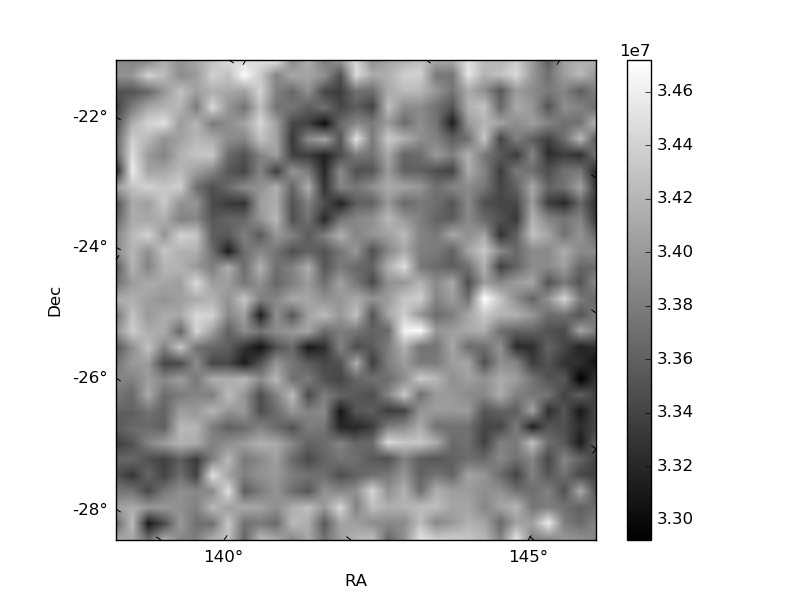
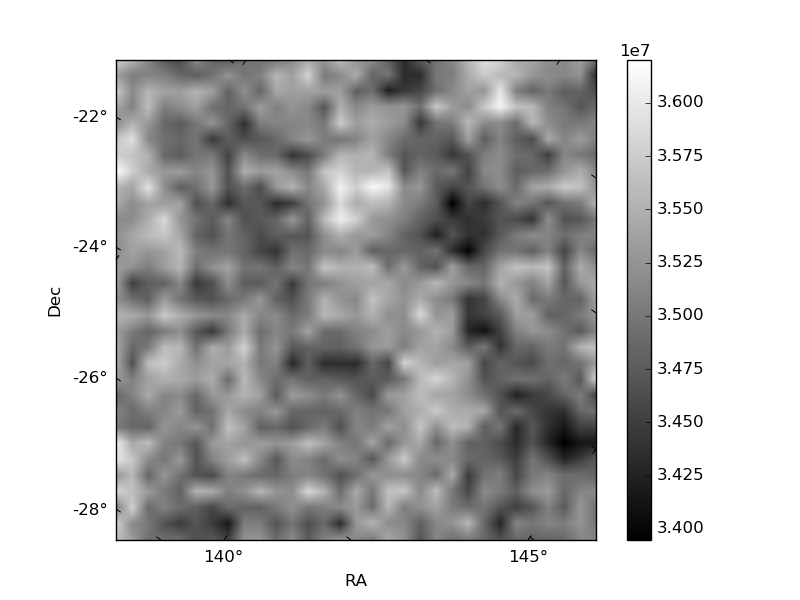
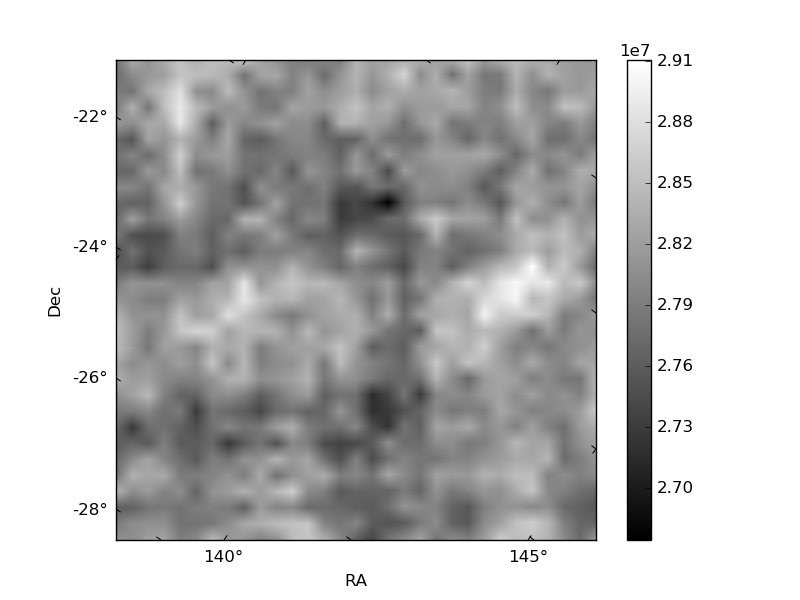
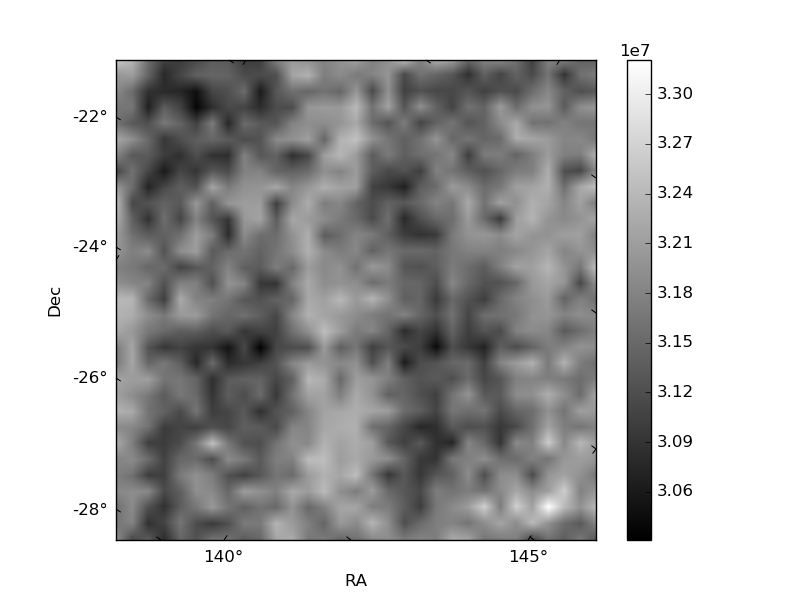
Histogram calculated using DETX and DETY for each event in the final _common_clean file
| Quadrant A | 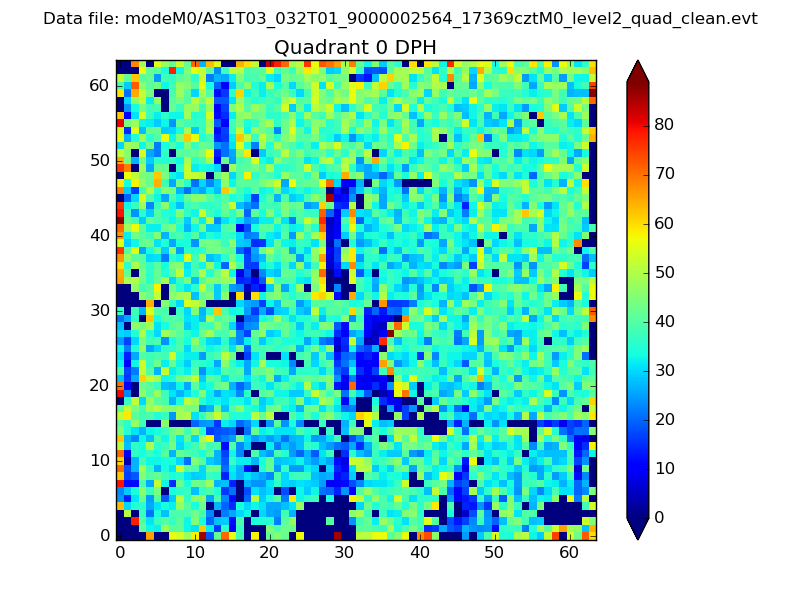 |
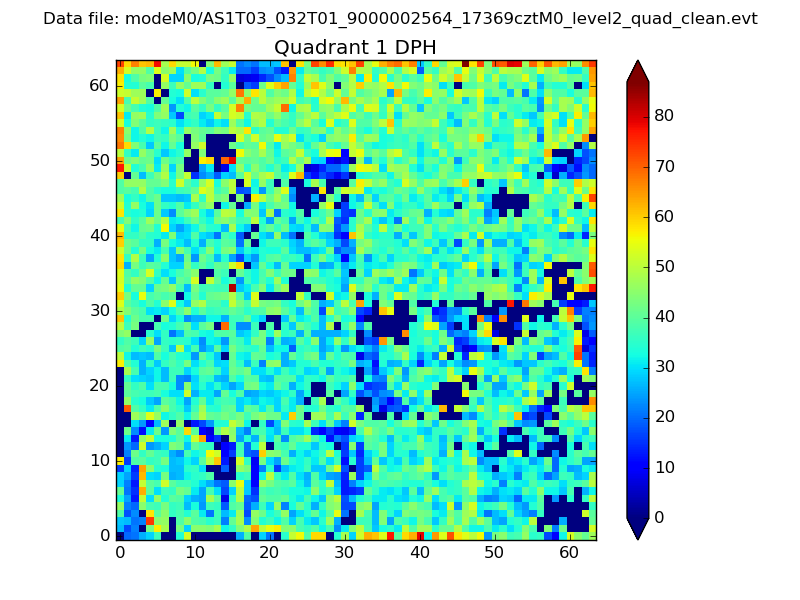 |
Quadrant B |
|---|---|---|---|
| Quadrant D | 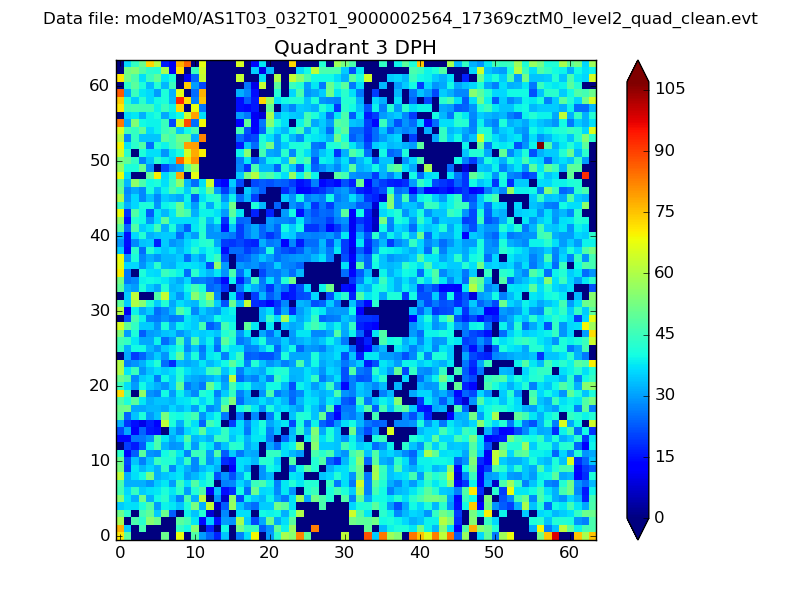 |
 |
Quadrant C |
| Plot type | Count rate plots | Images |
|---|---|---|
| Comparison with Poisson distribution Blue bars denote a histogram of data divided into 1 sec bins. Red curve is a Poisson curve with rate = median count rate of data. |
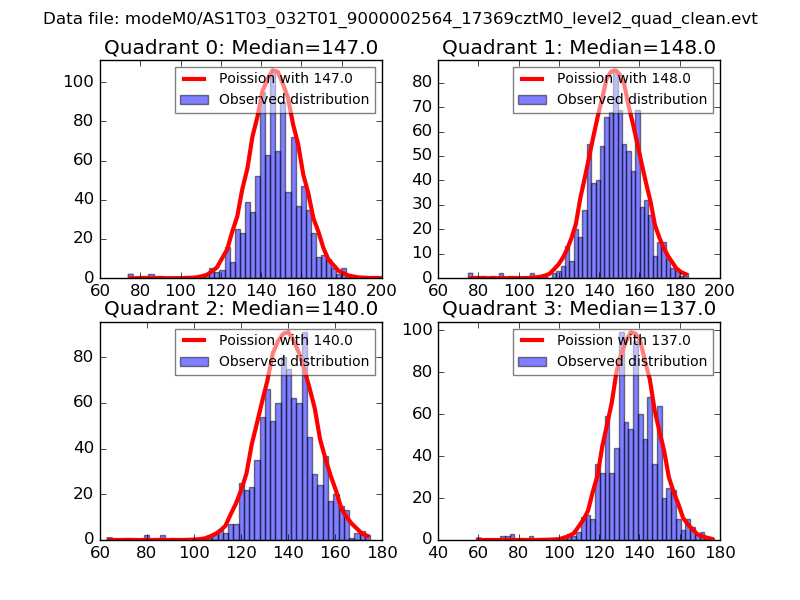 |
 |
| Quadrant-wise count rates Data is divided into 100 sec bins |
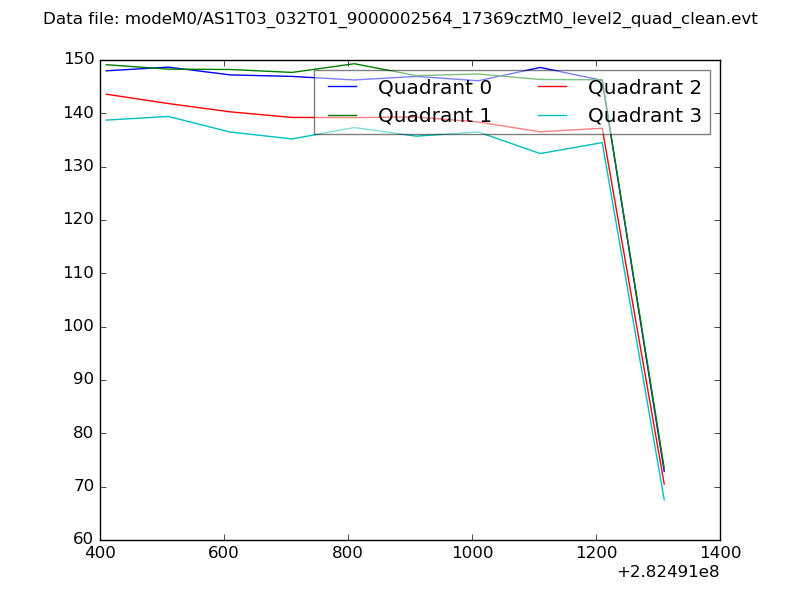 |
|
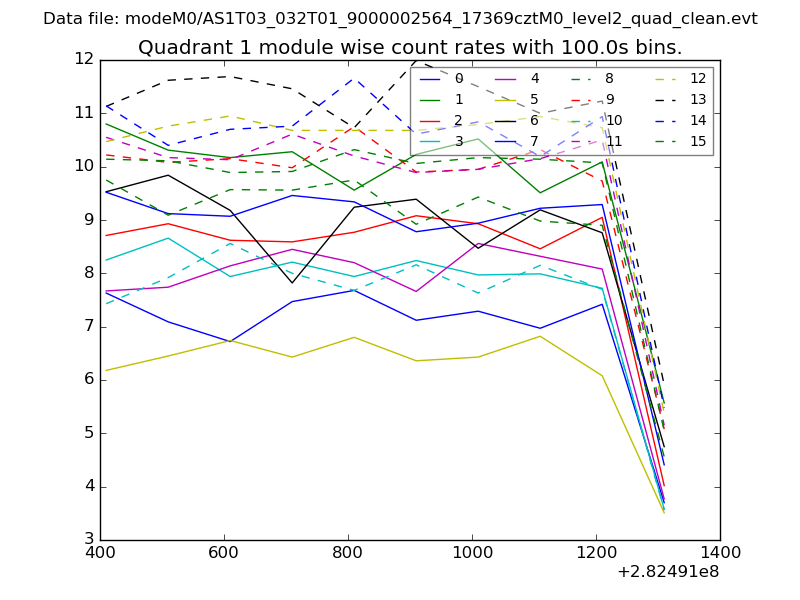
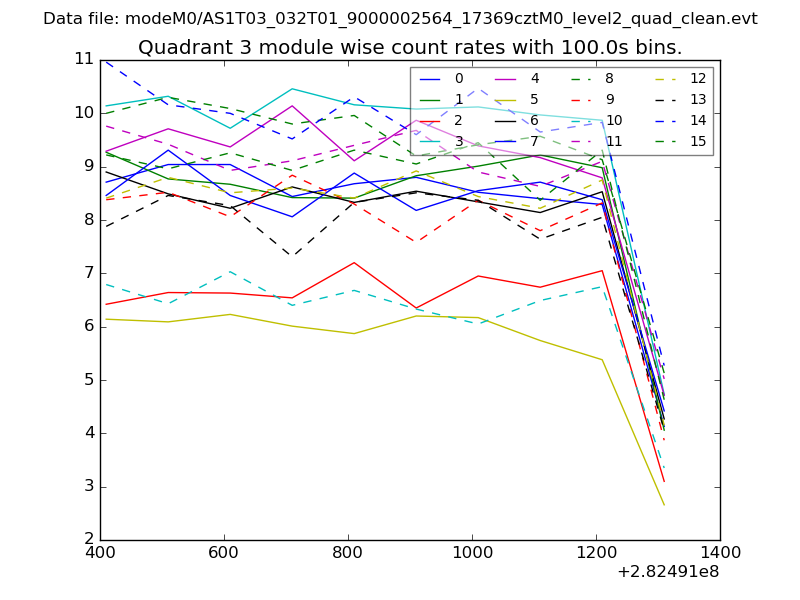
| Module-wise count rates for Quadrant A Data is divided into 100 sec bins |
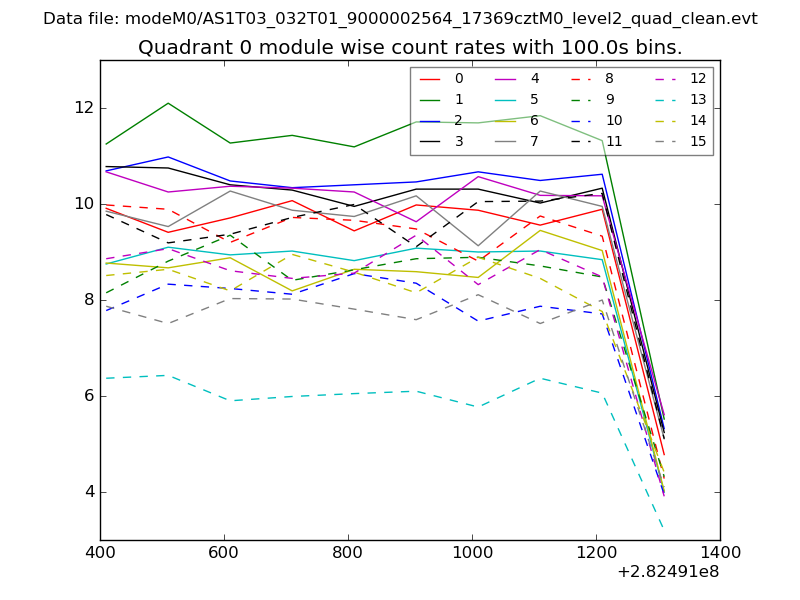 |
 |
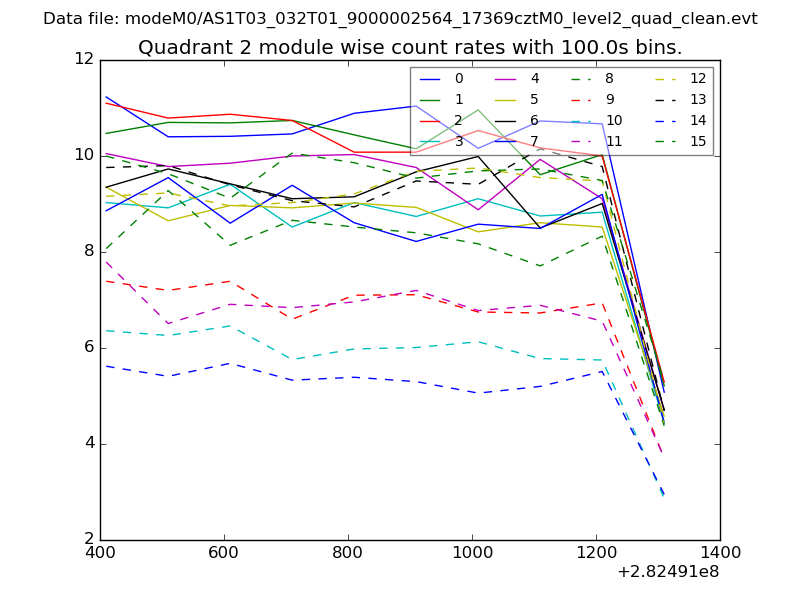
| Module-wise count rates for Quadrant B Data is divided into 100 sec bins |
 |
 |
| Module-wise count rates for Quadrant C Data is divided into 100 sec bins |
 |
 |
| Module-wise count rates for Quadrant D Data is divided into 100 sec bins |
 |
 |
| Parameter | Plot |
|---|---|
| CZT HV Monitor | 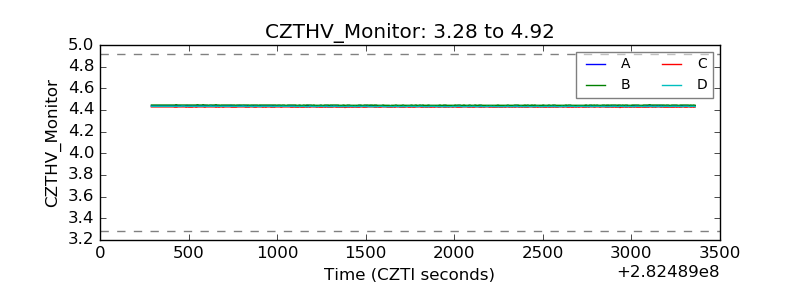 |
| D_VDD | 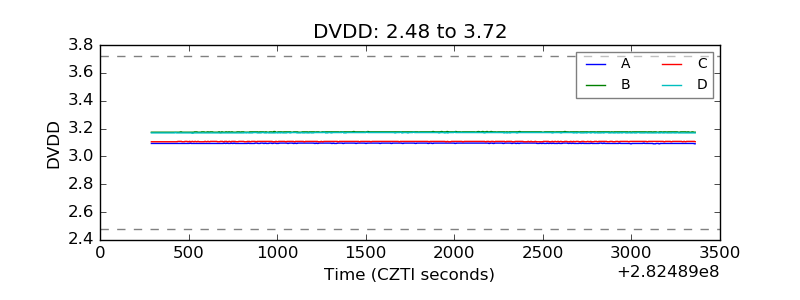 |
| Temperature 1 | 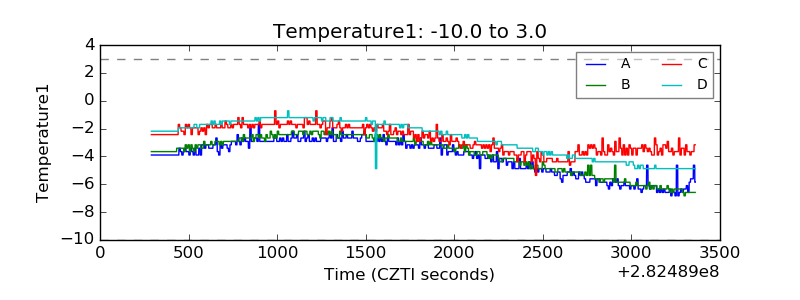 |
| Veto HV Monitor | 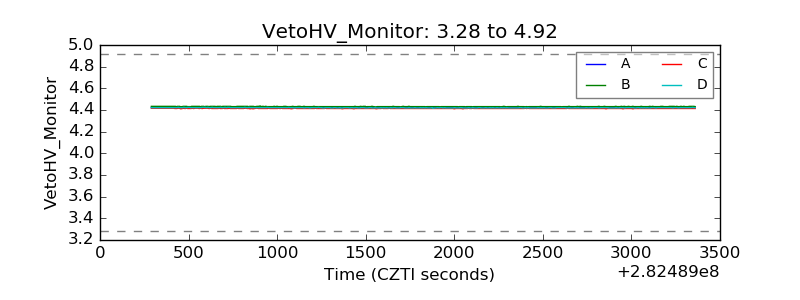 |
| Veto LLD | 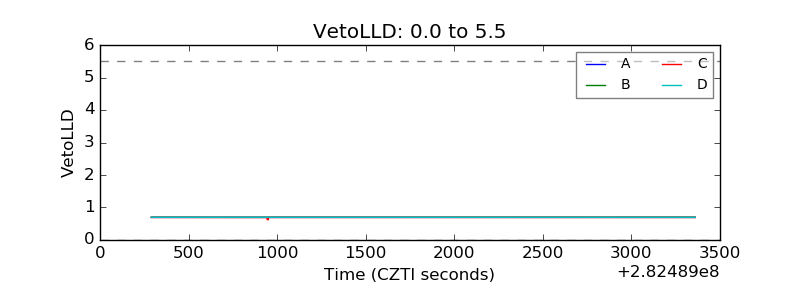 |
| Alpha Counter |  |
| _CPM_Rate |  |
| CZT Counter | 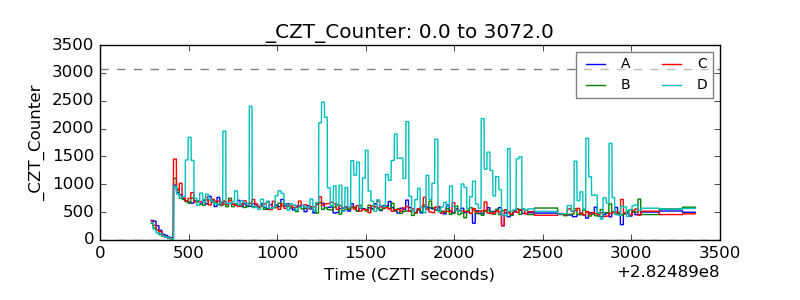 |
| +2.5 Volts monitor |  |
| +5 Volts monitor |  |
| _ROLL_ROT | 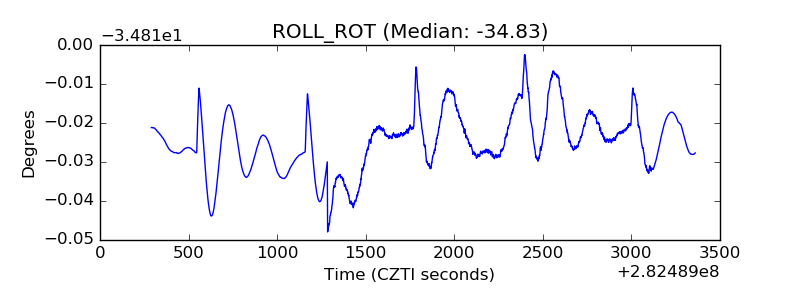 |
| _Roll_DEC | 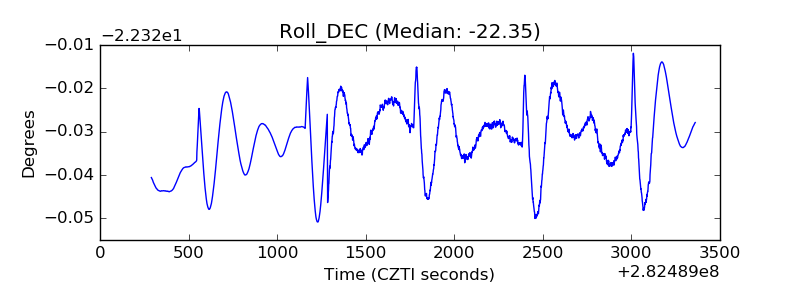 |
| _Roll_RA | 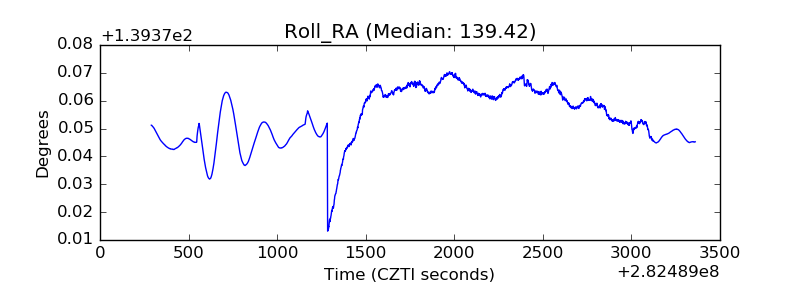 |
| Veto Counter | 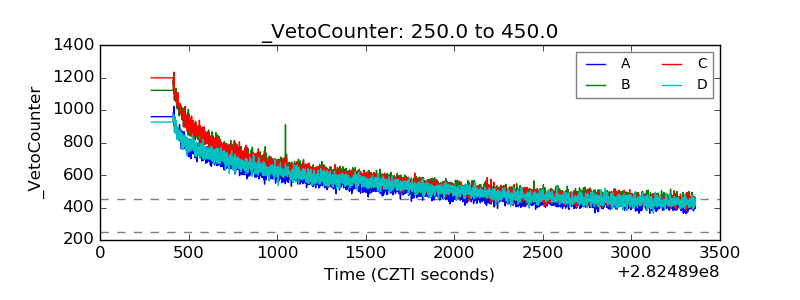 |