| Param | Original file | Final file |
|---|---|---|
| Filename | modeM0/AS1T03_071T01_9000002610_17625cztM0_level2.evt | modeM0/AS1T03_071T01_9000002610_17625cztM0_level2_quad_clean.evt |
| Size (bytes) | 555,546,240 | 95,840,640 |
| Size | 529.8 MB | 91.4 MB |
| Events in quadrant A | 3,397,228 | 614,132 |
| Events in quadrant B | 3,485,995 | 621,256 |
| Events in quadrant C | 3,620,704 | 591,285 |
| Events in quadrant D | 5,830,988 | 572,868 |
| Mode M0 | |||
|---|---|---|---|
| Quadrant | BADHDUFLAG | Total packets | Discarded packets |
| A | 0 | 14888 | 2 |
| B | 0 | 15037 | 3 |
| C | 0 | 15485 | 2 |
| D | 0 | 22440 | 2 |
| Mode SS | |||
|---|---|---|---|
| Quadrant | BADHDUFLAG | Total packets | Discarded packets |
| A | 0 | 150 | 0 |
| B | 0 | 150 | 0 |
| C | 0 | 150 | 0 |
| D | 0 | 150 | 0 |
| Mode M9 | |||
|---|---|---|---|
| Quadrant | BADHDUFLAG | Total packets | Discarded packets |
| A | 0 | 19 | 0 |
| B | 0 | 19 | 0 |
| C | 0 | 19 | 0 |
| D | 0 | 19 | 0 |
| Quadrant | Total seconds | Saturated seconds | Saturation percentage |
|---|---|---|---|
| A | 7215 | 20 | 0.277200% |
| B | 7215 | 62 | 0.859321% |
| C | 7215 | 95 | 1.316701% |
| D | 7215 | 648 | 8.981289% |
Noise dominated data is calculated using 1-second bins in cleaned event files. If a bin has >2000 counts, and if more than 50% of those come from <1% of pixels, then it is considered to be noise-dominated and hence unusable.
| Quadrant | # 1 sec bins | Bins with >0 counts | Bins with >2000 counts | High rate bins dominated by noise | Noise dominated (total time) | Noise dominated (detector-on time) | Marked lightcurve |
|---|---|---|---|---|---|---|---|
| A | 9145 | 7217 | 0 | 0 | 0.00% | 0.00% |  |
| B | 9145 | 7216 | 1 | 1 | 0.01% | 0.01% |  |
| C | 9145 | 7217 | 0 | 0 | 0.00% | 0.00% |  |
| D | 9145 | 7217 | 412 | 412 | 4.51% | 5.71% | 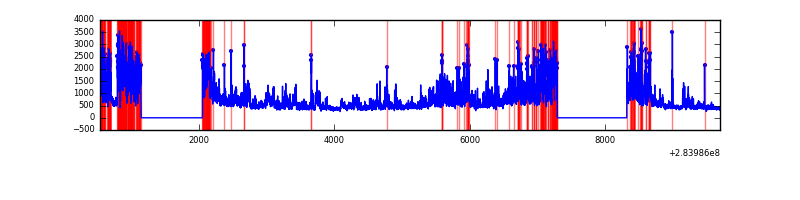 |
Top three noisy pixels from each quadrant. If the there are fewer than three noisy pixels in the level2.evt file, extra rows are filled as -1
| Pixel properties | Quadrant properties | ||||||
|---|---|---|---|---|---|---|---|
| Quadrant | DetID | PixID | Counts | Sigma | Mean | Median | Sigma |
| A | 14 | 237 | 39805 | 222.97 | 872 | 855 | 174.7 |
| A | 0 | 226 | 7666 | 38.99 | 872 | 855 | 174.7 |
| A | 3 | 137 | 6624 | 33.02 | 872 | 855 | 174.7 |
| B | 0 | 189 | 29366 | 171.48 | 872 | 850 | 166.3 |
| B | 12 | 111 | 20111 | 115.82 | 872 | 850 | 166.3 |
| B | 4 | 80 | 19951 | 114.86 | 872 | 850 | 166.3 |
| C | 3 | 233 | 194689 | 990.79 | 832 | 835 | 195.7 |
| C | 14 | 238 | 129219 | 656.17 | 832 | 835 | 195.7 |
| C | 0 | 207 | 44831 | 224.86 | 832 | 835 | 195.7 |
| D | 1 | 52 | 2338729 | 11802.33 | 813 | 789 | 198.1 |
| D | 13 | 189 | 235064 | 1182.66 | 813 | 789 | 198.1 |
| D | 4 | 239 | 66929 | 333.89 | 813 | 789 | 198.1 |
Histogram calculated using DETX and DETY for each event in the final _common_clean file
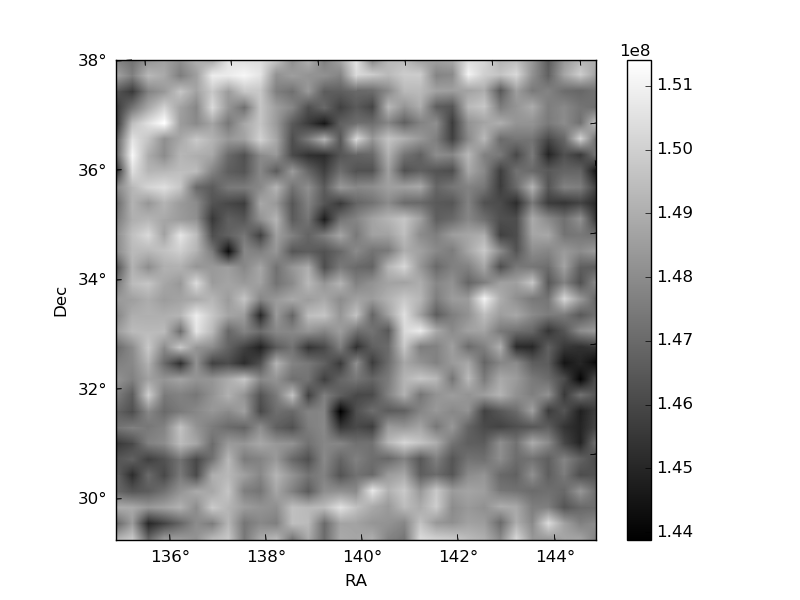
| Quadrant A | 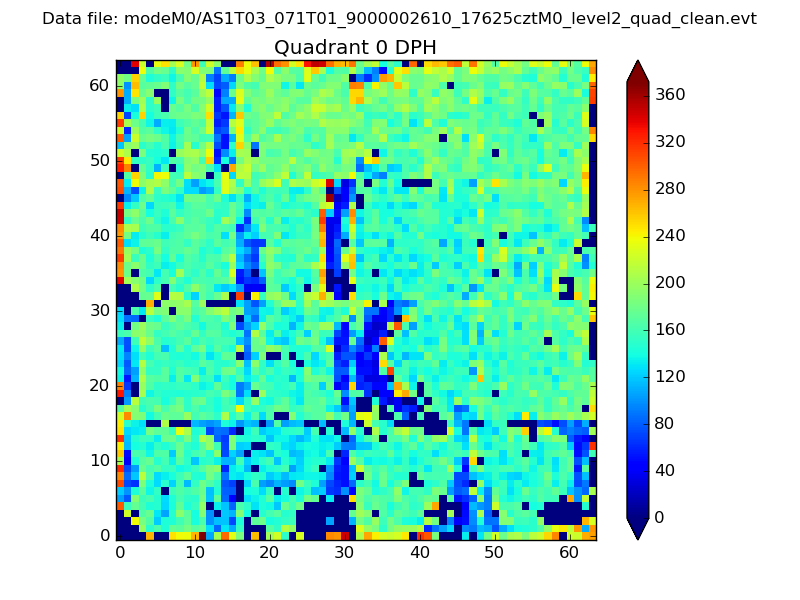 |
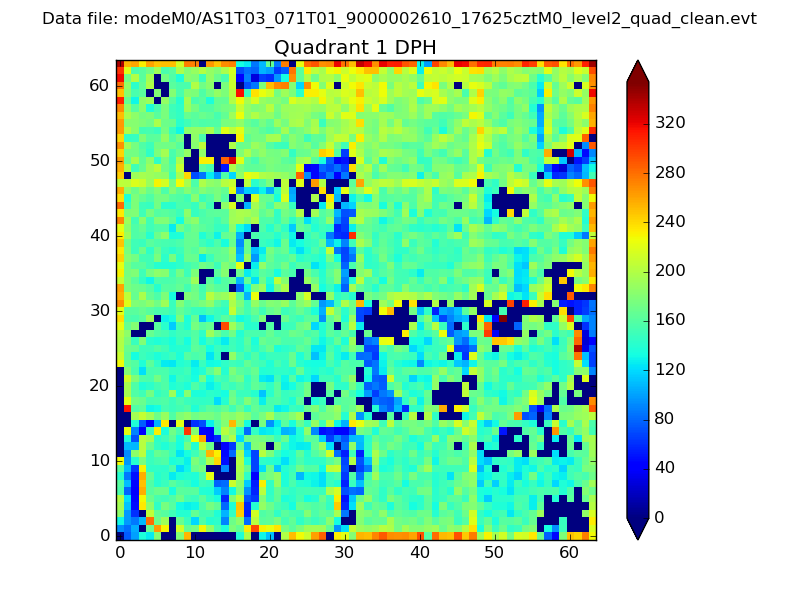 |
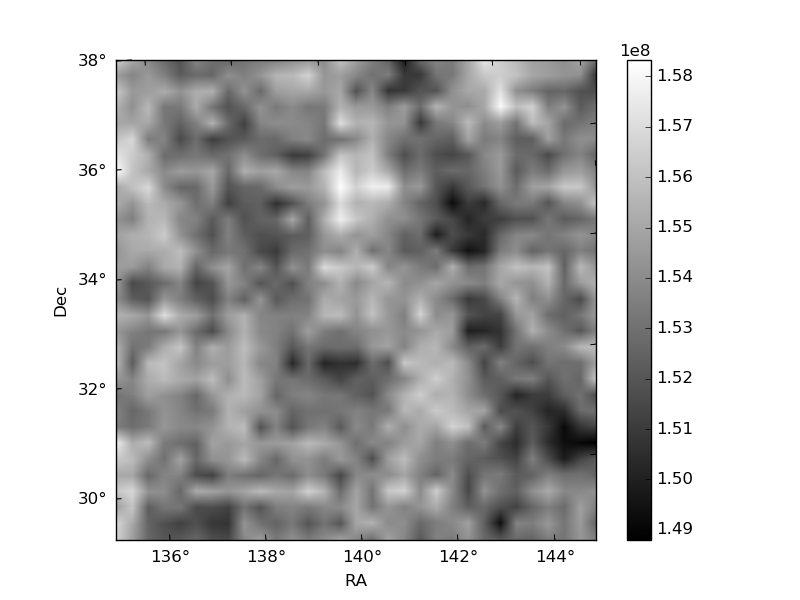
Quadrant B |
|---|---|---|---|
| Quadrant D | 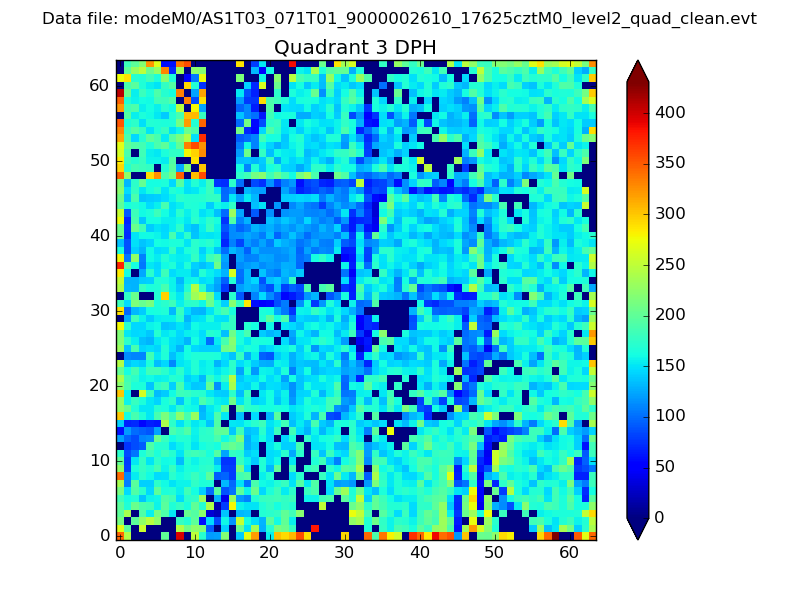 |
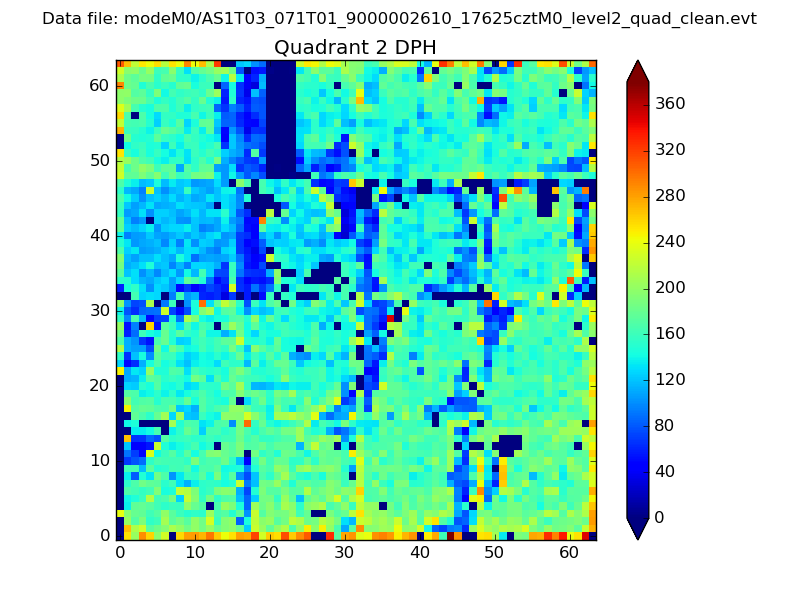 |
Quadrant C |
| Plot type | Count rate plots | Images |
|---|---|---|
| Comparison with Poisson distribution Blue bars denote a histogram of data divided into 1 sec bins. Red curve is a Poisson curve with rate = median count rate of data. |
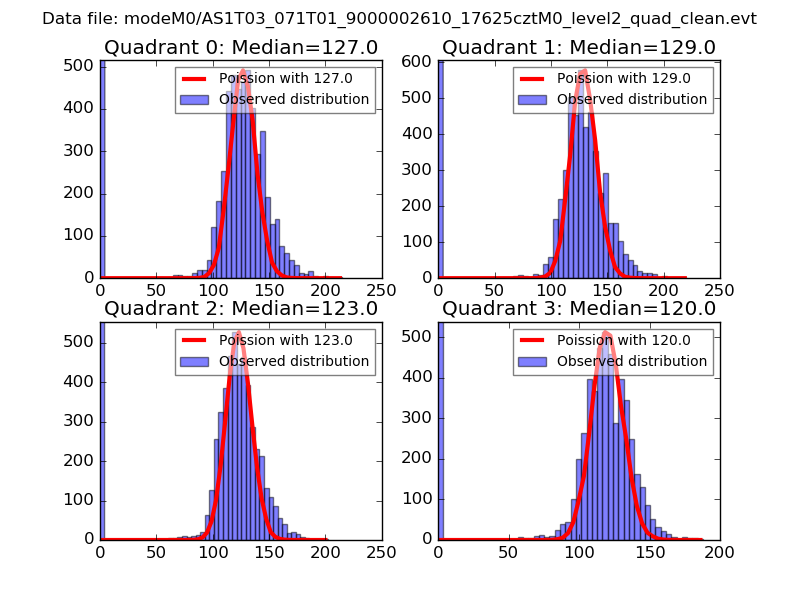 |
 |
| Quadrant-wise count rates Data is divided into 100 sec bins |
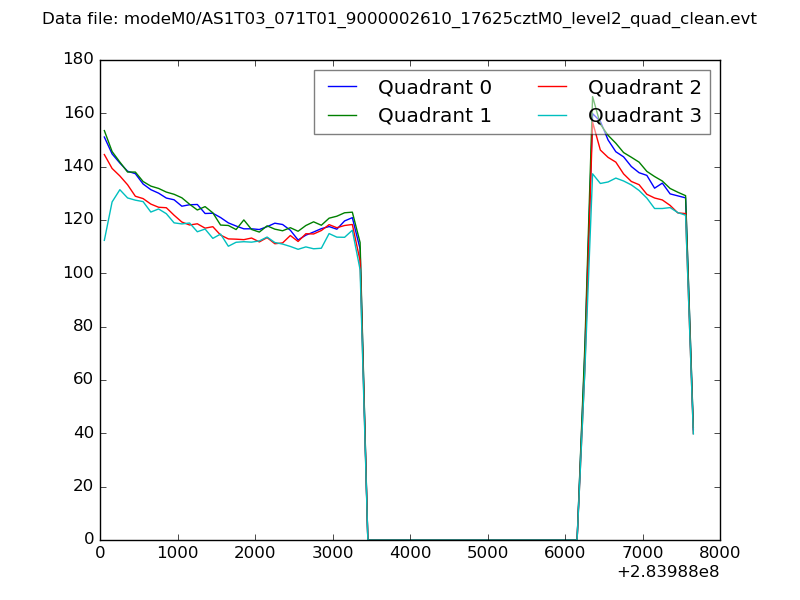 |
|
| Module-wise count rates for Quadrant A Data is divided into 100 sec bins |
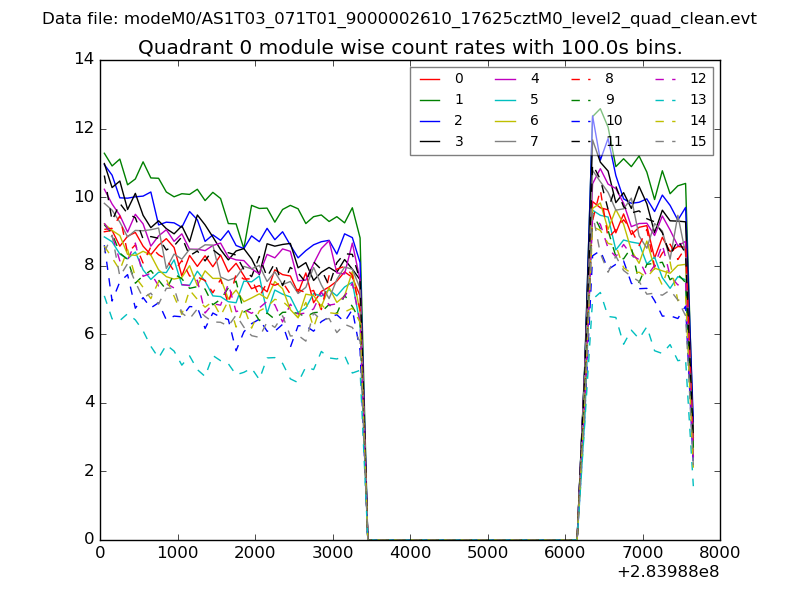 |
 |
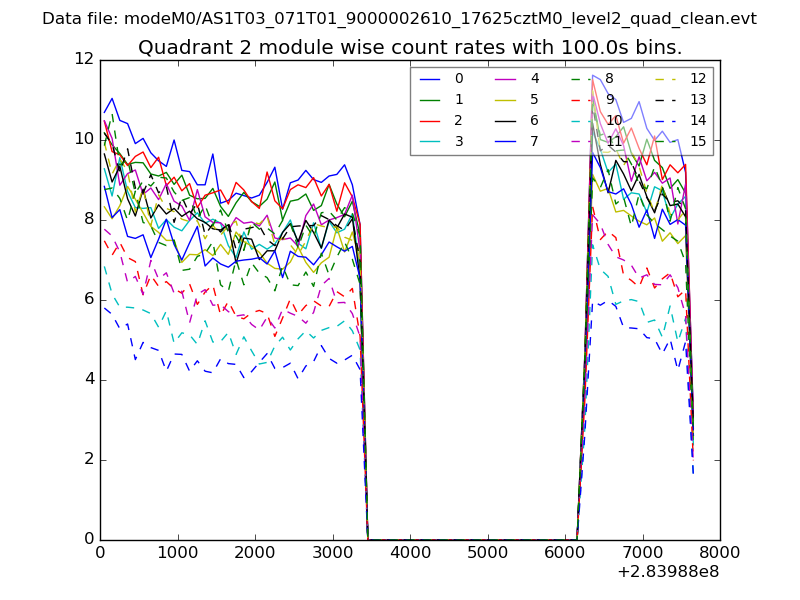
| Module-wise count rates for Quadrant B Data is divided into 100 sec bins |
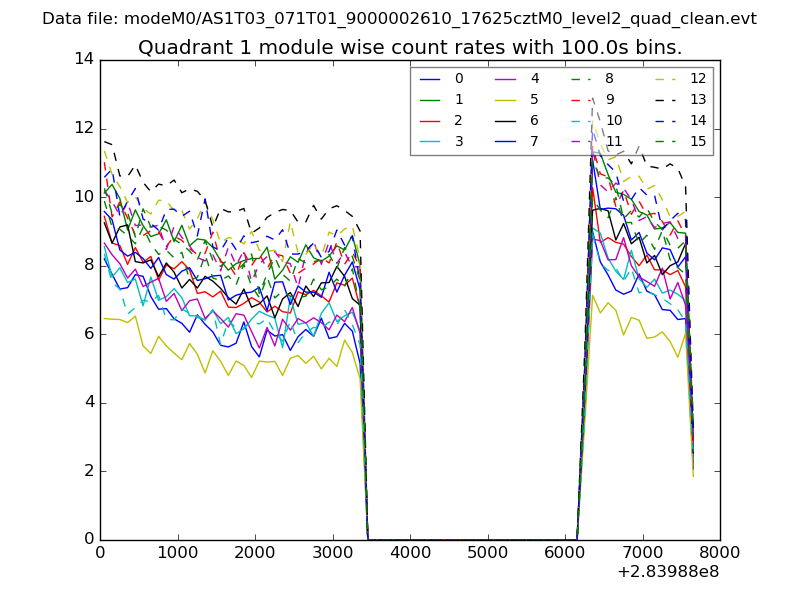 |
 |
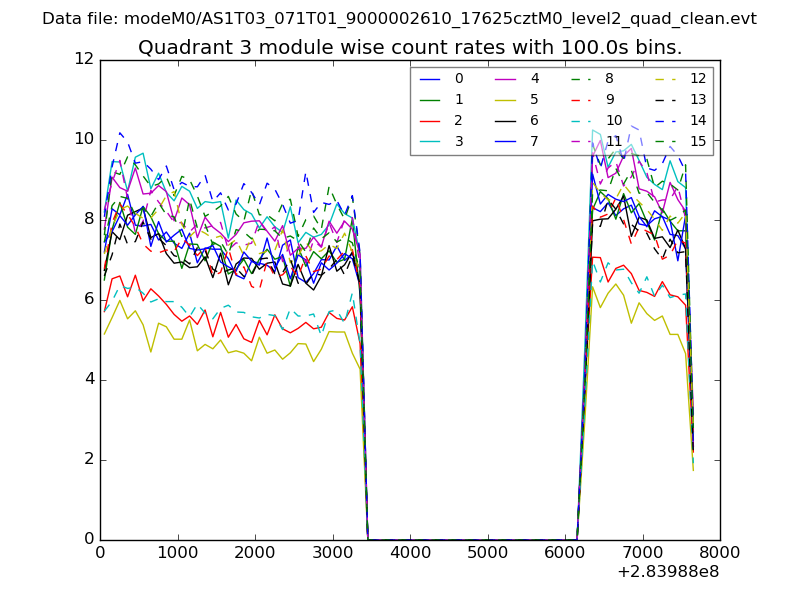
| Module-wise count rates for Quadrant C Data is divided into 100 sec bins |
 |
 |
| Module-wise count rates for Quadrant D Data is divided into 100 sec bins |
 |
 |
| Parameter | Plot |
|---|---|
| CZT HV Monitor | 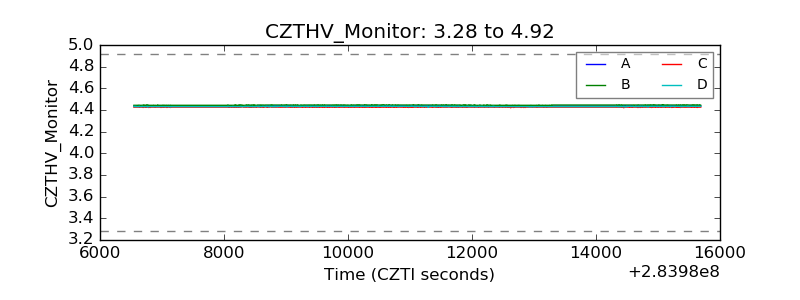 |
| D_VDD | 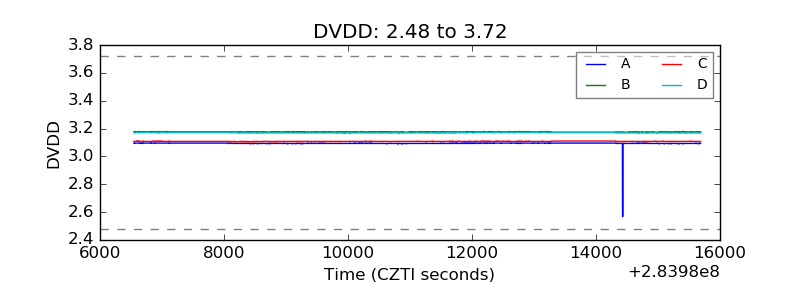 |
| Temperature 1 | 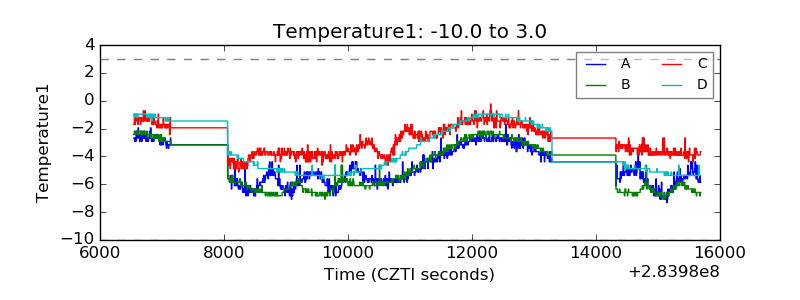 |
| Veto HV Monitor | 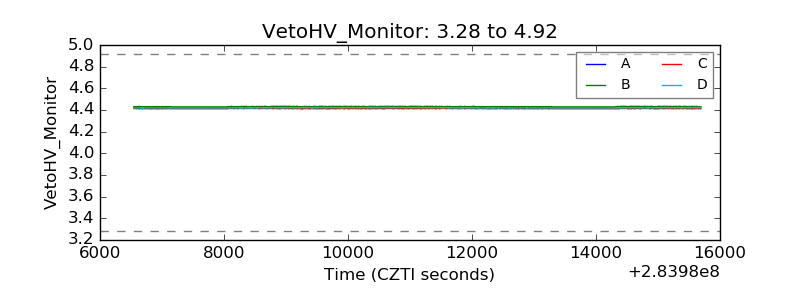 |
| Veto LLD | 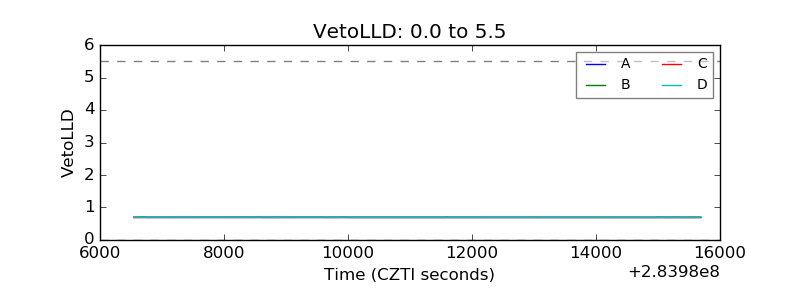 |
| Alpha Counter | 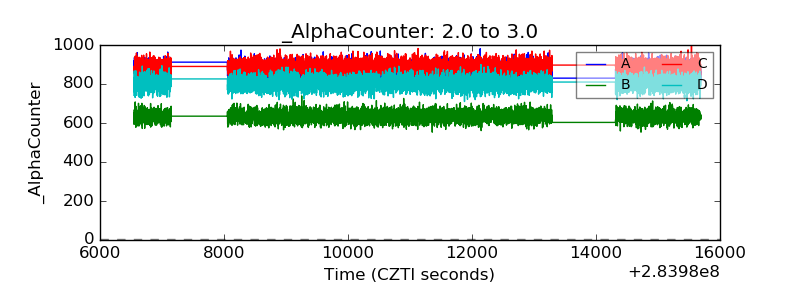 |
| _CPM_Rate | 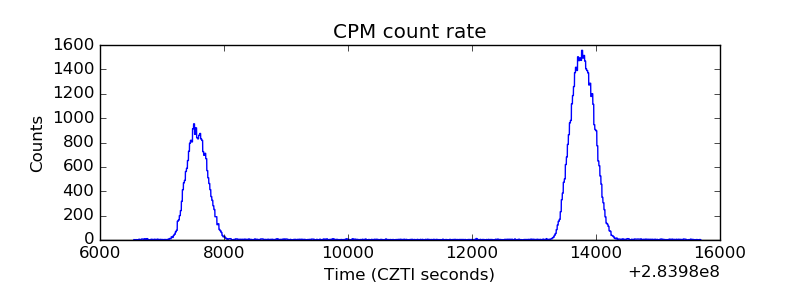 |
| CZT Counter | 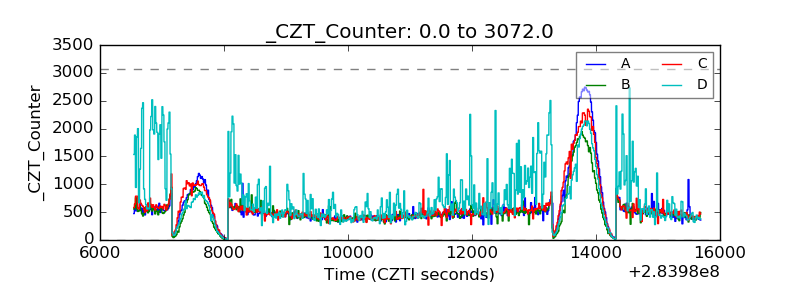 |
| +2.5 Volts monitor |  |
| +5 Volts monitor |  |
| _ROLL_ROT | 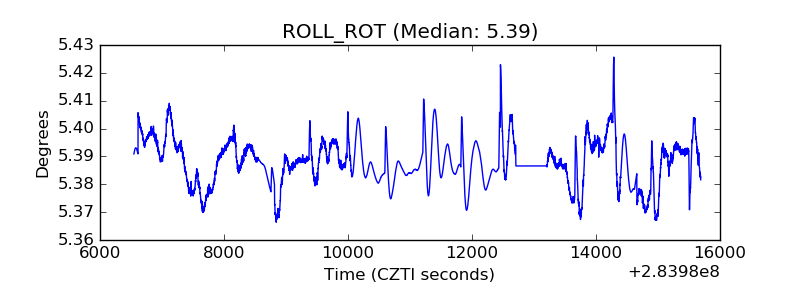 |
| _Roll_DEC |  |
| _Roll_RA | 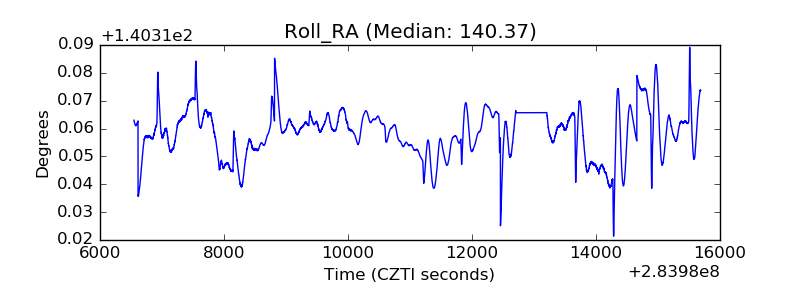 |
| Veto Counter | 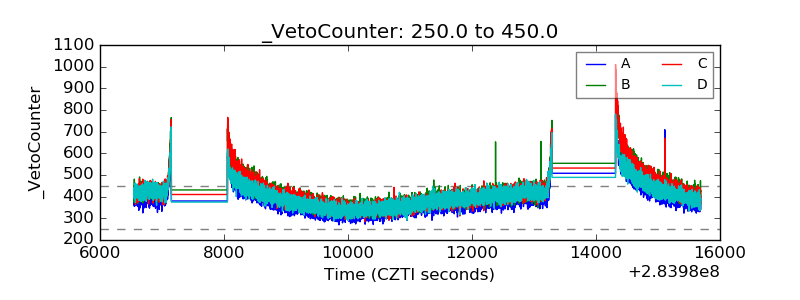 |