| Param | Original file | Final file |
|---|---|---|
| Filename | modeM0/AS1T03_042T01_9000002630_17736cztM0_level2.evt | modeM0/AS1T03_042T01_9000002630_17736cztM0_level2_quad_clean.evt |
| Size (bytes) | 279,653,760 | 41,437,440 |
| Size | 266.7 MB | 39.5 MB |
| Events in quadrant A | 2,255,305 | 242,682 |
| Events in quadrant B | 1,931,334 | 249,323 |
| Events in quadrant C | 1,857,762 | 237,441 |
| Events in quadrant D | 2,141,624 | 232,628 |
| Mode M0 | |||
|---|---|---|---|
| Quadrant | BADHDUFLAG | Total packets | Discarded packets |
| A | 0 | 9548 | 0 |
| B | 0 | 8525 | 0 |
| C | 0 | 8301 | 0 |
| D | 0 | 9177 | 0 |
| Mode SS | |||
|---|---|---|---|
| Quadrant | BADHDUFLAG | Total packets | Discarded packets |
| A | 0 | 84 | 0 |
| B | 0 | 84 | 0 |
| C | 0 | 84 | 0 |
| D | 0 | 84 | 0 |
| Quadrant | Total seconds | Saturated seconds | Saturation percentage |
|---|---|---|---|
| A | 4142 | 107 | 2.583293% |
| B | 4142 | 12 | 0.289715% |
| C | 4142 | 8 | 0.193143% |
| D | 4142 | 27 | 0.651859% |
Noise dominated data is calculated using 1-second bins in cleaned event files. If a bin has >2000 counts, and if more than 50% of those come from <1% of pixels, then it is considered to be noise-dominated and hence unusable.
| Quadrant | # 1 sec bins | Bins with >0 counts | Bins with >2000 counts | High rate bins dominated by noise | Noise dominated (total time) | Noise dominated (detector-on time) | Marked lightcurve |
|---|---|---|---|---|---|---|---|
| A | 4142 | 4142 | 100 | 100 | 2.41% | 2.41% | 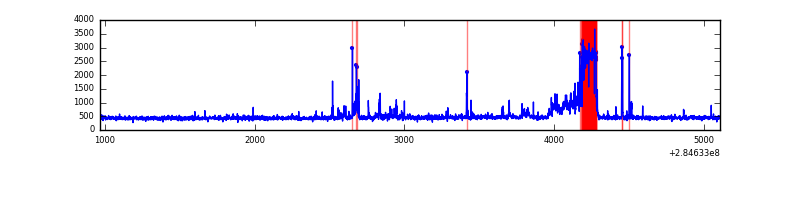 |
| B | 4142 | 4142 | 4 | 4 | 0.10% | 0.10% | 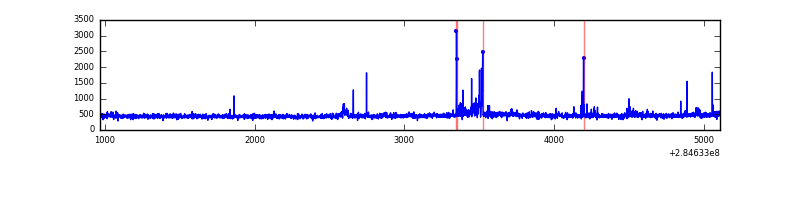 |
| C | 4142 | 4142 | 0 | 0 | 0.00% | 0.00% | 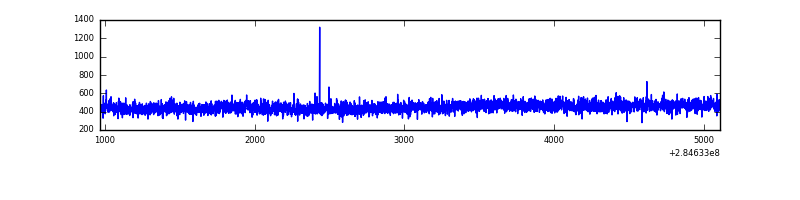 |
| D | 4142 | 4142 | 20 | 20 | 0.48% | 0.48% | 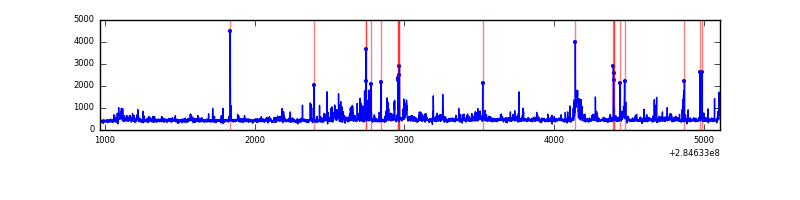 |
Top three noisy pixels from each quadrant. If the there are fewer than three noisy pixels in the level2.evt file, extra rows are filled as -1
| Pixel properties | Quadrant properties | ||||||
|---|---|---|---|---|---|---|---|
| Quadrant | DetID | PixID | Counts | Sigma | Mean | Median | Sigma |
| A | 15 | 174 | 462201 | 4853.68 | 463 | 453 | 95.1 |
| A | 14 | 237 | 11236 | 113.34 | 463 | 453 | 95.1 |
| A | 0 | 226 | 4039 | 37.69 | 463 | 453 | 95.1 |
| B | 7 | 220 | 46971 | 513.51 | 467 | 455 | 90.6 |
| B | 0 | 219 | 19511 | 210.37 | 467 | 455 | 90.6 |
| B | 0 | 230 | 11398 | 120.8 | 467 | 455 | 90.6 |
| C | 14 | 238 | 70157 | 656.41 | 450 | 453 | 106.2 |
| C | 5 | 218 | 10058 | 90.45 | 450 | 453 | 106.2 |
| C | 3 | 233 | 9997 | 89.88 | 450 | 453 | 106.2 |
| D | 1 | 52 | 290773 | 2541.2 | 454 | 441 | 114.2 |
| D | 6 | 112 | 26386 | 227.09 | 454 | 441 | 114.2 |
| D | 2 | 165 | 24108 | 207.15 | 454 | 441 | 114.2 |
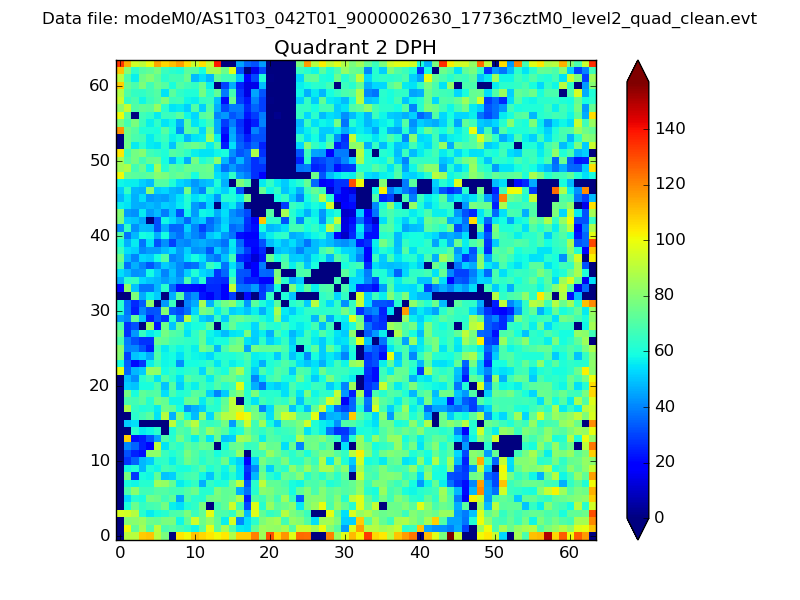
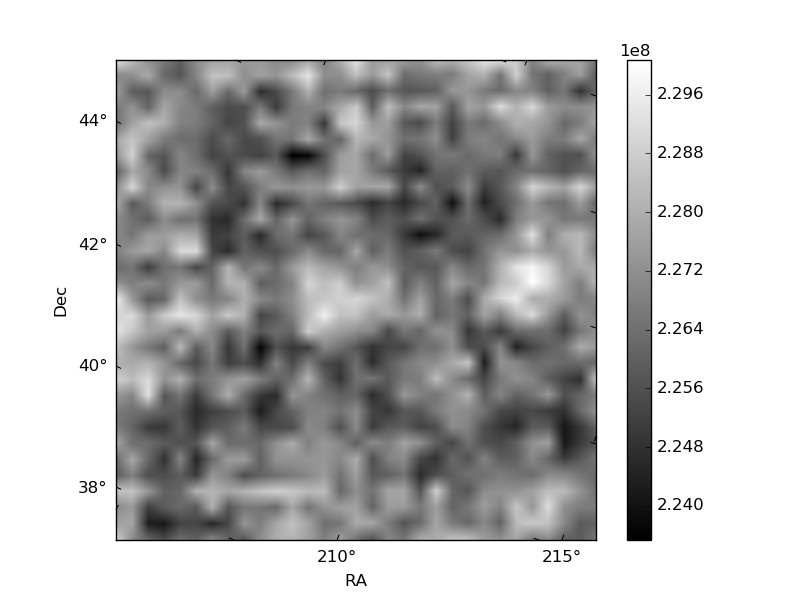
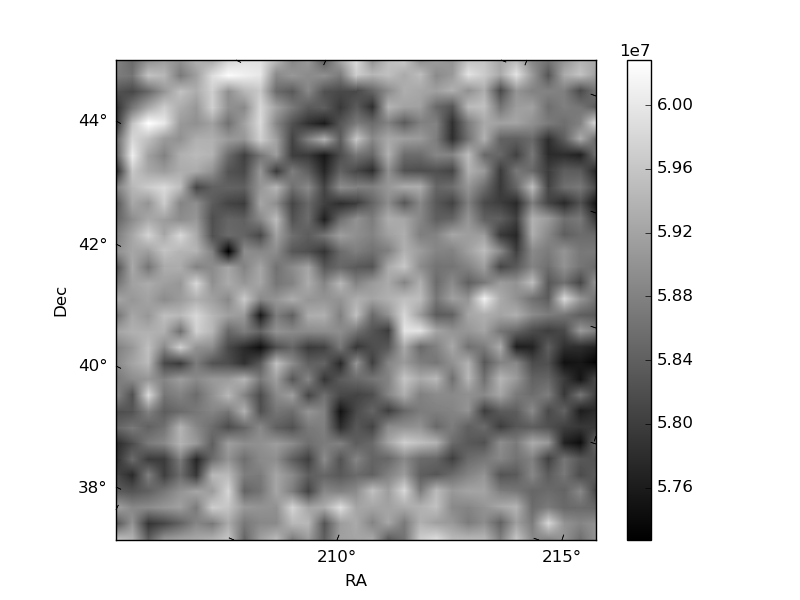
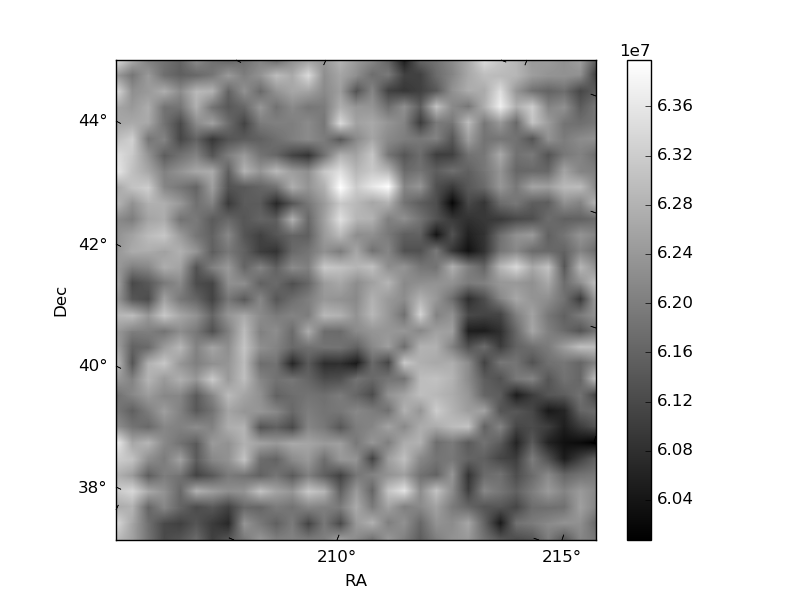
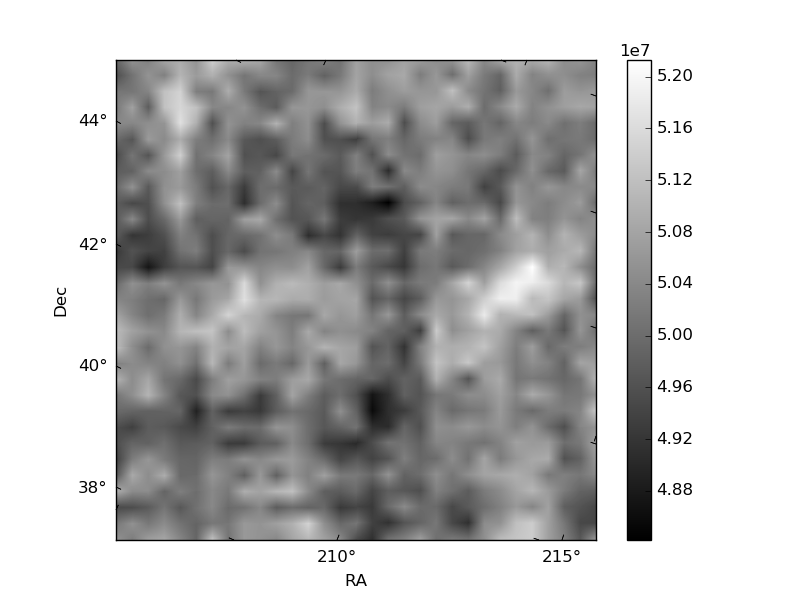
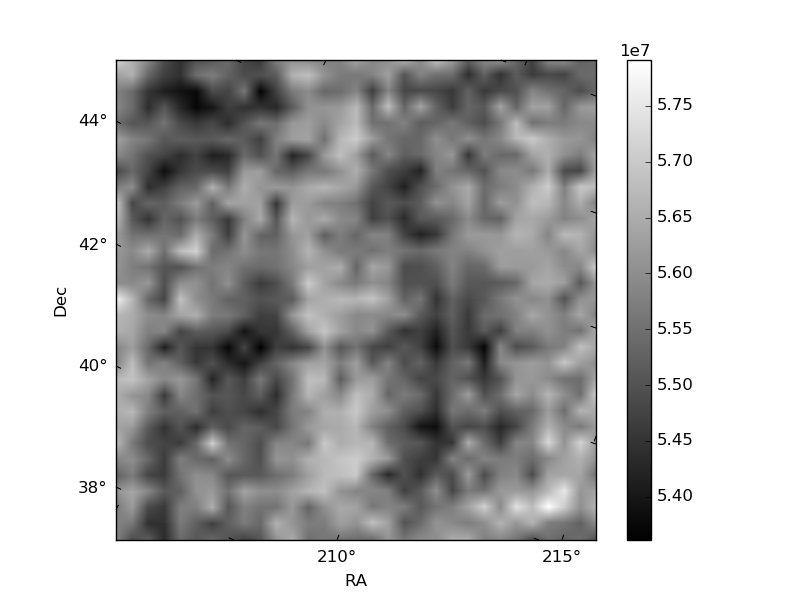
Histogram calculated using DETX and DETY for each event in the final _common_clean file
| Quadrant A | 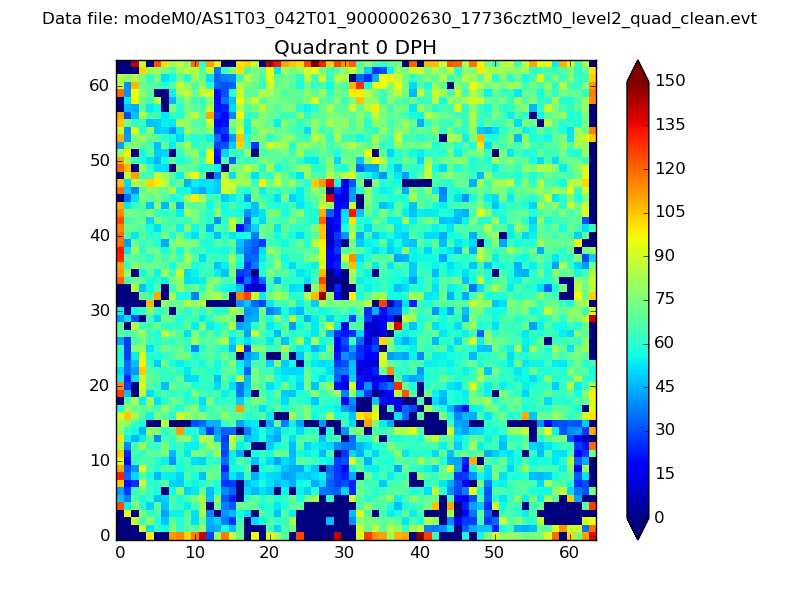 |
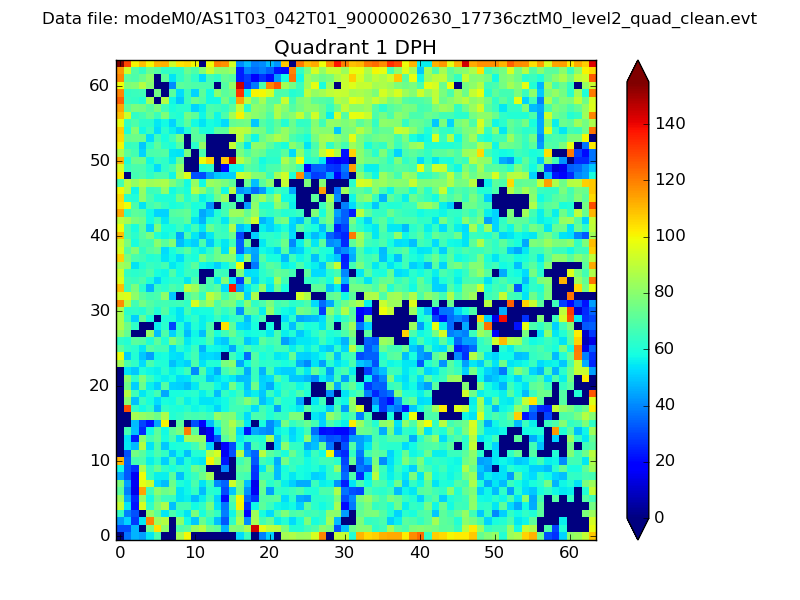 |
Quadrant B |
|---|---|---|---|
| Quadrant D | 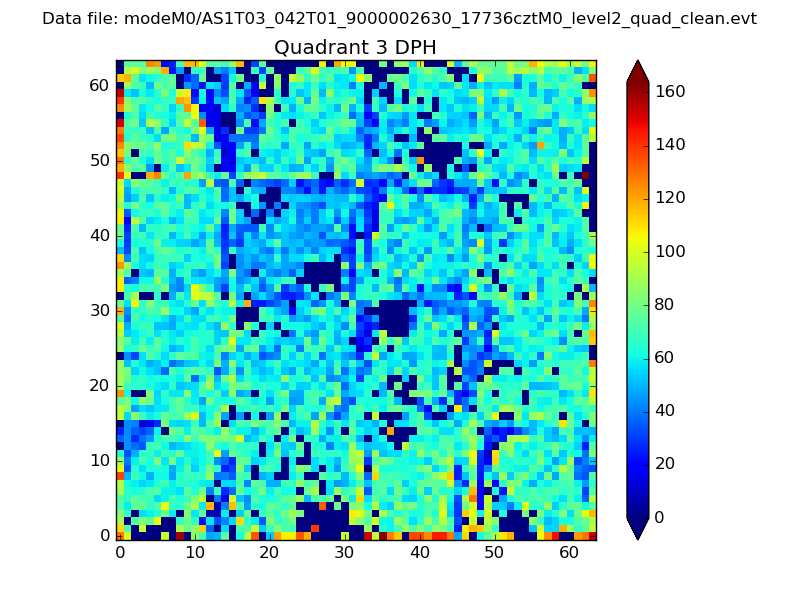 |
 |
Quadrant C |
| Plot type | Count rate plots | Images |
|---|---|---|
| Comparison with Poisson distribution Blue bars denote a histogram of data divided into 1 sec bins. Red curve is a Poisson curve with rate = median count rate of data. |
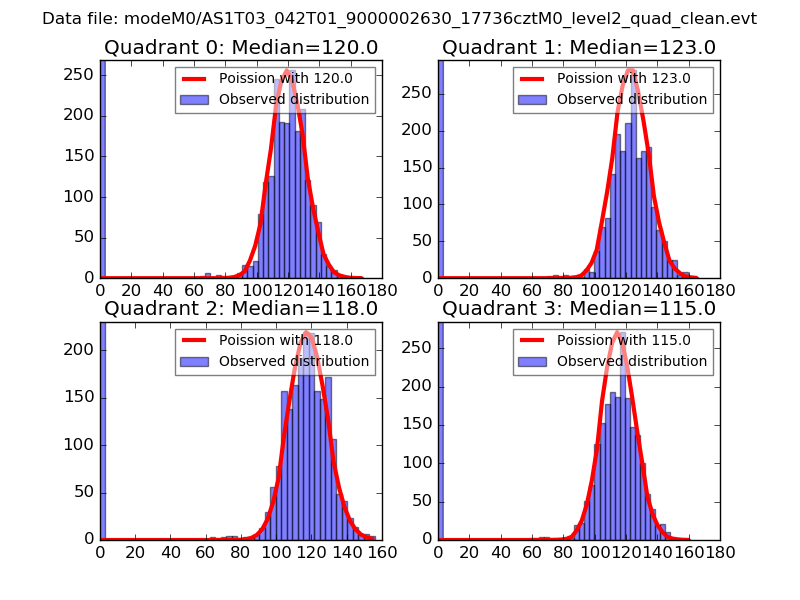 |
 |
| Quadrant-wise count rates Data is divided into 100 sec bins |
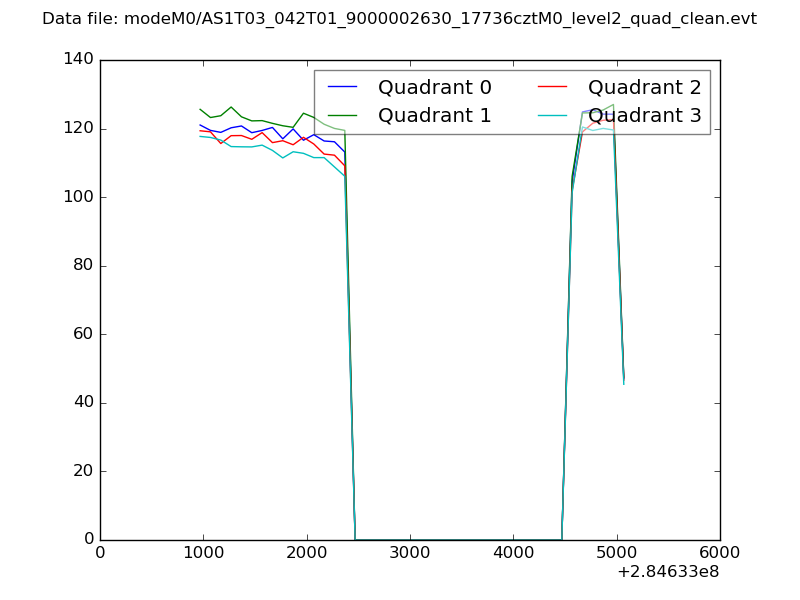 |
|
| Module-wise count rates for Quadrant A Data is divided into 100 sec bins |
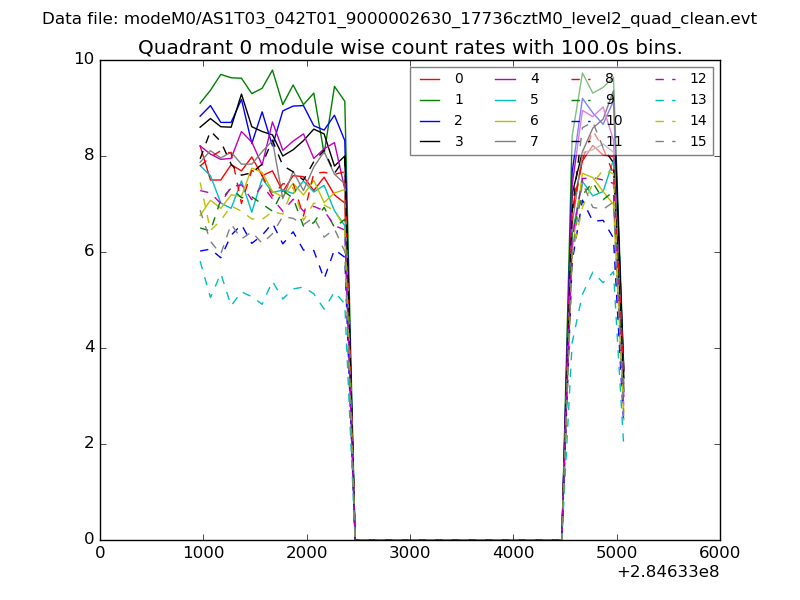 |
 |
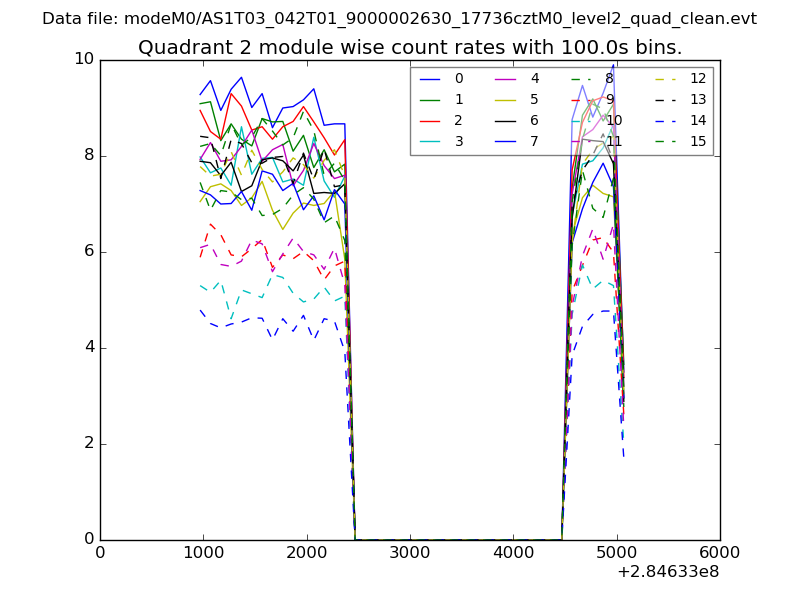
| Module-wise count rates for Quadrant B Data is divided into 100 sec bins |
 |
 |
| Module-wise count rates for Quadrant C Data is divided into 100 sec bins |
 |
 |
| Module-wise count rates for Quadrant D Data is divided into 100 sec bins |
 |
 |
| Parameter | Plot |
|---|---|
| CZT HV Monitor |  |
| D_VDD | 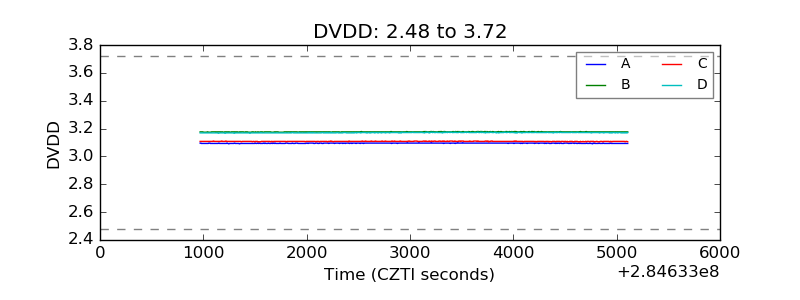 |
| Temperature 1 | 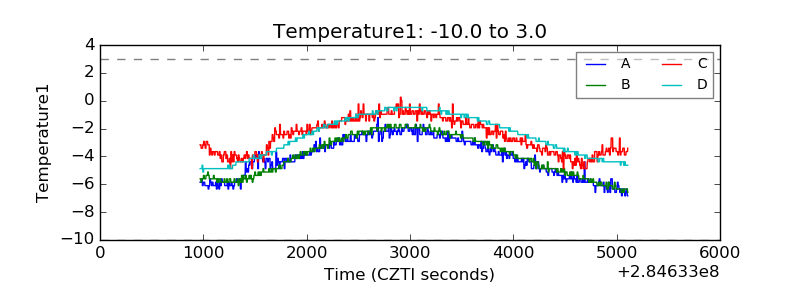 |
| Veto HV Monitor | 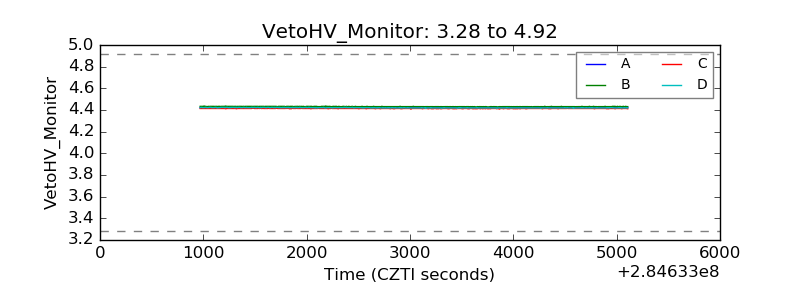 |
| Veto LLD |  |
| Alpha Counter | 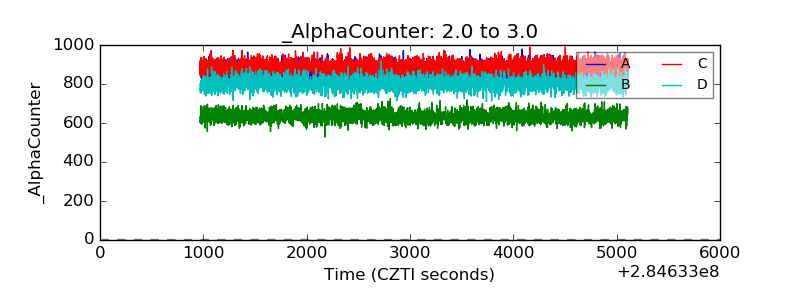 |
| _CPM_Rate | 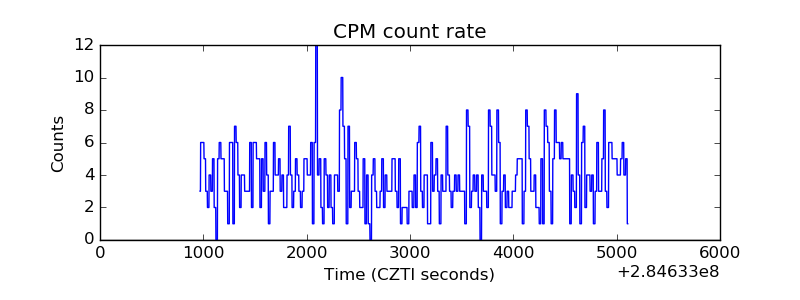 |
| CZT Counter | 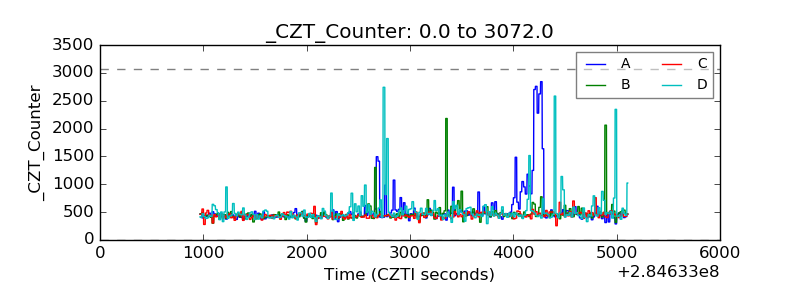 |
| +2.5 Volts monitor |  |
| +5 Volts monitor |  |
| _ROLL_ROT |  |
| _Roll_DEC | 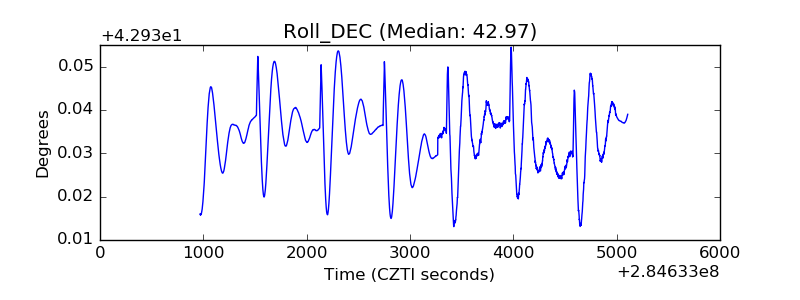 |
| _Roll_RA | 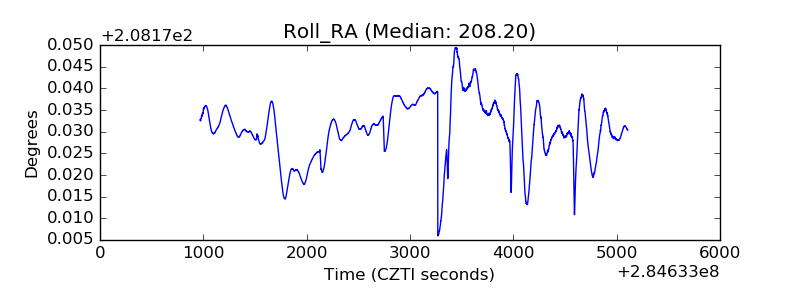 |
| Veto Counter | 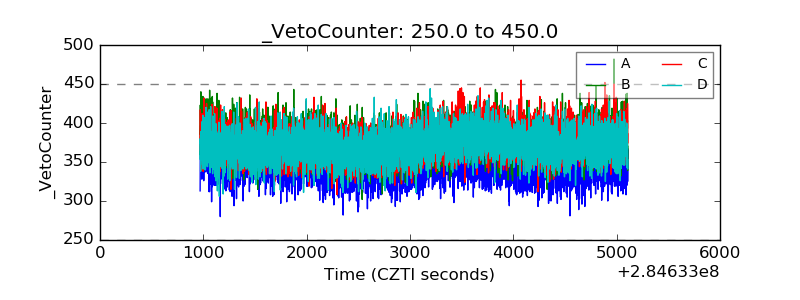 |