| Param | Original file | Final file |
|---|---|---|
| Filename | modeM0/AS1A05_085T01_9000002658_17865cztM0_level2.evt | modeM0/AS1A05_085T01_9000002658_17865cztM0_level2_quad_clean.evt |
| Size (bytes) | 550,840,320 | 109,373,760 |
| Size | 525.3 MB | 104.3 MB |
| Events in quadrant A | 3,666,813 | 709,599 |
| Events in quadrant B | 3,746,519 | 710,801 |
| Events in quadrant C | 4,079,273 | 680,481 |
| Events in quadrant D | 4,656,255 | 664,899 |
| Mode SS | |||
|---|---|---|---|
| Quadrant | BADHDUFLAG | Total packets | Discarded packets |
| A | 0 | 160 | 0 |
| B | 0 | 160 | 0 |
| C | 0 | 160 | 0 |
| D | 0 | 160 | 0 |
| Mode M9 | |||
|---|---|---|---|
| Quadrant | BADHDUFLAG | Total packets | Discarded packets |
| A | 0 | 14 | 0 |
| B | 0 | 14 | 0 |
| C | 0 | 14 | 0 |
| D | 0 | 14 | 0 |
| Mode M0 | |||
|---|---|---|---|
| Quadrant | BADHDUFLAG | Total packets | Discarded packets |
| A | 0 | 16160 | 2 |
| B | 0 | 16241 | 2 |
| C | 0 | 17063 | 3 |
| D | 0 | 19342 | 2 |
| Quadrant | Total seconds | Saturated seconds | Saturation percentage |
|---|---|---|---|
| A | 7864 | 46 | 0.584944% |
| B | 7864 | 95 | 1.208037% |
| C | 7864 | 143 | 1.818413% |
| D | 7864 | 331 | 4.209054% |
Noise dominated data is calculated using 1-second bins in cleaned event files. If a bin has >2000 counts, and if more than 50% of those come from <1% of pixels, then it is considered to be noise-dominated and hence unusable.
| Quadrant | # 1 sec bins | Bins with >0 counts | Bins with >2000 counts | High rate bins dominated by noise | Noise dominated (total time) | Noise dominated (detector-on time) | Marked lightcurve |
|---|---|---|---|---|---|---|---|
| A | 9144 | 7866 | 0 | 0 | 0.00% | 0.00% | 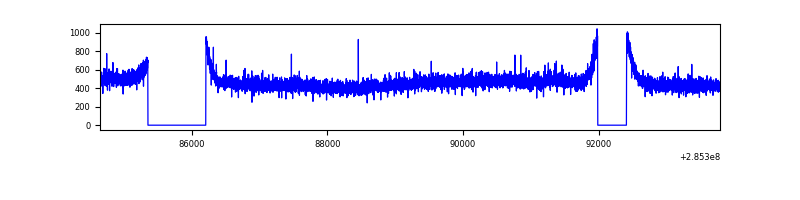 |
| B | 9144 | 7866 | 0 | 0 | 0.00% | 0.00% | 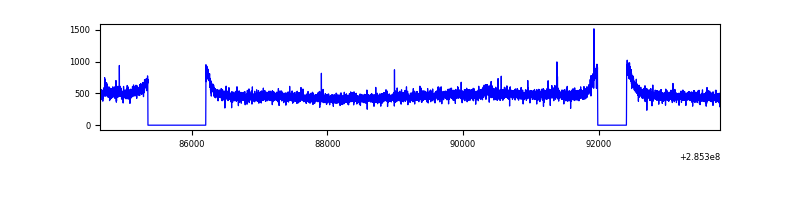 |
| C | 9144 | 7866 | 0 | 0 | 0.00% | 0.00% | 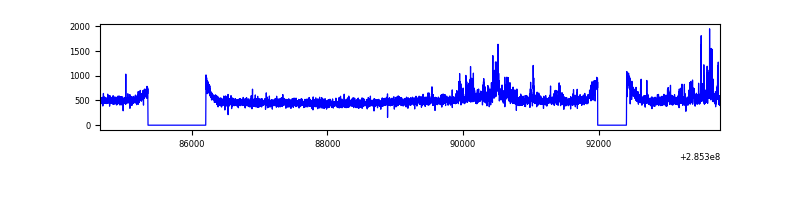 |
| D | 9144 | 7865 | 212 | 212 | 2.32% | 2.70% | 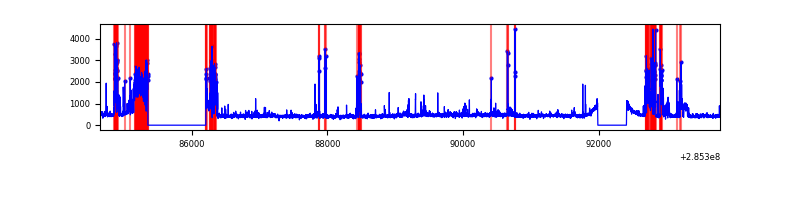 |
Top three noisy pixels from each quadrant. If the there are fewer than three noisy pixels in the level2.evt file, extra rows are filled as -1
| Pixel properties | Quadrant properties | ||||||
|---|---|---|---|---|---|---|---|
| Quadrant | DetID | PixID | Counts | Sigma | Mean | Median | Sigma |
| A | 15 | 174 | 9302 | 43.86 | 952 | 935 | 190.8 |
| A | 0 | 226 | 8315 | 38.69 | 952 | 935 | 190.8 |
| A | 3 | 137 | 7542 | 34.63 | 952 | 935 | 190.8 |
| B | 12 | 111 | 22523 | 116.91 | 952 | 927 | 184.7 |
| B | 11 | 111 | 19187 | 98.85 | 952 | 927 | 184.7 |
| B | 14 | 111 | 16866 | 86.29 | 952 | 927 | 184.7 |
| C | 3 | 233 | 298617 | 1374.95 | 914 | 918 | 216.5 |
| C | 14 | 238 | 140172 | 643.16 | 914 | 918 | 216.5 |
| C | 5 | 218 | 59212 | 269.24 | 914 | 918 | 216.5 |
| D | 7 | 238 | 1132542 | 5208.33 | 907 | 885 | 217.3 |
| D | 1 | 52 | 42979 | 193.73 | 907 | 885 | 217.3 |
| D | 2 | 234 | 34293 | 153.75 | 907 | 885 | 217.3 |
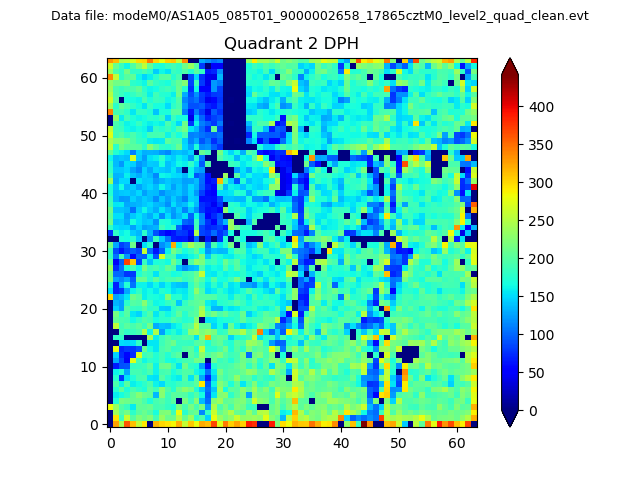
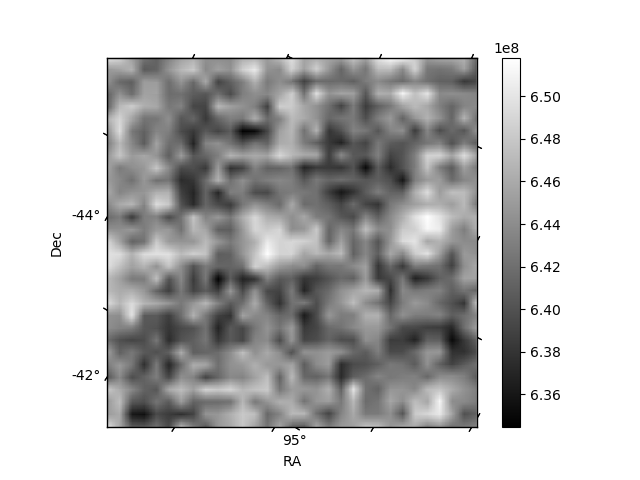
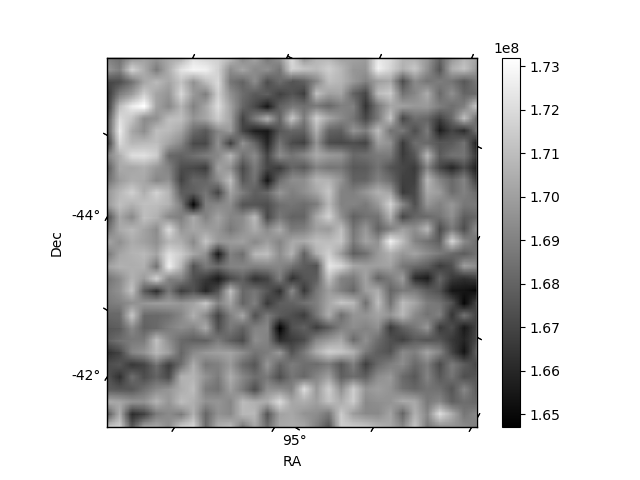
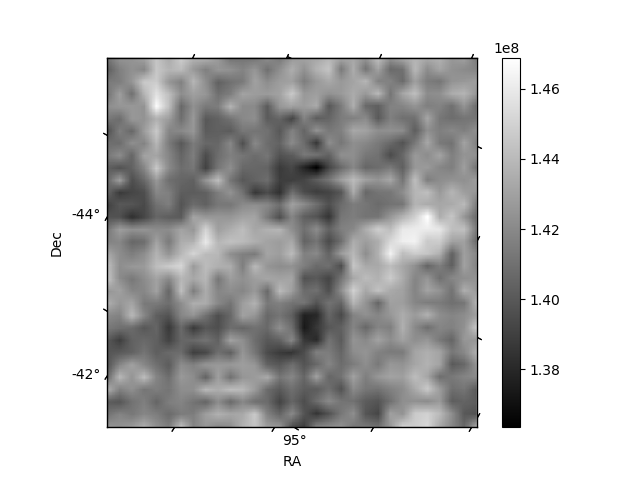
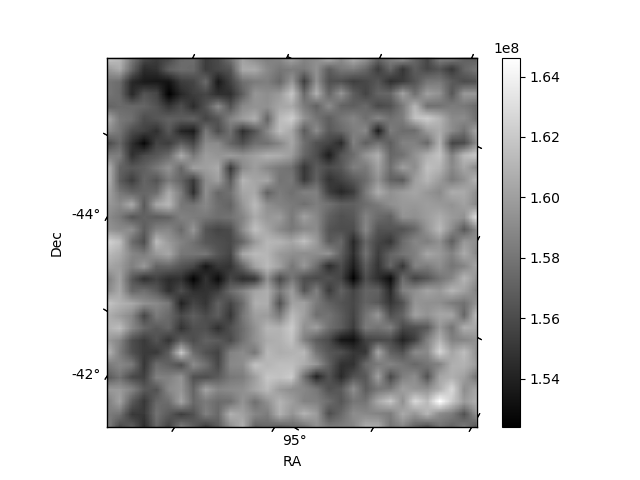
Histogram calculated using DETX and DETY for each event in the final _common_clean file
| Quadrant A | 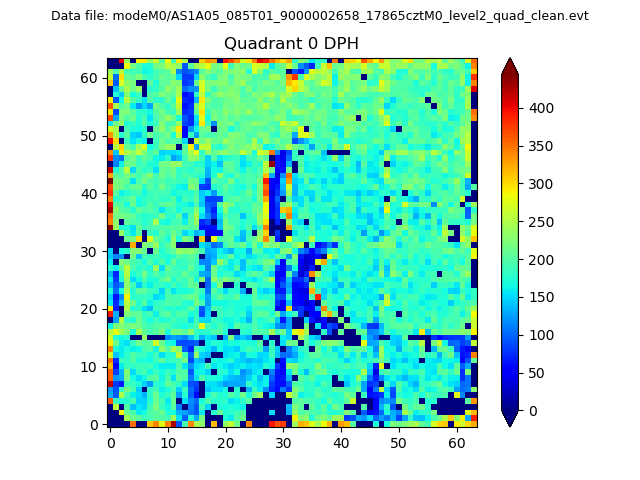 |
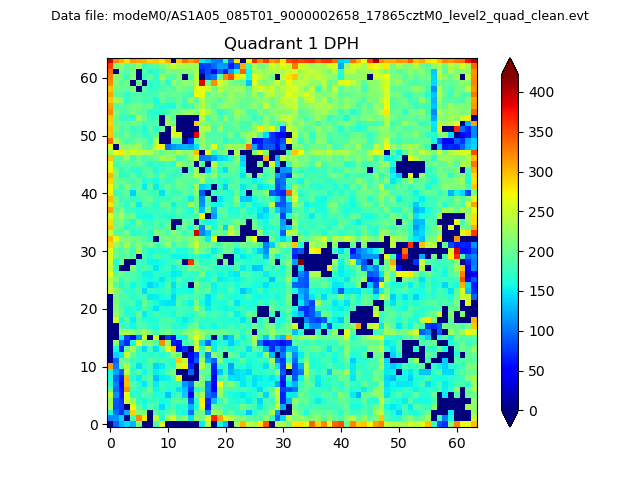 |
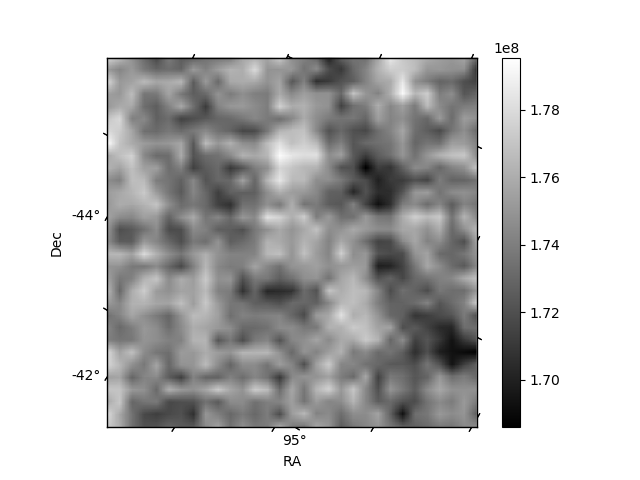
Quadrant B |
|---|---|---|---|
| Quadrant D | 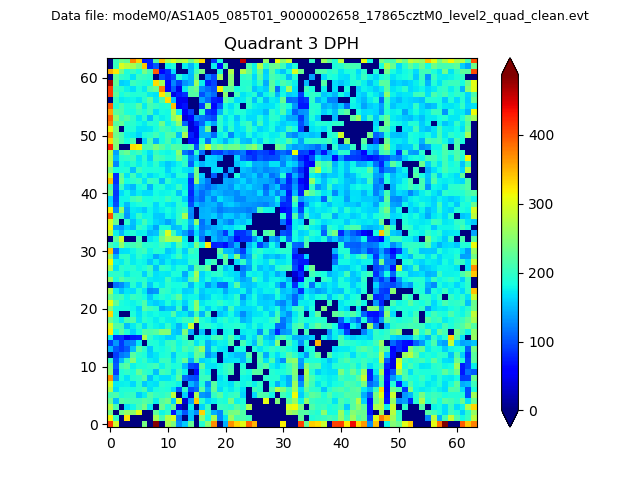 |
 |
Quadrant C |
| Plot type | Count rate plots | Images |
|---|---|---|
| Comparison with Poisson distribution Blue bars denote a histogram of data divided into 1 sec bins. Red curve is a Poisson curve with rate = median count rate of data. |
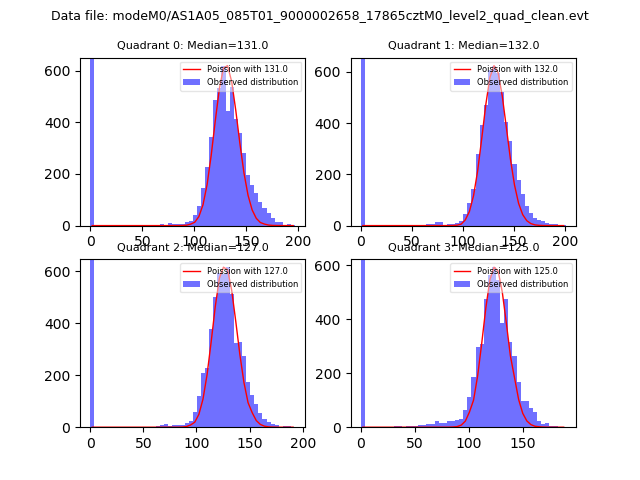 |
 |
| Quadrant-wise count rates Data is divided into 100 sec bins |
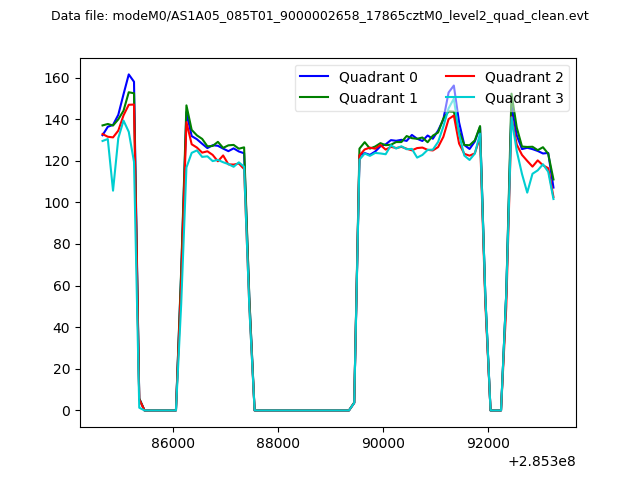 |
|
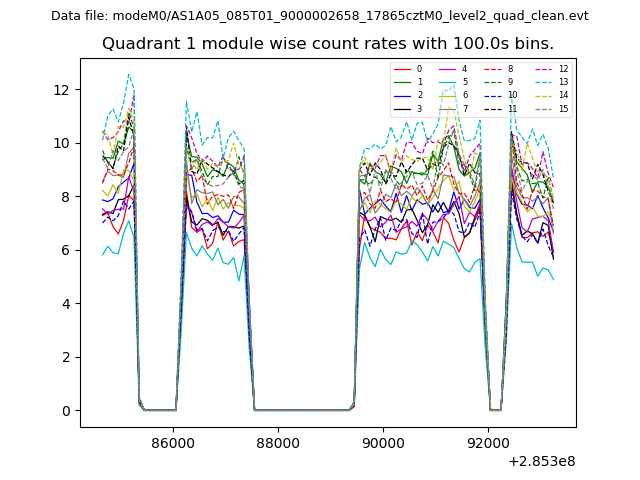
| Module-wise count rates for Quadrant A Data is divided into 100 sec bins |
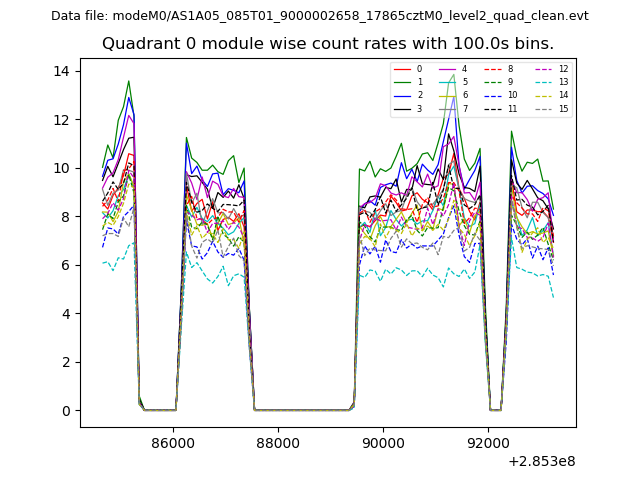 |
 |
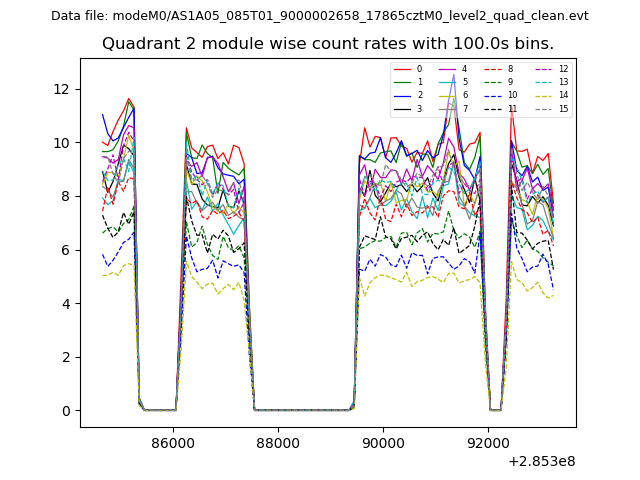
| Module-wise count rates for Quadrant B Data is divided into 100 sec bins |
 |
 |
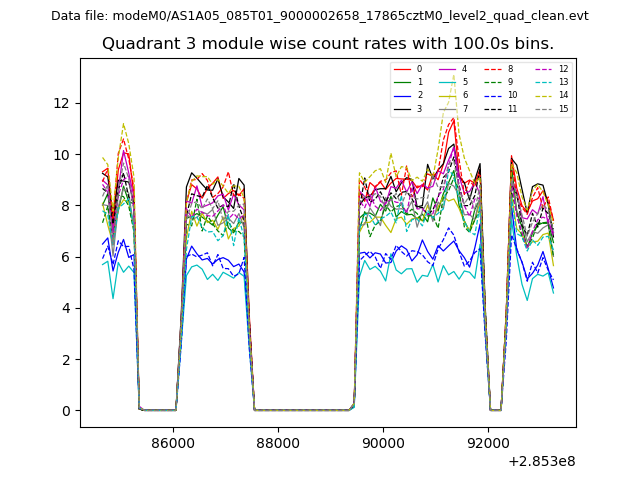
| Module-wise count rates for Quadrant C Data is divided into 100 sec bins |
 |
 |
| Module-wise count rates for Quadrant D Data is divided into 100 sec bins |
 |
 |
| Parameter | Plot |
|---|---|
| CZT HV Monitor | 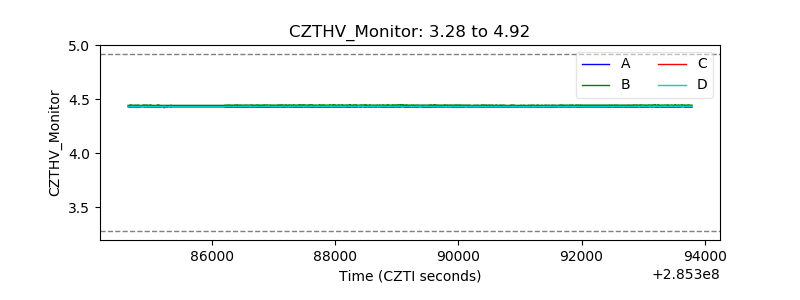 |
| D_VDD | 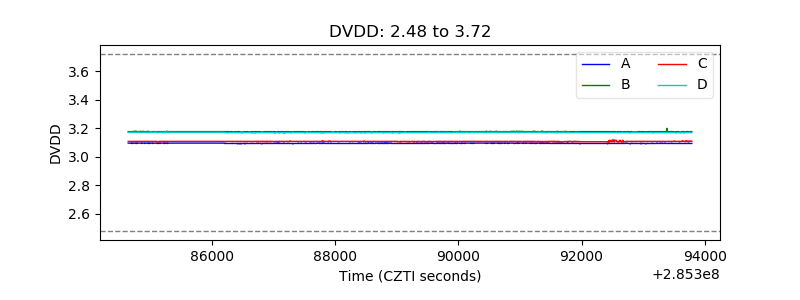 |
| Temperature 1 | 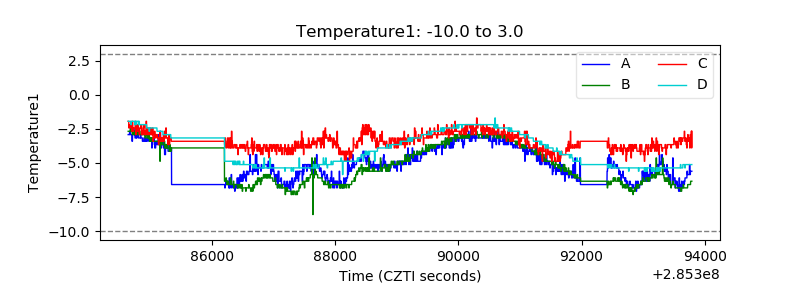 |
| Veto HV Monitor | 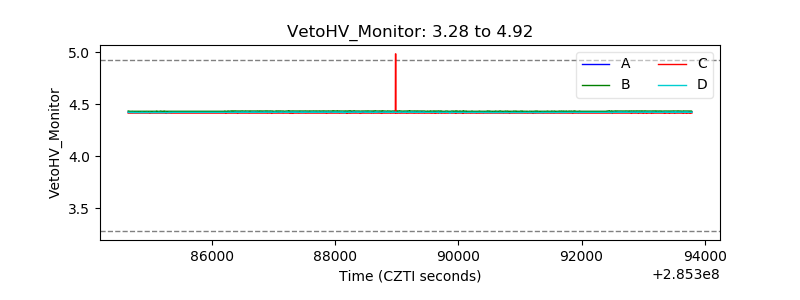 |
| Veto LLD | 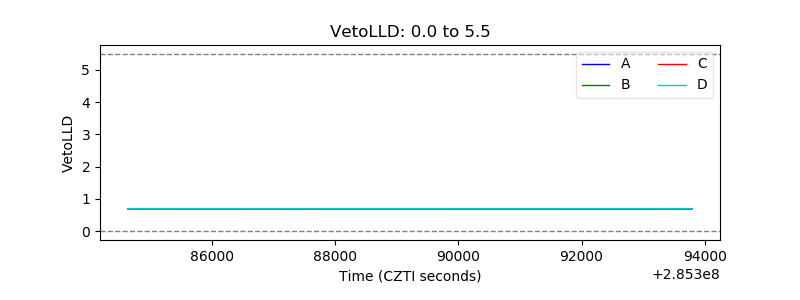 |
| Alpha Counter | 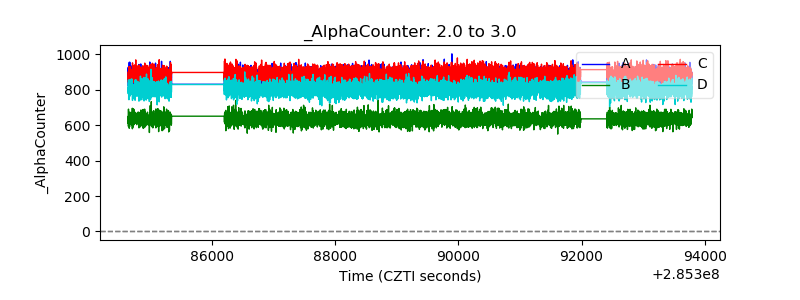 |
| _CPM_Rate | 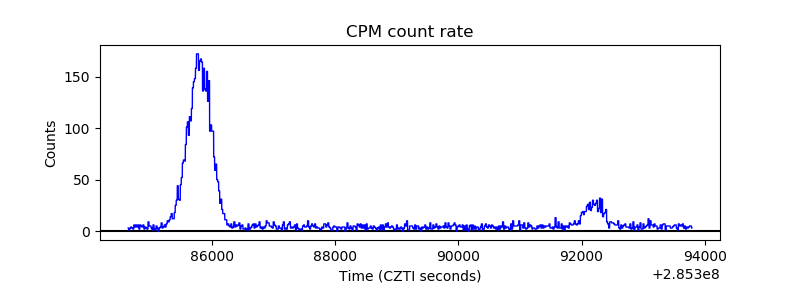 |
| CZT Counter | 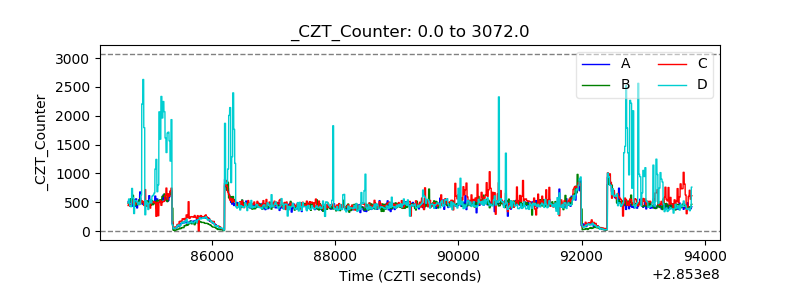 |
| +2.5 Volts monitor |  |
| +5 Volts monitor |  |
| _ROLL_ROT | 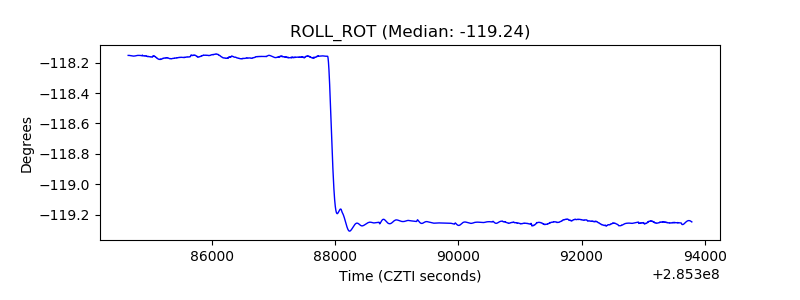 |
| _Roll_DEC | 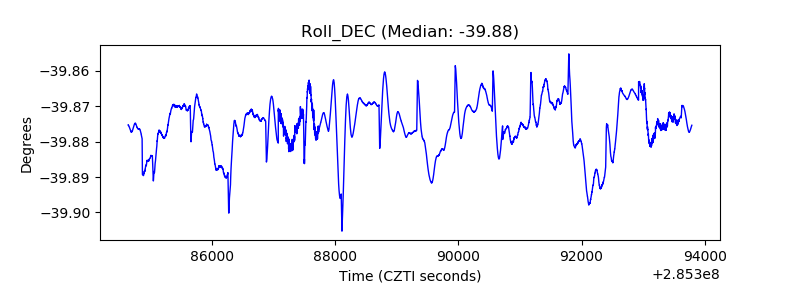 |
| _Roll_RA | 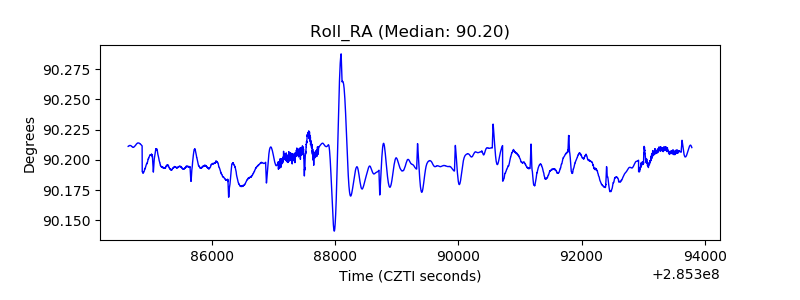 |
| Veto Counter | 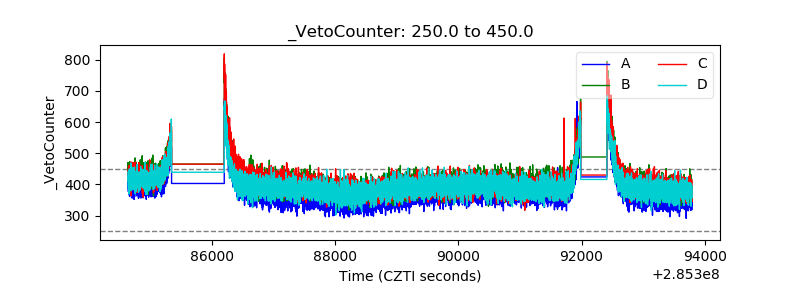 |