| Param | Original file | Final file |
|---|---|---|
| Filename | modeM0/AS1A06_006T01_9000002720_18310cztM0_level2.evt | modeM0/AS1A06_006T01_9000002720_18310cztM0_level2_quad_clean.evt |
| Size (bytes) | 289,825,920 | 50,708,160 |
| Size | 276.4 MB | 48.4 MB |
| Events in quadrant A | 1,859,584 | 325,974 |
| Events in quadrant B | 1,920,078 | 330,329 |
| Events in quadrant C | 1,902,655 | 321,138 |
| Events in quadrant D | 2,856,312 | 309,935 |
| Mode SS | |||
|---|---|---|---|
| Quadrant | BADHDUFLAG | Total packets | Discarded packets |
| A | 0 | 72 | 2 |
| B | 0 | 72 | 2 |
| C | 0 | 71 | 3 |
| D | 0 | 72 | 2 |
| Mode M9 | |||
|---|---|---|---|
| Quadrant | BADHDUFLAG | Total packets | Discarded packets |
| A | 0 | 14 | 0 |
| B | 0 | 14 | 0 |
| C | 0 | 14 | 0 |
| D | 0 | 14 | 0 |
| Mode M0 | |||
|---|---|---|---|
| Quadrant | BADHDUFLAG | Total packets | Discarded packets |
| A | 0 | 7645 | 97 |
| B | 0 | 7841 | 79 |
| C | 0 | 7882 | 89 |
| D | 0 | 10924 | 133 |
| Quadrant | Total seconds | Saturated seconds | Saturation percentage |
|---|---|---|---|
| A | 3504 | 50 | 1.426941% |
| B | 3516 | 65 | 1.848692% |
| C | 3510 | 84 | 2.393162% |
| D | 3499 | 288 | 8.230923% |
Noise dominated data is calculated using 1-second bins in cleaned event files. If a bin has >2000 counts, and if more than 50% of those come from <1% of pixels, then it is considered to be noise-dominated and hence unusable.
| Quadrant | # 1 sec bins | Bins with >0 counts | Bins with >2000 counts | High rate bins dominated by noise | Noise dominated (total time) | Noise dominated (detector-on time) | Marked lightcurve |
|---|---|---|---|---|---|---|---|
| A | 4902 | 3519 | 0 | 0 | 0.00% | 0.00% | 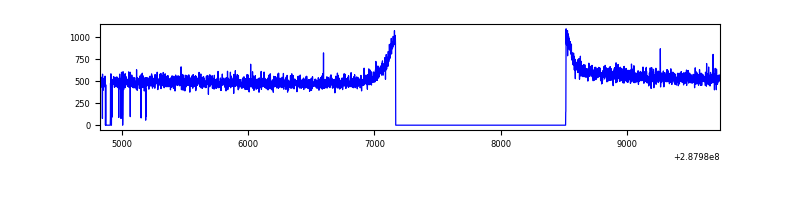 |
| B | 4902 | 3529 | 0 | 0 | 0.00% | 0.00% | 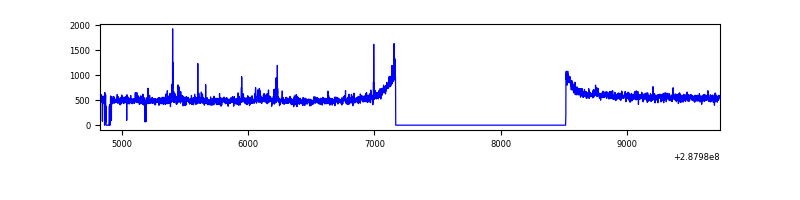 |
| C | 4901 | 3523 | 1 | 1 | 0.02% | 0.03% | 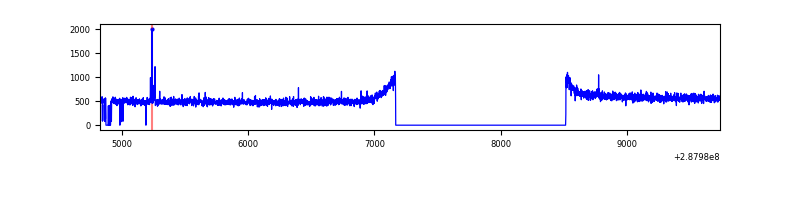 |
| D | 4901 | 3516 | 207 | 207 | 4.22% | 5.89% | 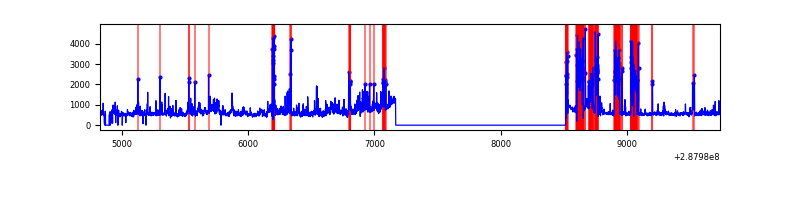 |
Top three noisy pixels from each quadrant. If the there are fewer than three noisy pixels in the level2.evt file, extra rows are filled as -1
| Pixel properties | Quadrant properties | ||||||
|---|---|---|---|---|---|---|---|
| Quadrant | DetID | PixID | Counts | Sigma | Mean | Median | Sigma |
| A | 0 | 226 | 4491 | 40.74 | 483 | 474 | 98.6 |
| A | 12 | 194 | 3635 | 32.06 | 483 | 474 | 98.6 |
| A | 3 | 137 | 3170 | 27.34 | 483 | 474 | 98.6 |
| B | 12 | 111 | 9900 | 102.37 | 484 | 473 | 92.1 |
| B | 4 | 48 | 8203 | 83.94 | 484 | 473 | 92.1 |
| B | 11 | 111 | 8159 | 83.46 | 484 | 473 | 92.1 |
| C | 14 | 238 | 72661 | 668.42 | 464 | 468 | 108.0 |
| C | 3 | 233 | 10650 | 94.27 | 464 | 468 | 108.0 |
| C | 0 | 207 | 9147 | 80.36 | 464 | 468 | 108.0 |
| D | 1 | 52 | 649756 | 5917.64 | 449 | 437 | 109.7 |
| D | 7 | 238 | 277590 | 2525.86 | 449 | 437 | 109.7 |
| D | 13 | 168 | 167450 | 1522.09 | 449 | 437 | 109.7 |
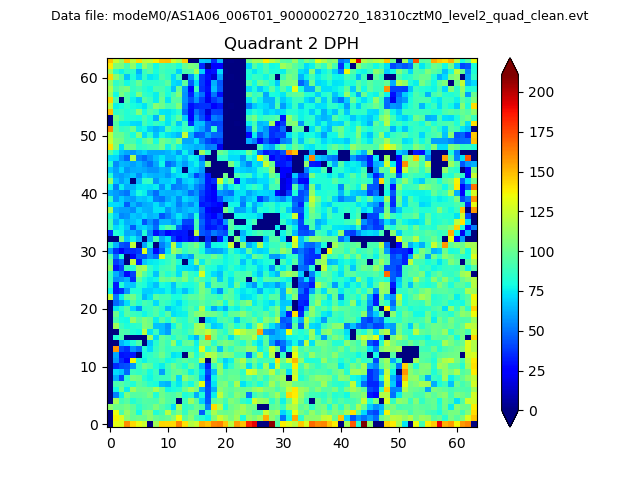
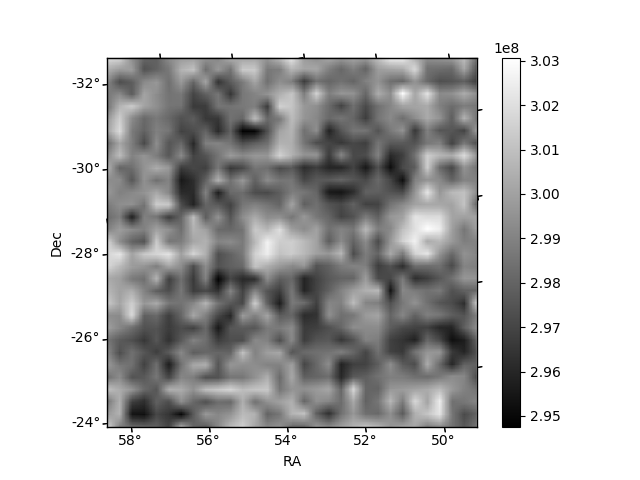
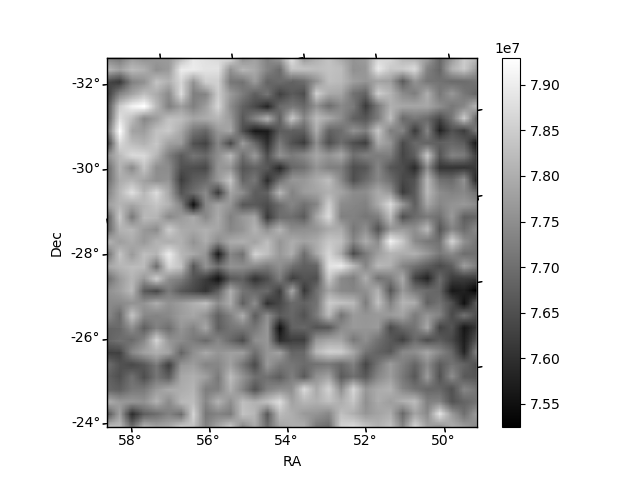
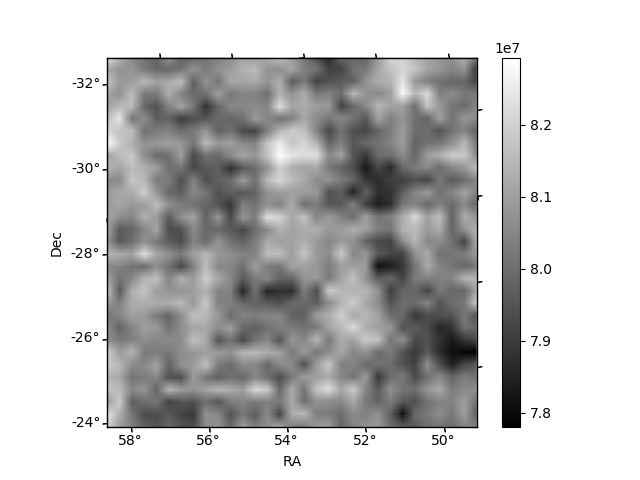
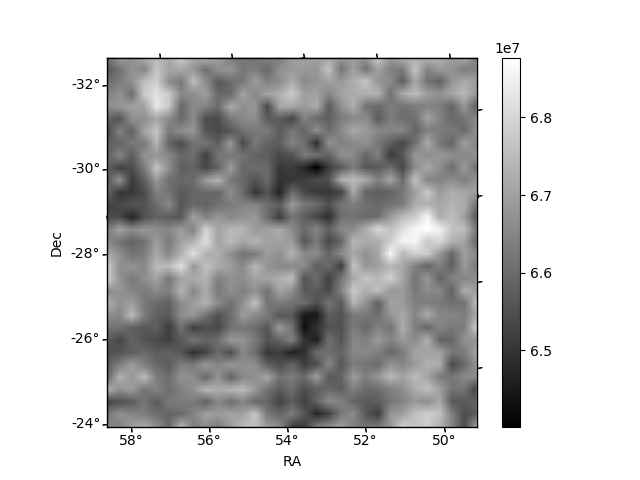
Histogram calculated using DETX and DETY for each event in the final _common_clean file
| Quadrant A | 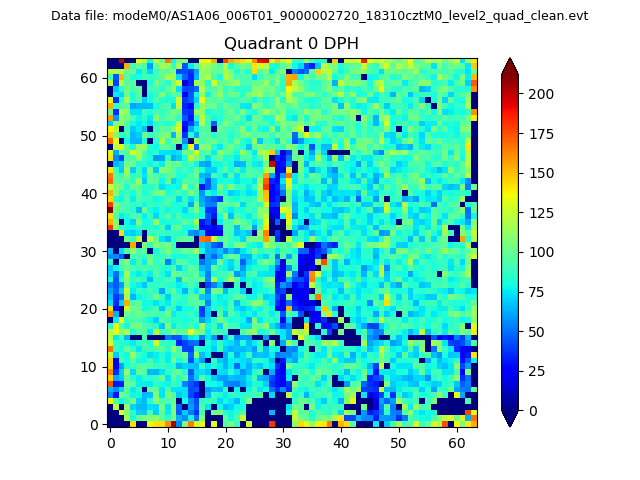 |
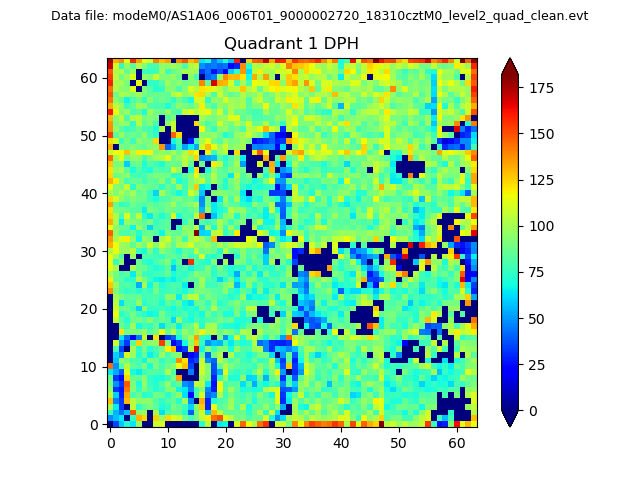 |
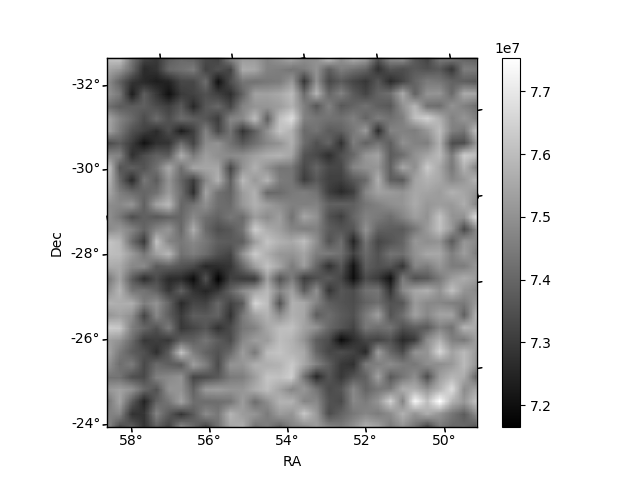
Quadrant B |
|---|---|---|---|
| Quadrant D | 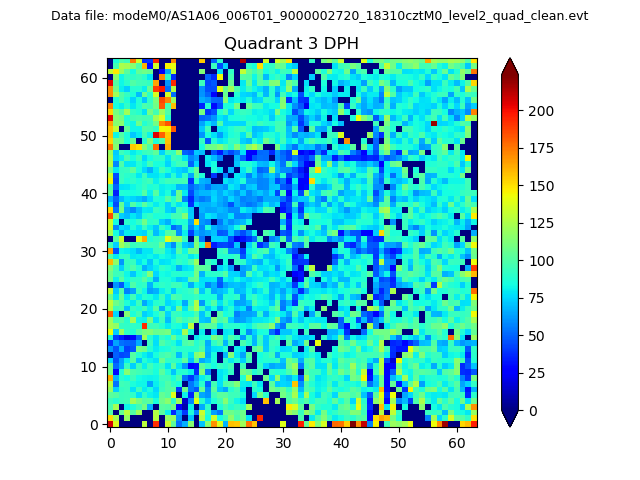 |
 |
Quadrant C |
| Plot type | Count rate plots | Images |
|---|---|---|
| Comparison with Poisson distribution Blue bars denote a histogram of data divided into 1 sec bins. Red curve is a Poisson curve with rate = median count rate of data. |
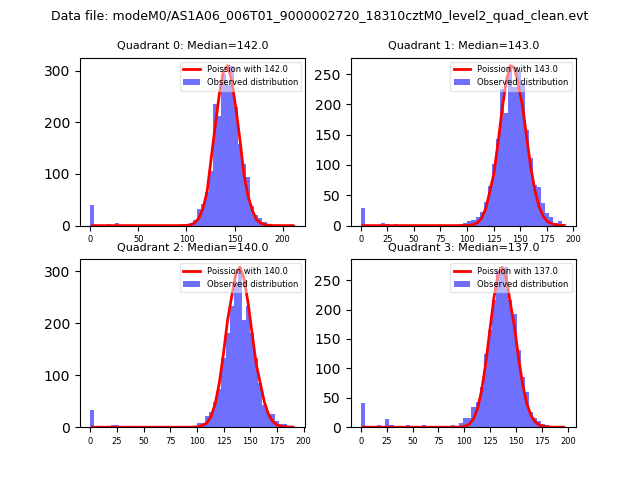 |
 |
| Quadrant-wise count rates Data is divided into 100 sec bins |
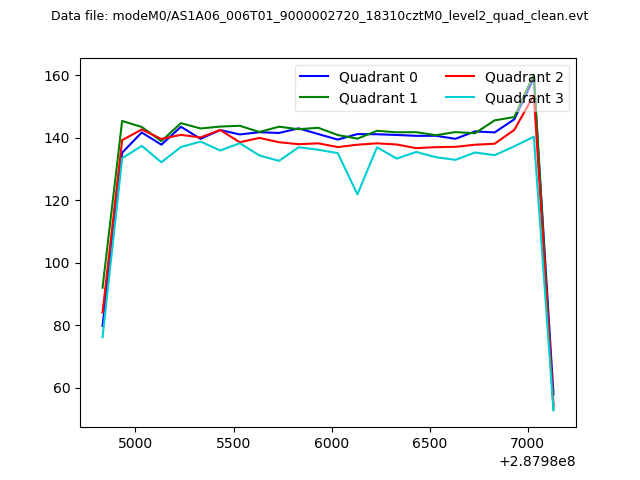 |
|
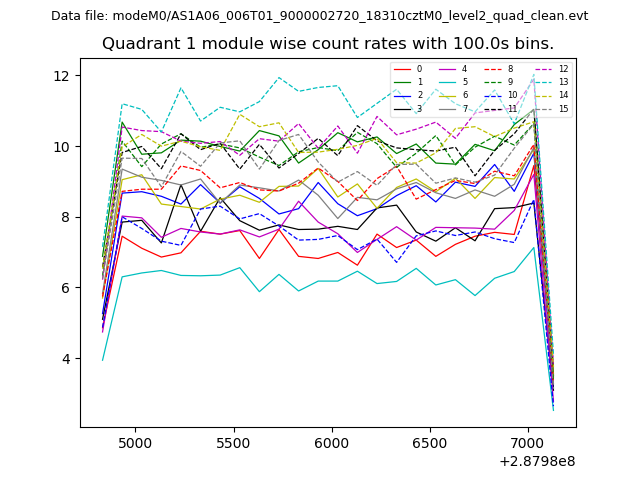
| Module-wise count rates for Quadrant A Data is divided into 100 sec bins |
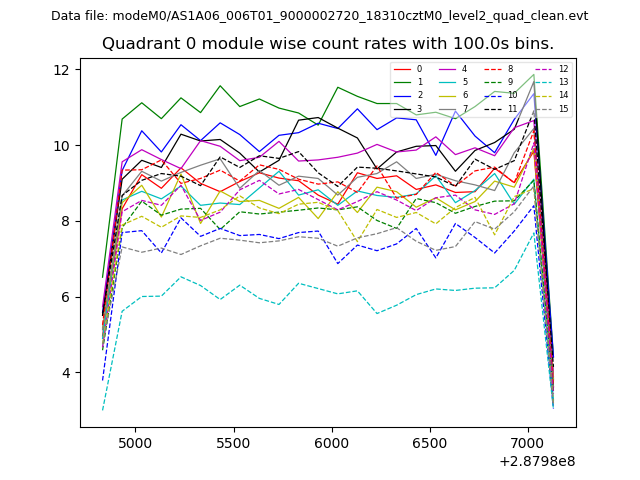 |
 |
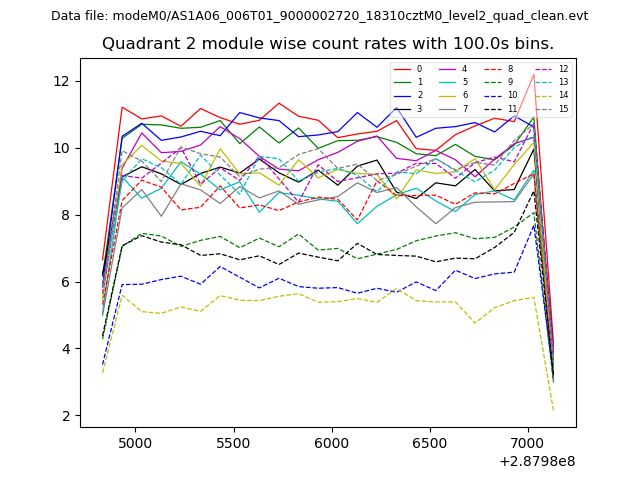
| Module-wise count rates for Quadrant B Data is divided into 100 sec bins |
 |
 |
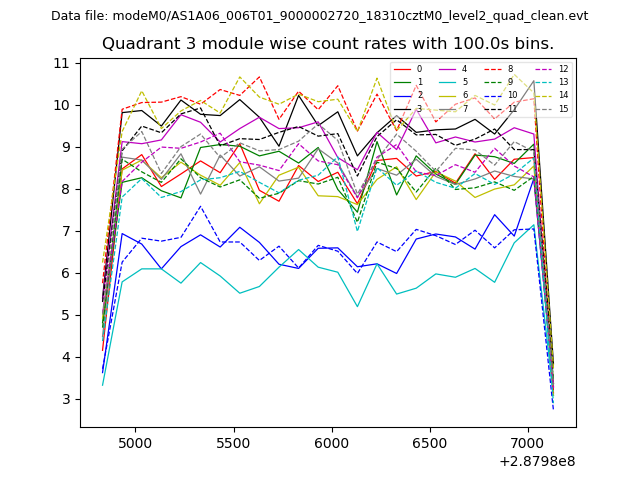
| Module-wise count rates for Quadrant C Data is divided into 100 sec bins |
 |
 |
| Module-wise count rates for Quadrant D Data is divided into 100 sec bins |
 |
 |
| Parameter | Plot |
|---|---|
| CZT HV Monitor | 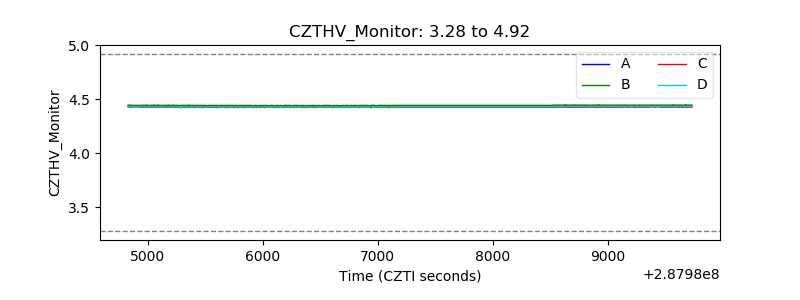 |
| D_VDD | 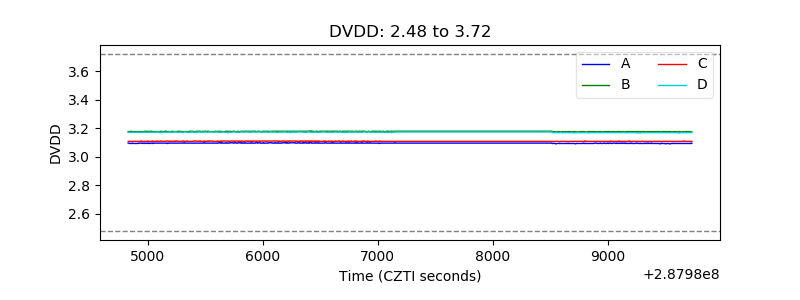 |
| Temperature 1 | 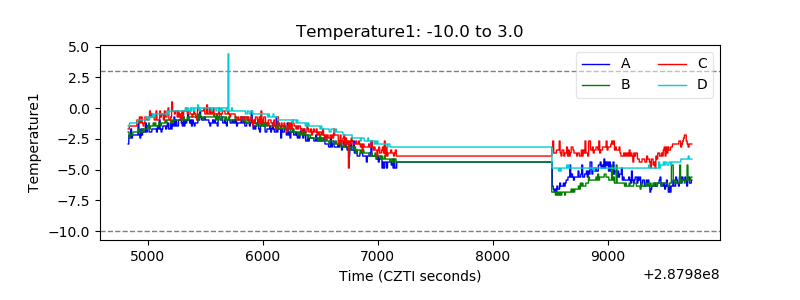 |
| Veto HV Monitor | 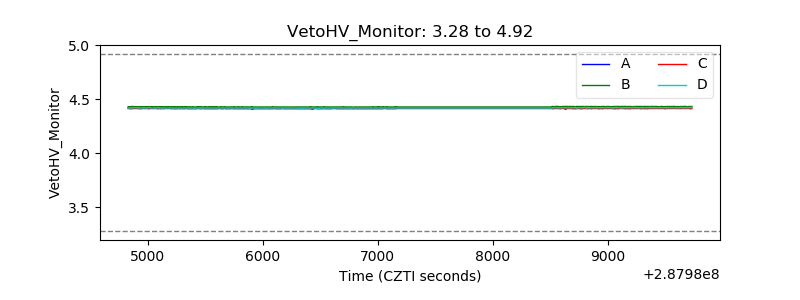 |
| Veto LLD | 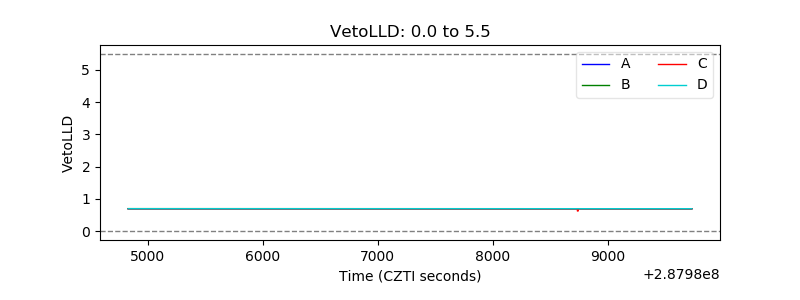 |
| Alpha Counter | 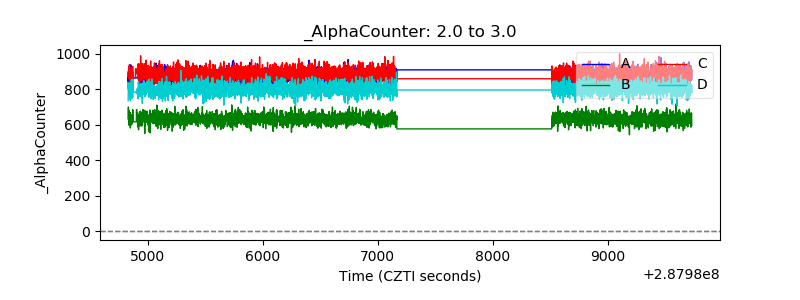 |
| _CPM_Rate | 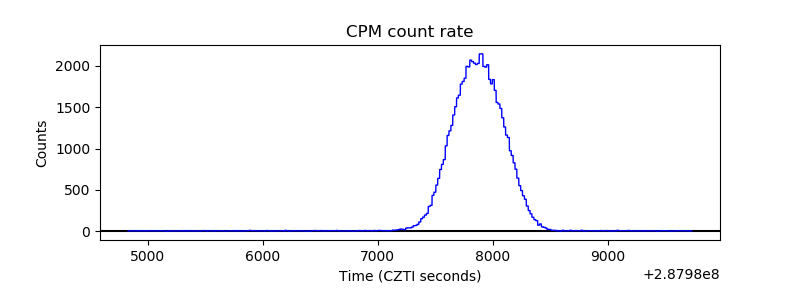 |
| CZT Counter | 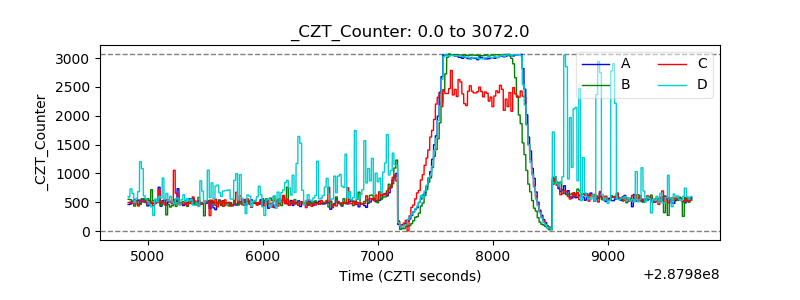 |
| +2.5 Volts monitor |  |
| +5 Volts monitor |  |
| _ROLL_ROT | 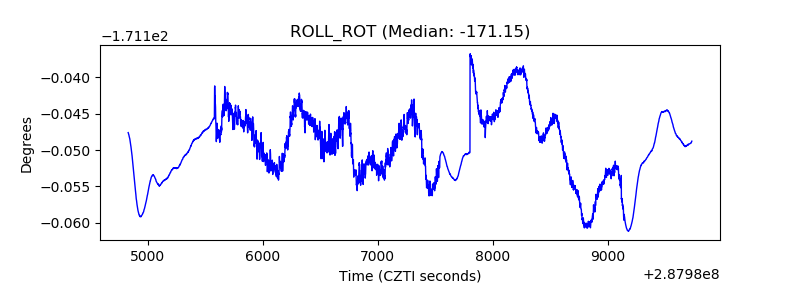 |
| _Roll_DEC | 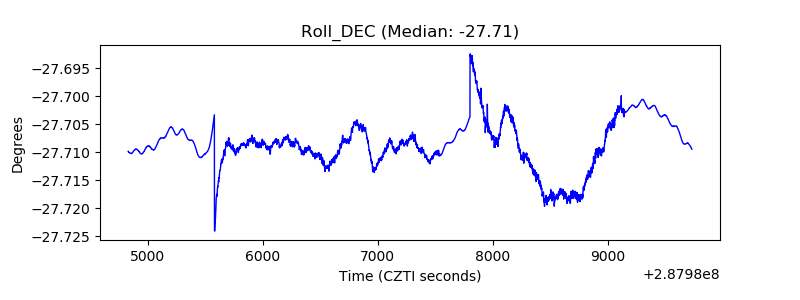 |
| _Roll_RA | 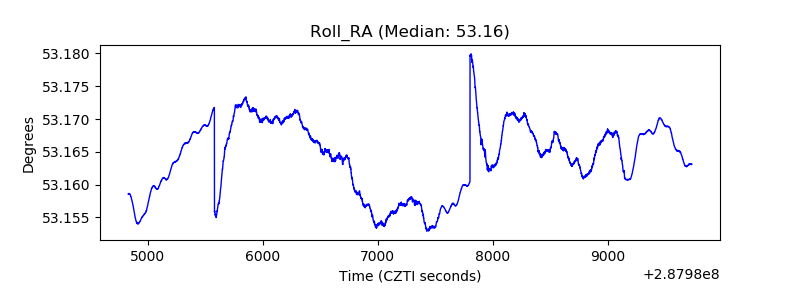 |
| Veto Counter | 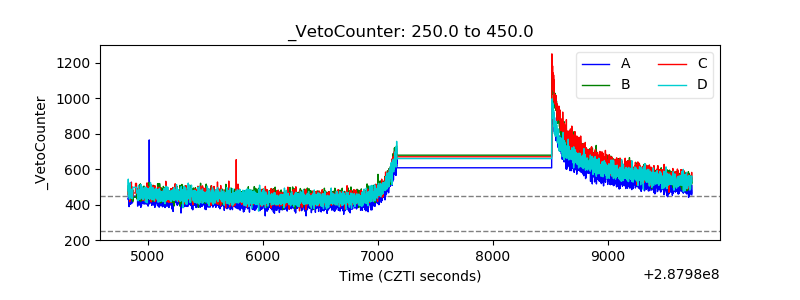 |