| Param | Original file | Final file |
|---|---|---|
| Filename | modeM0/AS1A05_072T04_9000002794_18699cztM0_level2.evt | modeM0/AS1A05_072T04_9000002794_18699cztM0_level2_quad_clean.evt |
| Size (bytes) | 519,148,800 | 86,477,760 |
| Size | 495.1 MB | 82.5 MB |
| Events in quadrant A | 3,480,581 | 546,910 |
| Events in quadrant B | 3,577,069 | 556,035 |
| Events in quadrant C | 3,481,327 | 535,514 |
| Events in quadrant D | 4,733,728 | 517,846 |
| Mode SS | |||
|---|---|---|---|
| Quadrant | BADHDUFLAG | Total packets | Discarded packets |
| A | 0 | 134 | 0 |
| B | 0 | 134 | 0 |
| C | 0 | 134 | 0 |
| D | 0 | 134 | 0 |
| Mode M9 | |||
|---|---|---|---|
| Quadrant | BADHDUFLAG | Total packets | Discarded packets |
| A | 0 | 12 | 0 |
| B | 0 | 12 | 0 |
| C | 0 | 12 | 0 |
| D | 0 | 12 | 0 |
| Mode M0 | |||
|---|---|---|---|
| Quadrant | BADHDUFLAG | Total packets | Discarded packets |
| A | 0 | 14356 | 2 |
| B | 0 | 14597 | 2 |
| C | 0 | 14291 | 2 |
| D | 0 | 18414 | 2 |
| Quadrant | Total seconds | Saturated seconds | Saturation percentage |
|---|---|---|---|
| A | 6632 | 94 | 1.417370% |
| B | 6633 | 111 | 1.673451% |
| C | 6633 | 113 | 1.703603% |
| D | 6633 | 380 | 5.728931% |
Noise dominated data is calculated using 1-second bins in cleaned event files. If a bin has >2000 counts, and if more than 50% of those come from <1% of pixels, then it is considered to be noise-dominated and hence unusable.
| Quadrant | # 1 sec bins | Bins with >0 counts | Bins with >2000 counts | High rate bins dominated by noise | Noise dominated (total time) | Noise dominated (detector-on time) | Marked lightcurve |
|---|---|---|---|---|---|---|---|
| A | 7827 | 6632 | 0 | 0 | 0.00% | 0.00% | 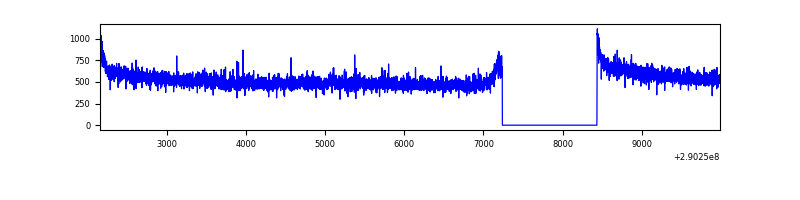 |
| B | 7828 | 6633 | 5 | 5 | 0.06% | 0.08% | 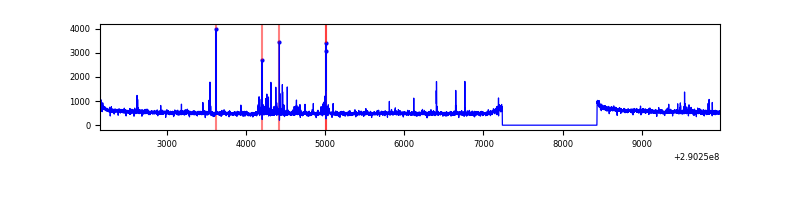 |
| C | 7828 | 6634 | 0 | 0 | 0.00% | 0.00% | 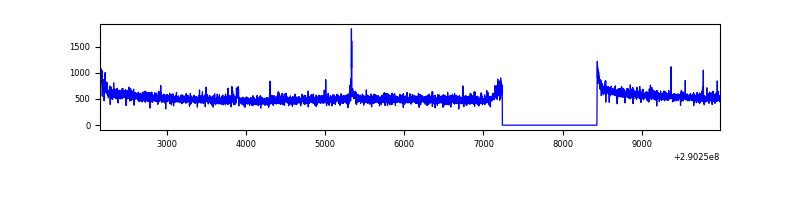 |
| D | 7828 | 6633 | 255 | 255 | 3.26% | 3.84% | 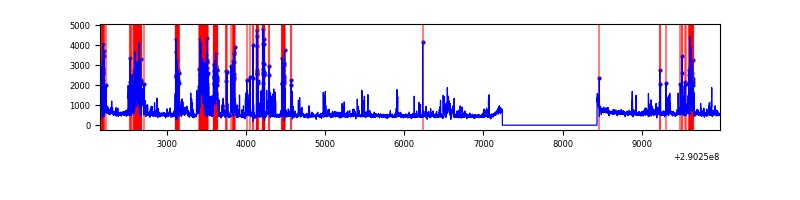 |
Top three noisy pixels from each quadrant. If the there are fewer than three noisy pixels in the level2.evt file, extra rows are filled as -1
| Pixel properties | Quadrant properties | ||||||
|---|---|---|---|---|---|---|---|
| Quadrant | DetID | PixID | Counts | Sigma | Mean | Median | Sigma |
| A | 0 | 13 | 34190 | 186.49 | 890 | 873 | 178.7 |
| A | 13 | 254 | 10770 | 55.4 | 890 | 873 | 178.7 |
| A | 0 | 226 | 7943 | 39.57 | 890 | 873 | 178.7 |
| B | 7 | 220 | 75471 | 451.88 | 877 | 858 | 165.1 |
| B | 12 | 111 | 19003 | 109.89 | 877 | 858 | 165.1 |
| B | 11 | 111 | 16438 | 94.36 | 877 | 858 | 165.1 |
| C | 14 | 238 | 133912 | 690.51 | 842 | 847 | 192.7 |
| C | 3 | 233 | 34195 | 173.05 | 842 | 847 | 192.7 |
| C | 9 | 54 | 22092 | 110.25 | 842 | 847 | 192.7 |
| D | 1 | 52 | 1098799 | 5413.47 | 848 | 824 | 202.8 |
| D | 12 | 110 | 352436 | 1733.59 | 848 | 824 | 202.8 |
| D | 7 | 238 | 51794 | 251.3 | 848 | 824 | 202.8 |
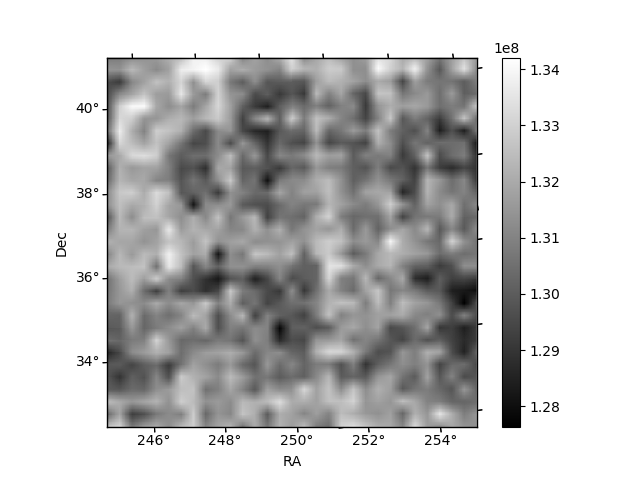
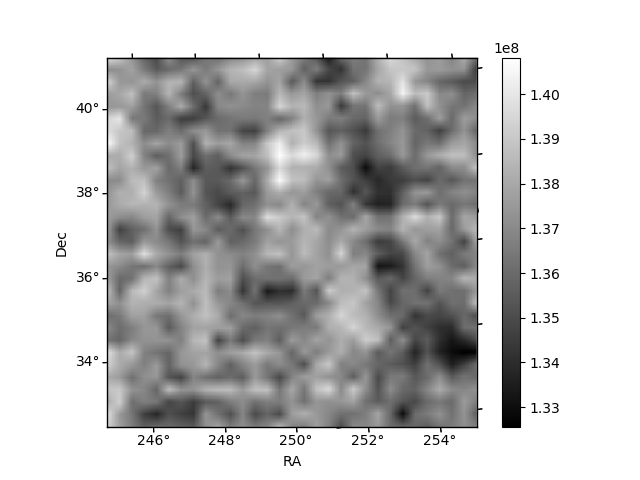
Histogram calculated using DETX and DETY for each event in the final _common_clean file
| Quadrant A |  |
 |
Quadrant B |
|---|---|---|---|
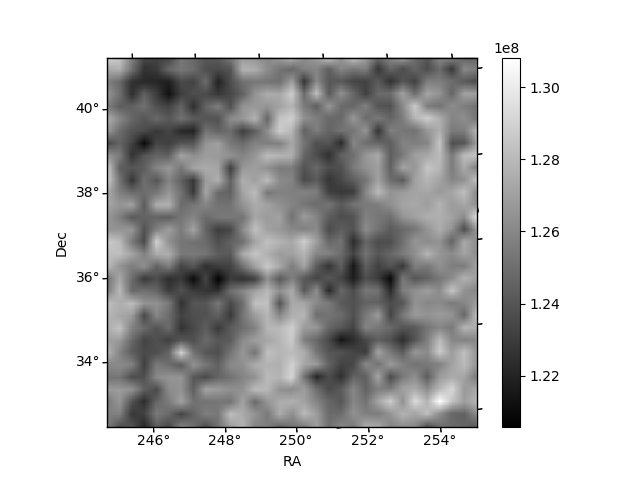
| Quadrant D |  |
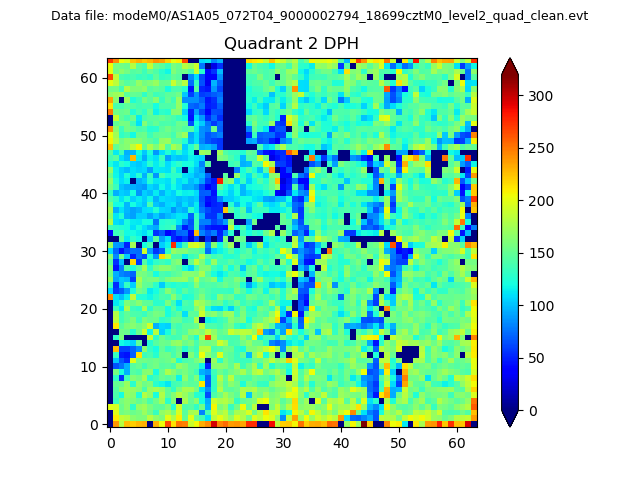 |
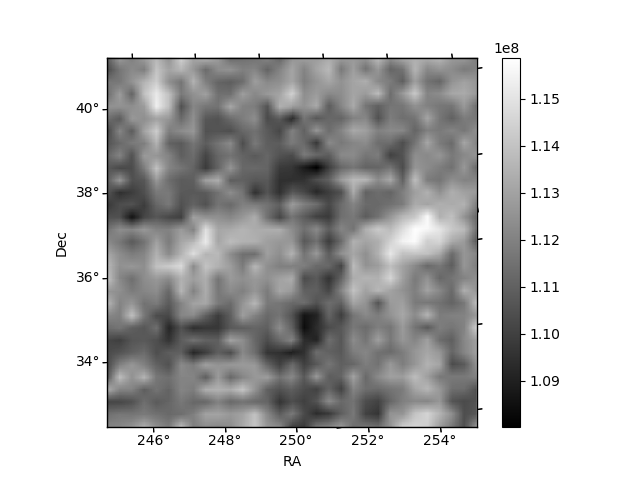
Quadrant C |
| Plot type | Count rate plots | Images |
|---|---|---|
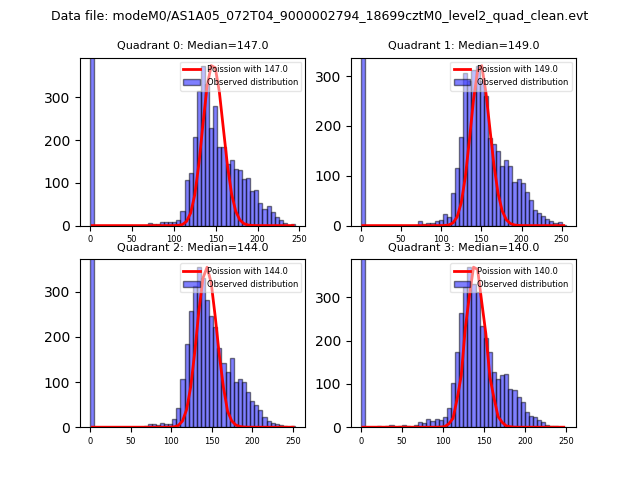
| Comparison with Poisson distribution Blue bars denote a histogram of data divided into 1 sec bins. Red curve is a Poisson curve with rate = median count rate of data. |
 |
 |
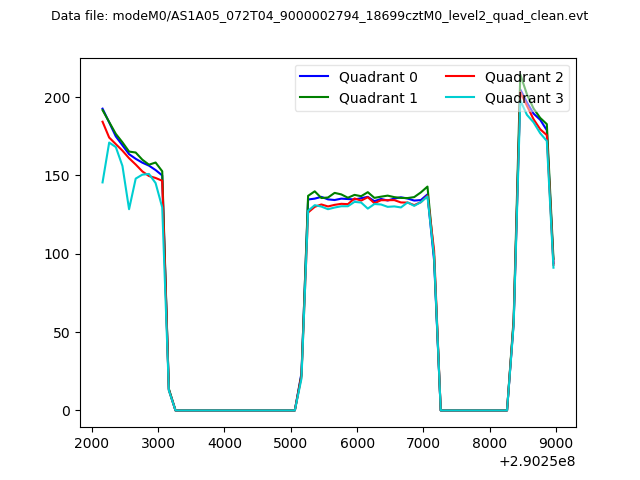
| Quadrant-wise count rates Data is divided into 100 sec bins |
 |
|
| Module-wise count rates for Quadrant A Data is divided into 100 sec bins |
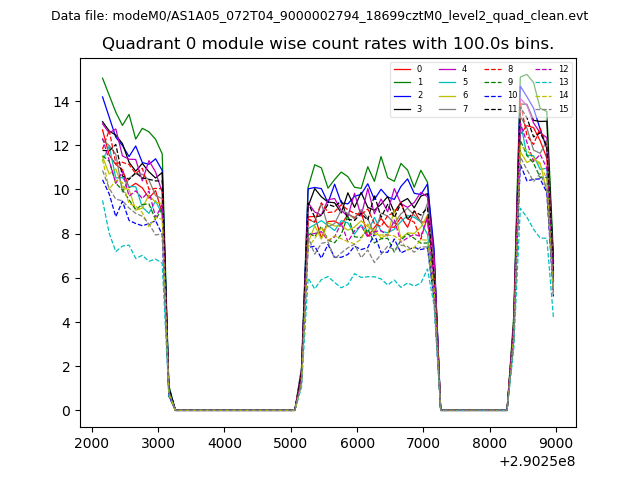 |
 |
| Module-wise count rates for Quadrant B Data is divided into 100 sec bins |
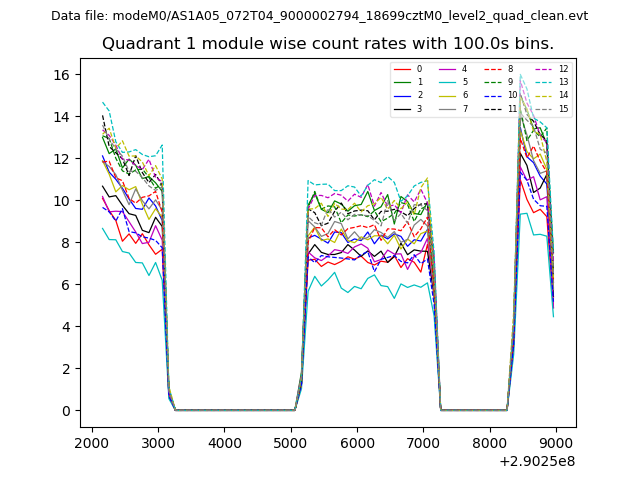 |
 |
| Module-wise count rates for Quadrant C Data is divided into 100 sec bins |
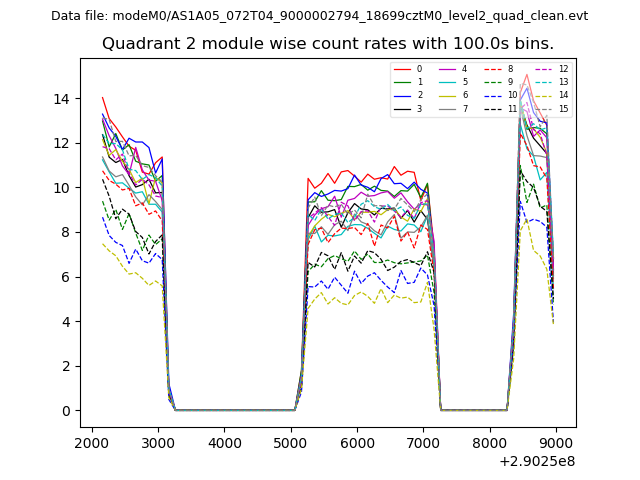 |
 |
| Module-wise count rates for Quadrant D Data is divided into 100 sec bins |
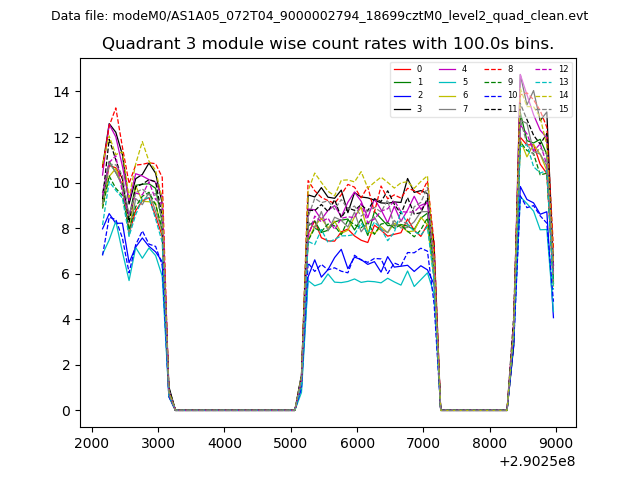 |
 |
| Parameter | Plot |
|---|---|
| CZT HV Monitor | 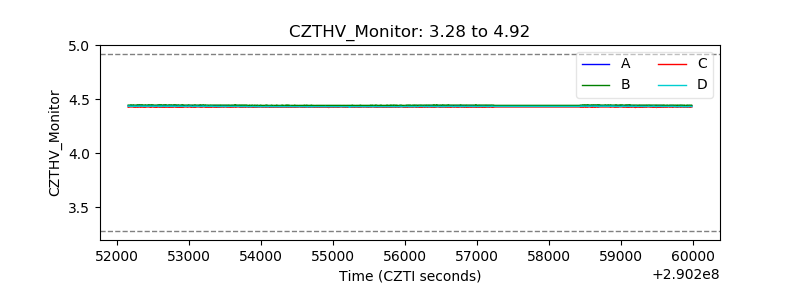 |
| D_VDD |  |
| Temperature 1 | 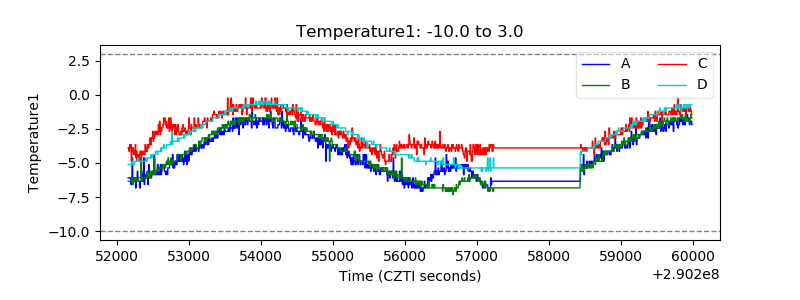 |
| Veto HV Monitor | 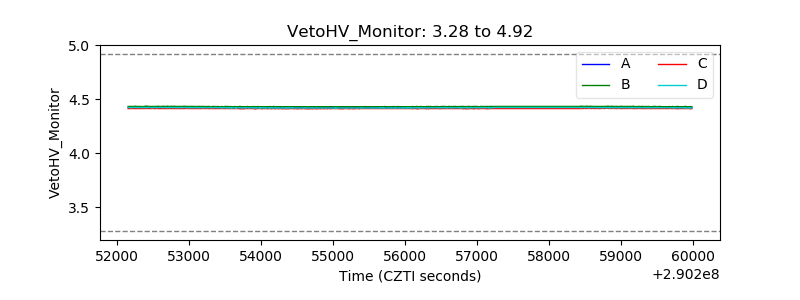 |
| Veto LLD | 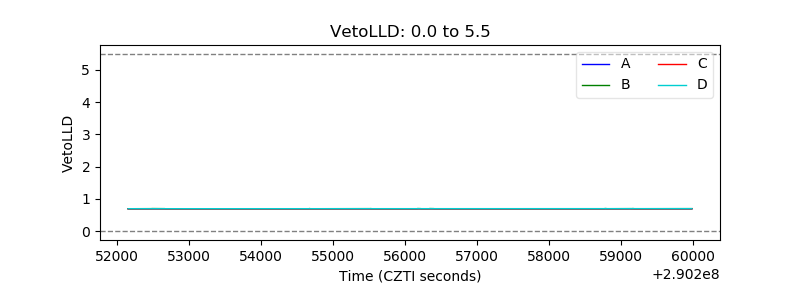 |
| Alpha Counter | 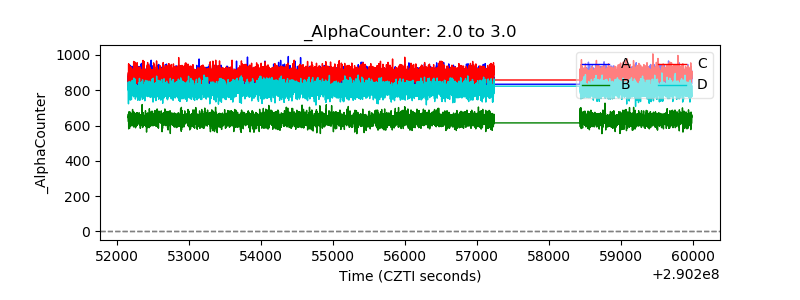 |
| _CPM_Rate | 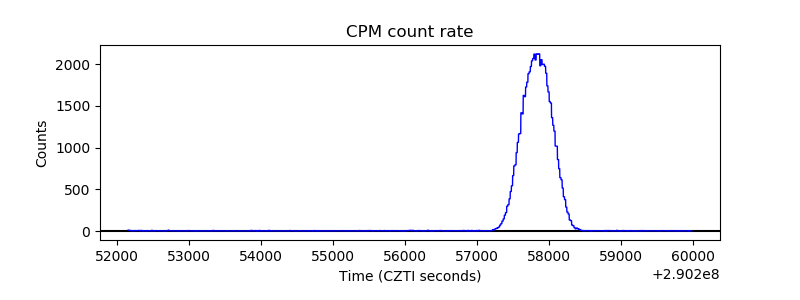 |
| CZT Counter | 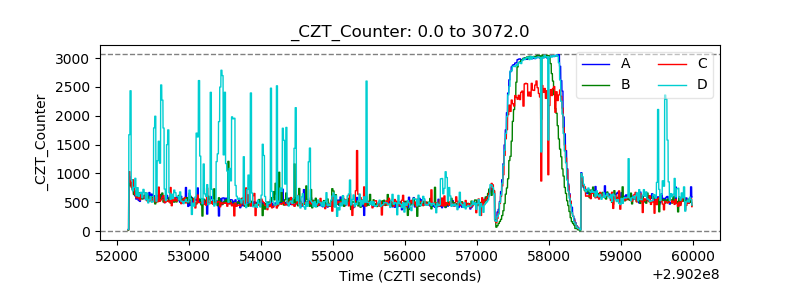 |
| +2.5 Volts monitor |  |
| +5 Volts monitor | 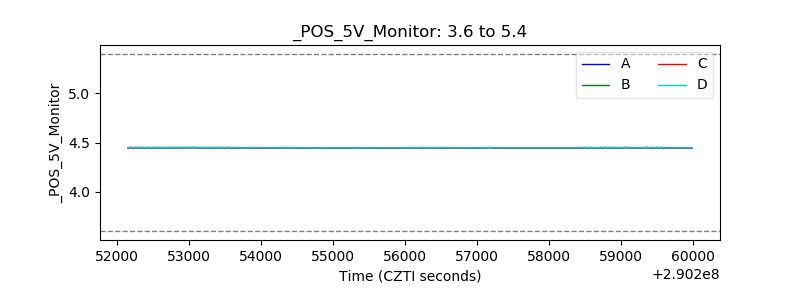 |
| _ROLL_ROT | 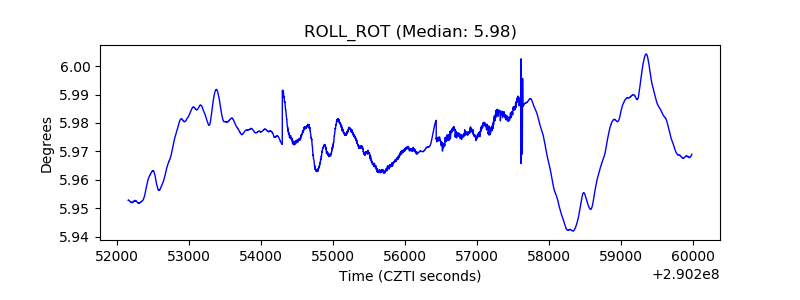 |
| _Roll_DEC | 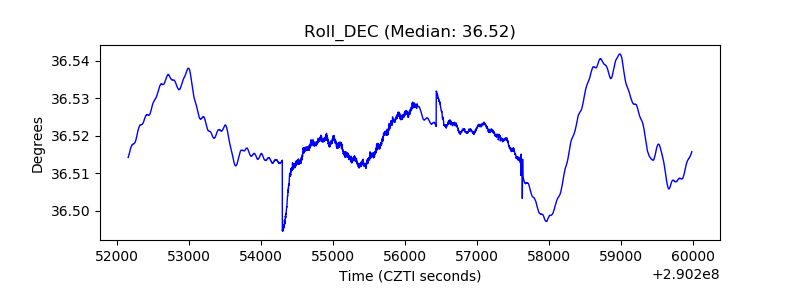 |
| _Roll_RA | 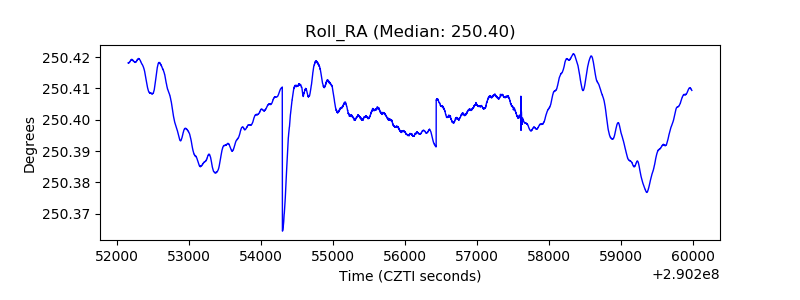 |
| Veto Counter | 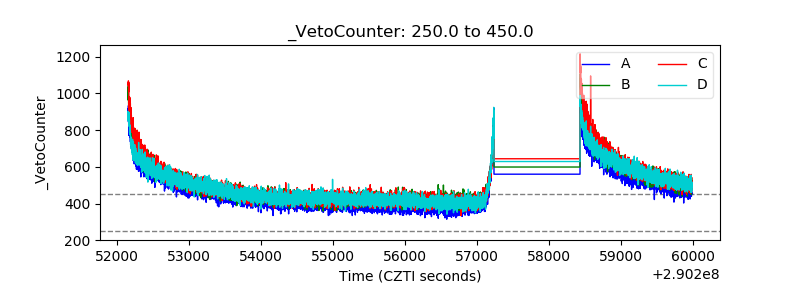 |