| Param | Original file | Final file |
|---|---|---|
| Filename | modeM0/AS1A05_088T02_9000002850_19260cztM0_level2.evt | modeM0/AS1A05_088T02_9000002850_19260cztM0_level2_quad_clean.evt |
| Size (bytes) | 132,819,840 | 13,118,400 |
| Size | 126.7 MB | 12.5 MB |
| Events in quadrant A | 992,559 | 67,000 |
| Events in quadrant B | 957,043 | 68,760 |
| Events in quadrant C | 952,739 | 66,565 |
| Events in quadrant D | 996,527 | 63,943 |
| Mode M0 | |||
|---|---|---|---|
| Quadrant | BADHDUFLAG | Total packets | Discarded packets |
| A | 0 | 3995 | 1 |
| B | 0 | 3841 | 1 |
| C | 0 | 3818 | 1 |
| D | 0 | 4038 | 1 |
| Mode SS | |||
|---|---|---|---|
| Quadrant | BADHDUFLAG | Total packets | Discarded packets |
| A | 0 | 38 | 0 |
| B | 0 | 38 | 0 |
| C | 0 | 38 | 0 |
| D | 0 | 38 | 0 |
| Mode M9 | |||
|---|---|---|---|
| Quadrant | BADHDUFLAG | Total packets | Discarded packets |
| A | 0 | 9 | 0 |
| B | 0 | 9 | 0 |
| C | 0 | 9 | 0 |
| D | 0 | 9 | 0 |
| Quadrant | Total seconds | Saturated seconds | Saturation percentage |
|---|---|---|---|
| A | 1777 | 51 | 2.870006% |
| B | 1777 | 51 | 2.870006% |
| C | 1777 | 58 | 3.263928% |
| D | 1777 | 64 | 3.601576% |
Noise dominated data is calculated using 1-second bins in cleaned event files. If a bin has >2000 counts, and if more than 50% of those come from <1% of pixels, then it is considered to be noise-dominated and hence unusable.
| Quadrant | # 1 sec bins | Bins with >0 counts | Bins with >2000 counts | High rate bins dominated by noise | Noise dominated (total time) | Noise dominated (detector-on time) | Marked lightcurve |
|---|---|---|---|---|---|---|---|
| A | 2707 | 1777 | 0 | 0 | 0.00% | 0.00% | 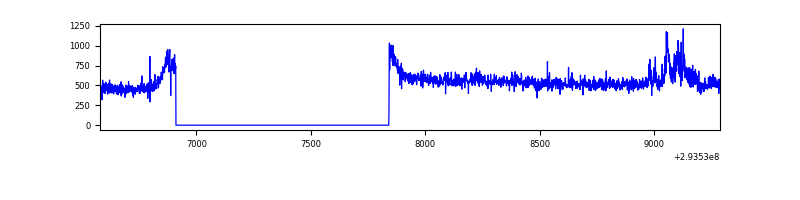 |
| B | 2707 | 1777 | 0 | 0 | 0.00% | 0.00% | 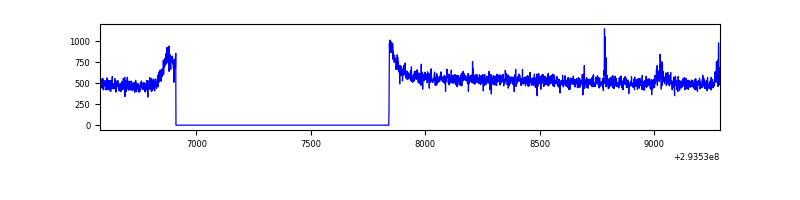 |
| C | 2707 | 1777 | 0 | 0 | 0.00% | 0.00% | 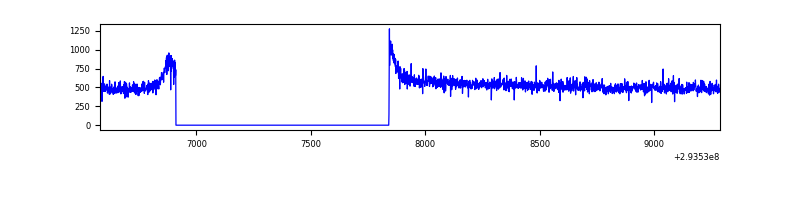 |
| D | 2707 | 1777 | 20 | 20 | 0.74% | 1.13% | 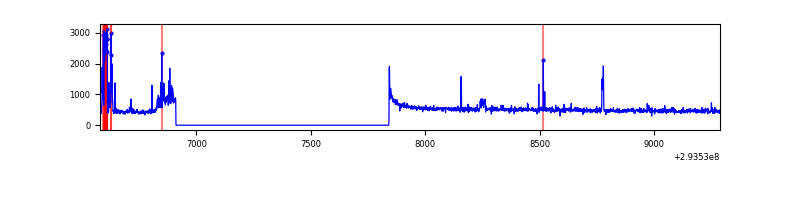 |
Top three noisy pixels from each quadrant. If the there are fewer than three noisy pixels in the level2.evt file, extra rows are filled as -1
| Pixel properties | Quadrant properties | ||||||
|---|---|---|---|---|---|---|---|
| Quadrant | DetID | PixID | Counts | Sigma | Mean | Median | Sigma |
| A | 8 | 205 | 50382 | 991.22 | 244 | 238 | 50.6 |
| A | 0 | 226 | 2171 | 38.21 | 244 | 238 | 50.6 |
| A | 13 | 254 | 2078 | 36.37 | 244 | 238 | 50.6 |
| B | 12 | 111 | 5974 | 117.91 | 240 | 233 | 48.7 |
| B | 11 | 111 | 5284 | 103.74 | 240 | 233 | 48.7 |
| B | 14 | 111 | 4734 | 92.44 | 240 | 233 | 48.7 |
| C | 14 | 238 | 36197 | 645.94 | 229 | 231 | 55.7 |
| C | 3 | 233 | 20500 | 364.03 | 229 | 231 | 55.7 |
| C | 13 | 61 | 1555 | 23.78 | 229 | 231 | 55.7 |
| D | 1 | 52 | 91899 | 1560.08 | 233 | 226 | 58.8 |
| D | 7 | 238 | 8748 | 145.03 | 233 | 226 | 58.8 |
| D | 7 | 96 | 8625 | 142.93 | 233 | 226 | 58.8 |
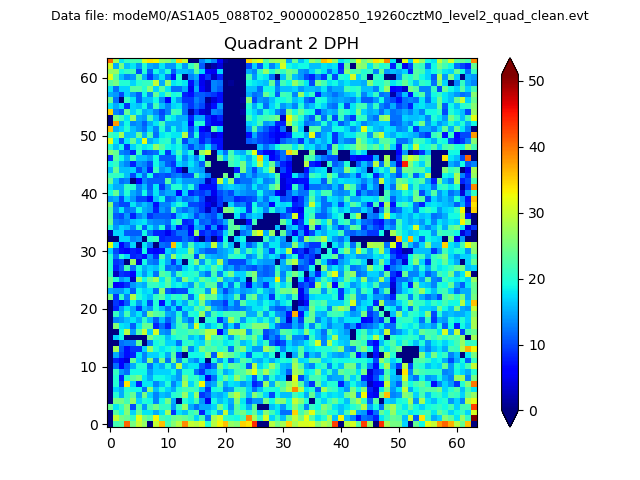
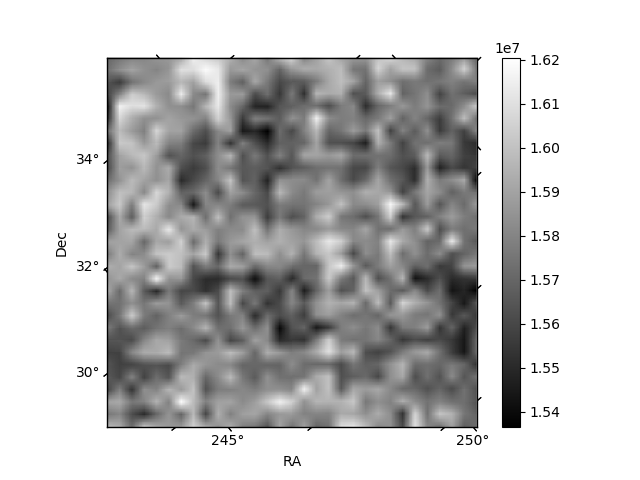
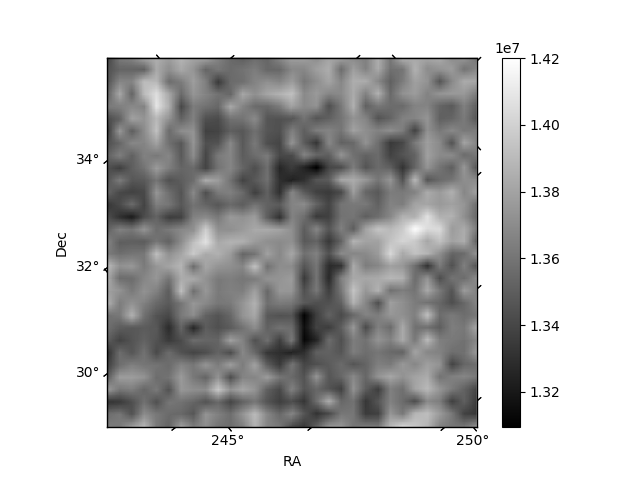
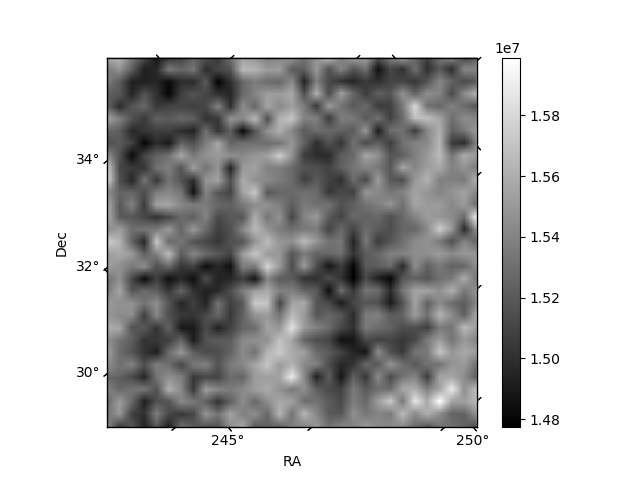
Histogram calculated using DETX and DETY for each event in the final _common_clean file
| Quadrant A | 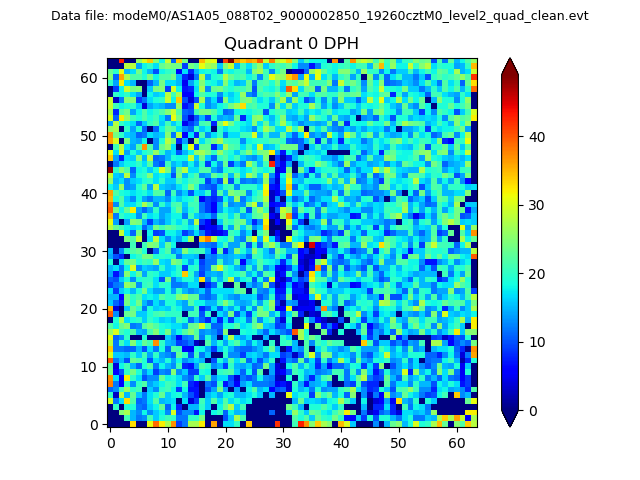 |
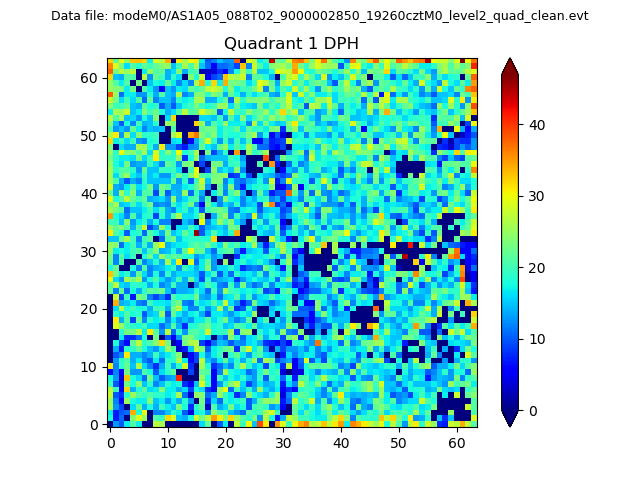 |
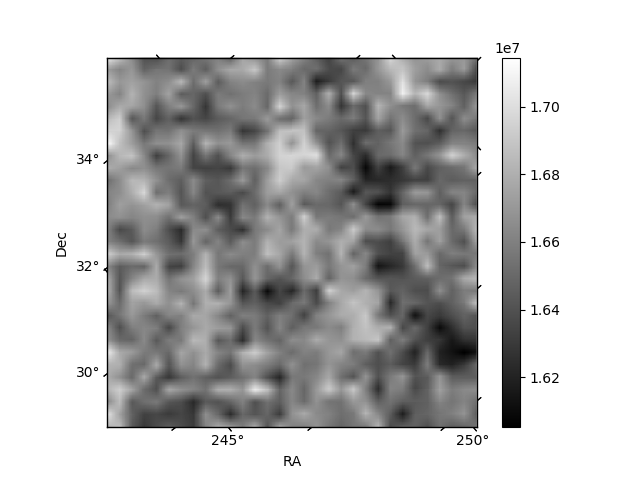
Quadrant B |
|---|---|---|---|
| Quadrant D | 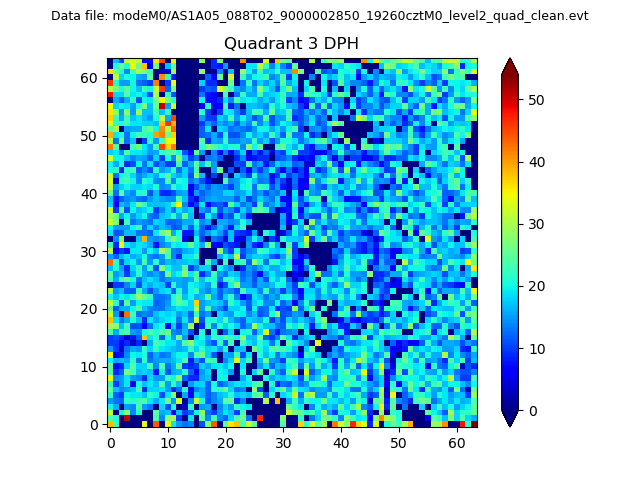 |
 |
Quadrant C |
| Plot type | Count rate plots | Images |
|---|---|---|
| Comparison with Poisson distribution Blue bars denote a histogram of data divided into 1 sec bins. Red curve is a Poisson curve with rate = median count rate of data. |
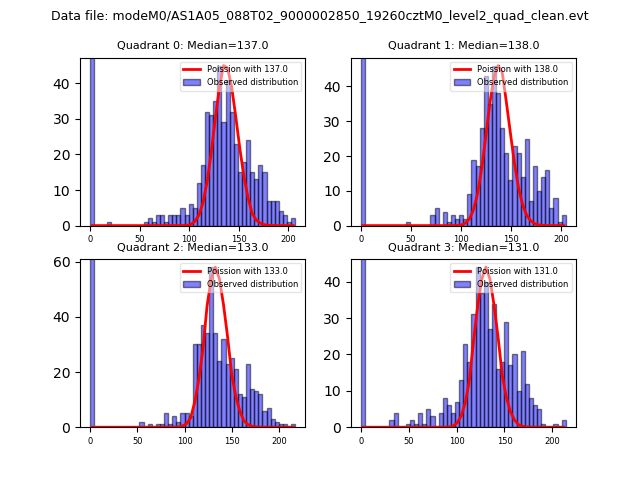 |
 |
| Quadrant-wise count rates Data is divided into 100 sec bins |
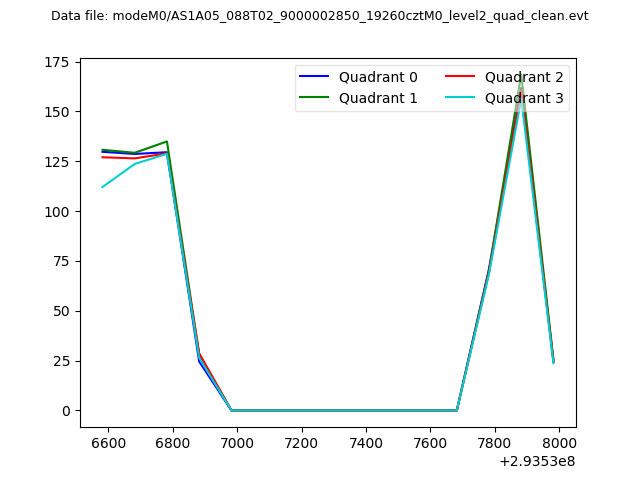 |
|
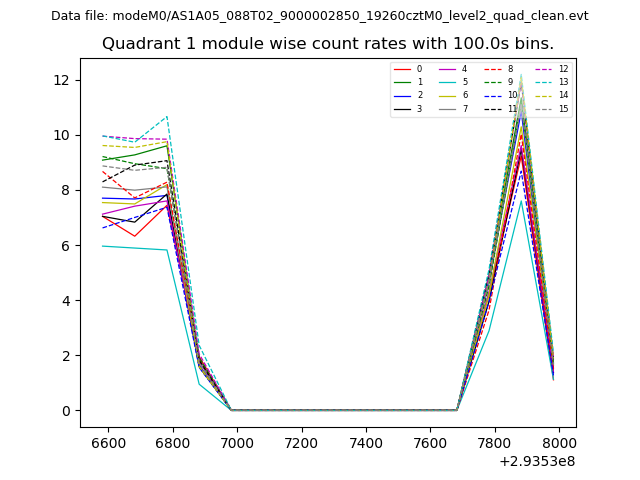
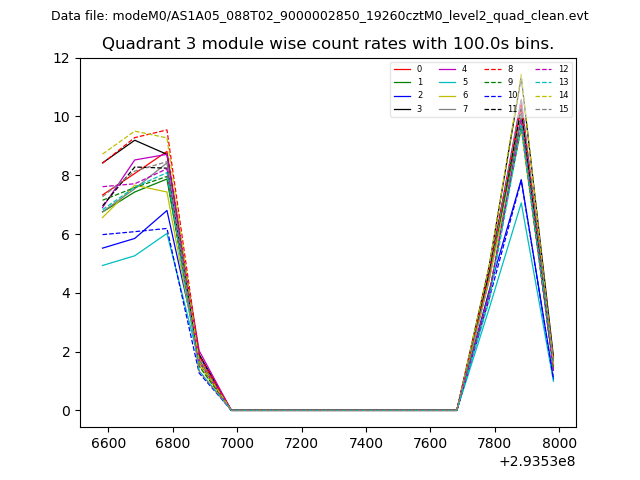
| Module-wise count rates for Quadrant A Data is divided into 100 sec bins |
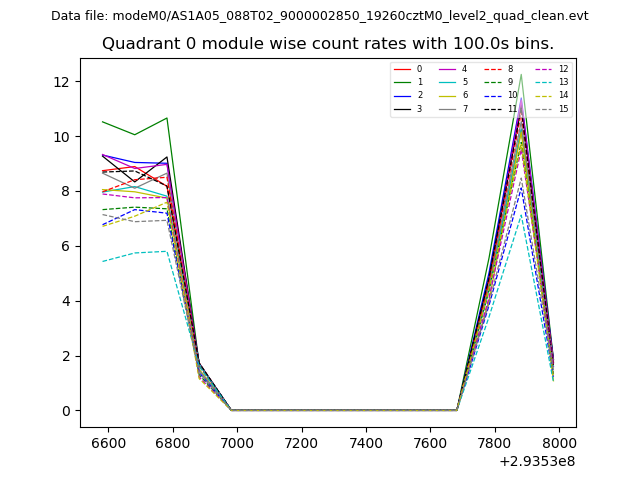 |
 |
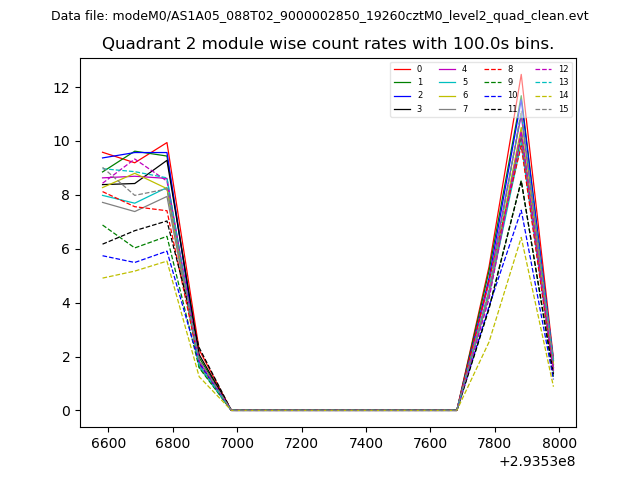
| Module-wise count rates for Quadrant B Data is divided into 100 sec bins |
 |
 |
| Module-wise count rates for Quadrant C Data is divided into 100 sec bins |
 |
 |
| Module-wise count rates for Quadrant D Data is divided into 100 sec bins |
 |
 |
| Parameter | Plot |
|---|---|
| CZT HV Monitor | 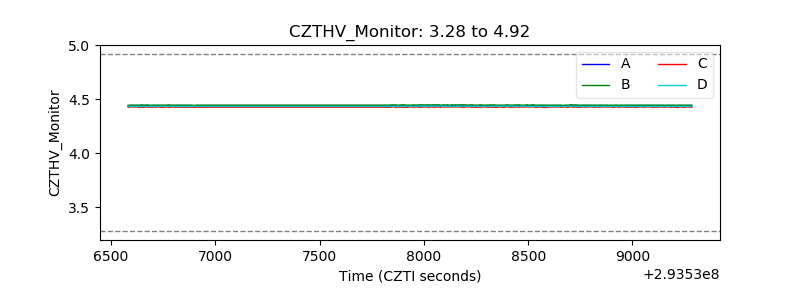 |
| D_VDD | 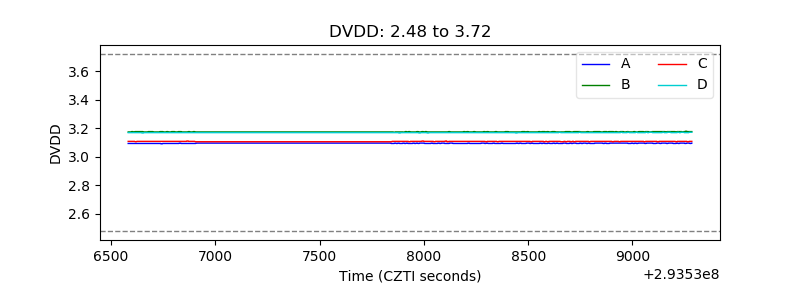 |
| Temperature 1 | 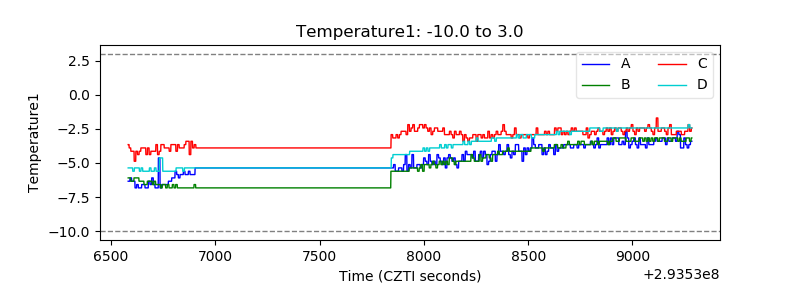 |
| Veto HV Monitor | 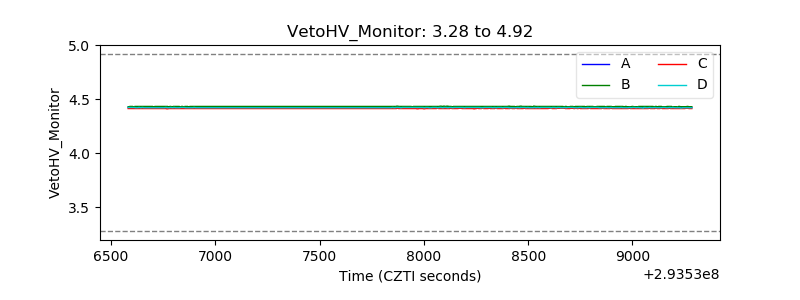 |
| Veto LLD | 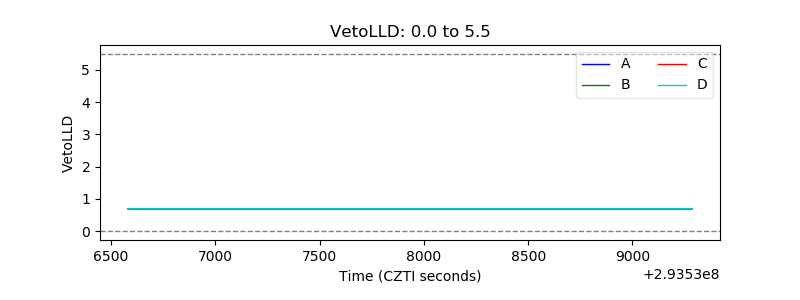 |
| Alpha Counter | 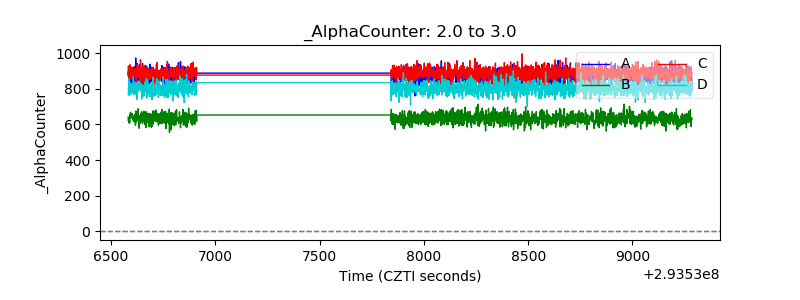 |
| _CPM_Rate | 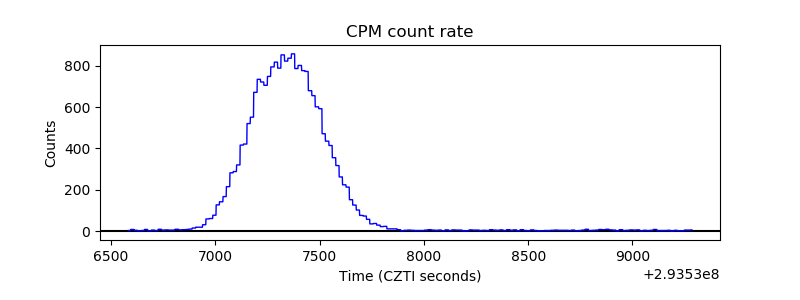 |
| CZT Counter | 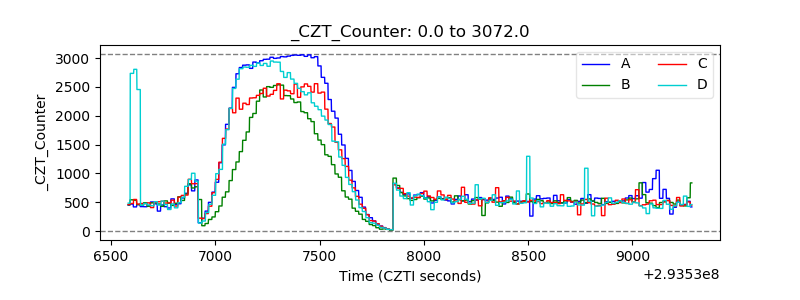 |
| +2.5 Volts monitor |  |
| +5 Volts monitor |  |
| _ROLL_ROT | 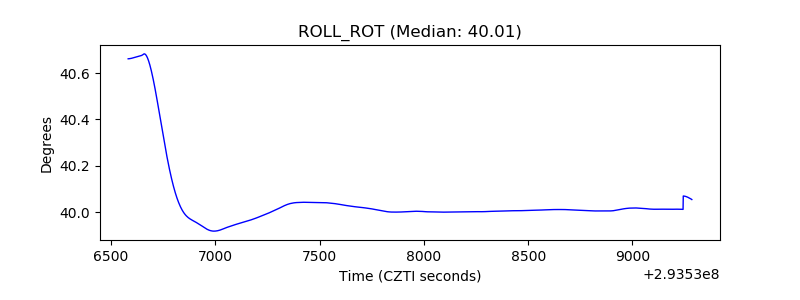 |
| _Roll_DEC | 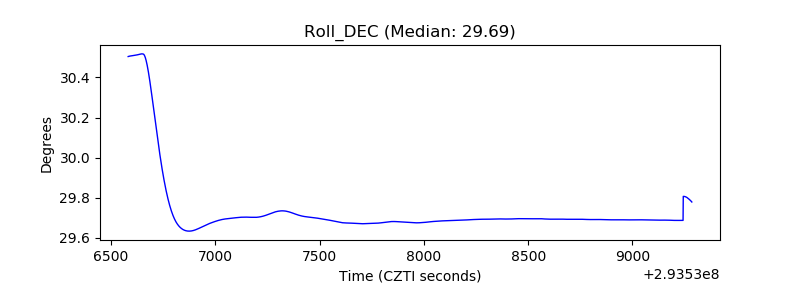 |
| _Roll_RA | 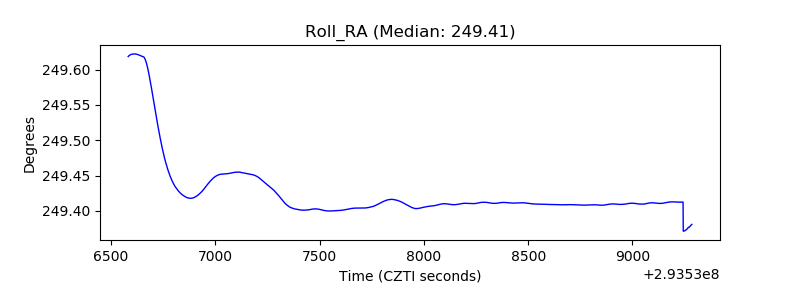 |
| Veto Counter | 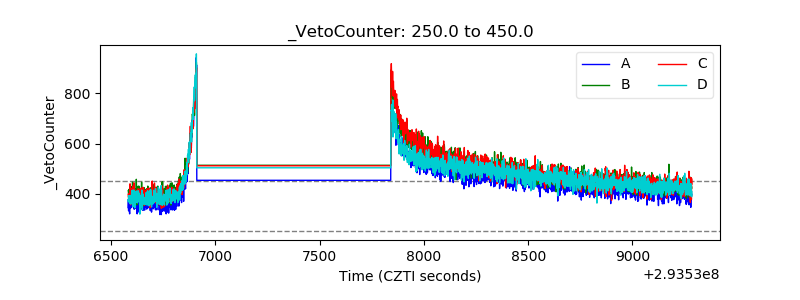 |