| Param | Original file | Final file |
|---|---|---|
| Filename | modeM0/AS1A05_025T17_9000002858_19362cztM0_level2.evt | modeM0/AS1A05_025T17_9000002858_19362cztM0_level2_quad_clean.evt |
| Size (bytes) | 164,744,640 | 30,666,240 |
| Size | 157.1 MB | 29.2 MB |
| Events in quadrant A | 841,630 | 218,055 |
| Events in quadrant B | 843,060 | 222,281 |
| Events in quadrant C | 862,412 | 209,520 |
| Events in quadrant D | 2,332,949 | 162,120 |
| Mode M0 | |||
|---|---|---|---|
| Quadrant | BADHDUFLAG | Total packets | Discarded packets |
| A | 0 | 3412 | 1 |
| B | 0 | 3422 | 1 |
| C | 0 | 3512 | 1 |
| D | 0 | 8013 | 1 |
| Mode SS | |||
|---|---|---|---|
| Quadrant | BADHDUFLAG | Total packets | Discarded packets |
| A | 0 | 34 | 0 |
| B | 0 | 34 | 0 |
| C | 0 | 34 | 0 |
| D | 0 | 34 | 0 |
| Mode M9 | |||
|---|---|---|---|
| Quadrant | BADHDUFLAG | Total packets | Discarded packets |
| A | 0 | 10 | 0 |
| B | 0 | 10 | 0 |
| C | 0 | 10 | 0 |
| D | 0 | 10 | 0 |
| Quadrant | Total seconds | Saturated seconds | Saturation percentage |
|---|---|---|---|
| A | 1570 | 37 | 2.356688% |
| B | 1570 | 39 | 2.484076% |
| C | 1570 | 56 | 3.566879% |
| D | 1570 | 669 | 42.611465% |
Noise dominated data is calculated using 1-second bins in cleaned event files. If a bin has >2000 counts, and if more than 50% of those come from <1% of pixels, then it is considered to be noise-dominated and hence unusable.
| Quadrant | # 1 sec bins | Bins with >0 counts | Bins with >2000 counts | High rate bins dominated by noise | Noise dominated (total time) | Noise dominated (detector-on time) | Marked lightcurve |
|---|---|---|---|---|---|---|---|
| A | 2590 | 1570 | 0 | 0 | 0.00% | 0.00% | 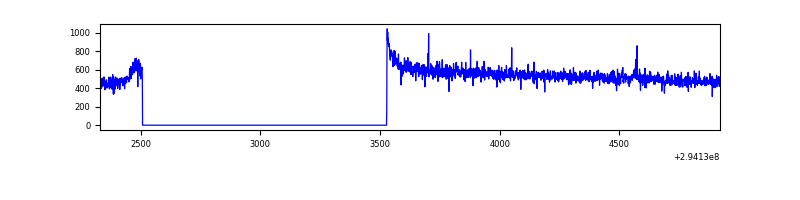 |
| B | 2590 | 1570 | 0 | 0 | 0.00% | 0.00% | 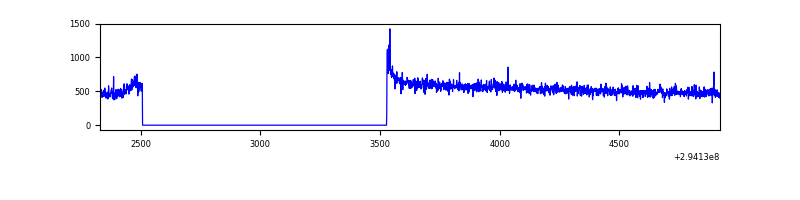 |
| C | 2590 | 1570 | 0 | 0 | 0.00% | 0.00% | 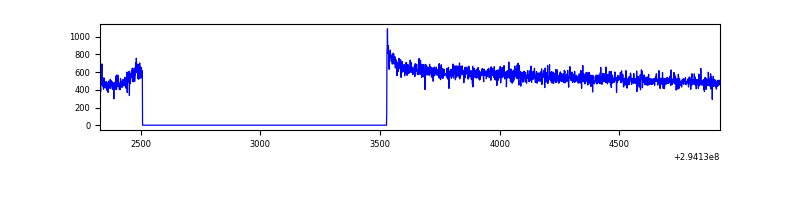 |
| D | 2590 | 1570 | 541 | 541 | 20.89% | 34.46% | 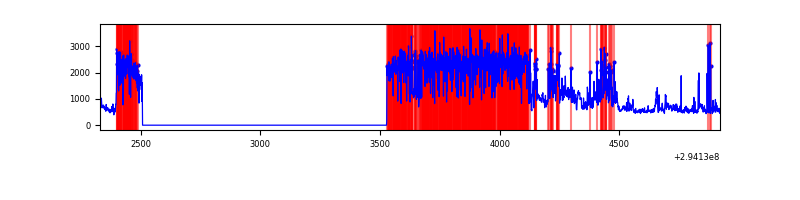 |
Top three noisy pixels from each quadrant. If the there are fewer than three noisy pixels in the level2.evt file, extra rows are filled as -1
| Pixel properties | Quadrant properties | ||||||
|---|---|---|---|---|---|---|---|
| Quadrant | DetID | PixID | Counts | Sigma | Mean | Median | Sigma |
| A | 0 | 226 | 1775 | 34.62 | 218 | 213 | 45.1 |
| A | 13 | 254 | 1773 | 34.57 | 218 | 213 | 45.1 |
| A | 9 | 143 | 1645 | 31.74 | 218 | 213 | 45.1 |
| B | 12 | 111 | 4558 | 102.41 | 214 | 209 | 42.5 |
| B | 11 | 111 | 4343 | 97.35 | 214 | 209 | 42.5 |
| B | 14 | 111 | 3849 | 85.72 | 214 | 209 | 42.5 |
| C | 14 | 238 | 33023 | 648.35 | 211 | 213 | 50.6 |
| C | 3 | 233 | 2880 | 52.7 | 211 | 213 | 50.6 |
| C | 13 | 61 | 1462 | 24.68 | 211 | 213 | 50.6 |
| D | 1 | 52 | 1009695 | 23287.88 | 176 | 171 | 43.3 |
| D | 10 | 66 | 380093 | 8764.11 | 176 | 171 | 43.3 |
| D | 7 | 238 | 243944 | 5623.4 | 176 | 171 | 43.3 |
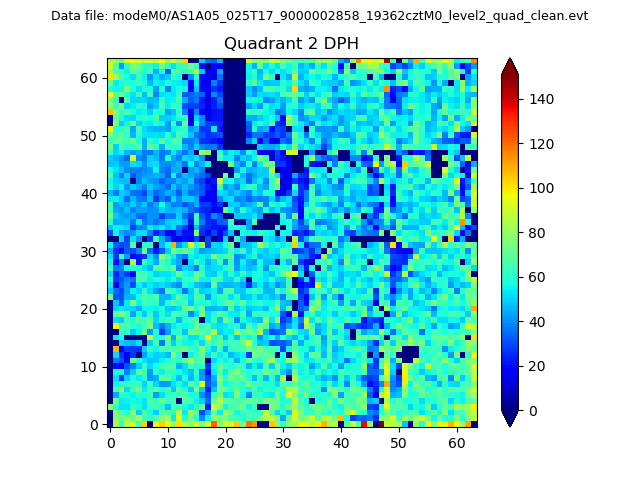
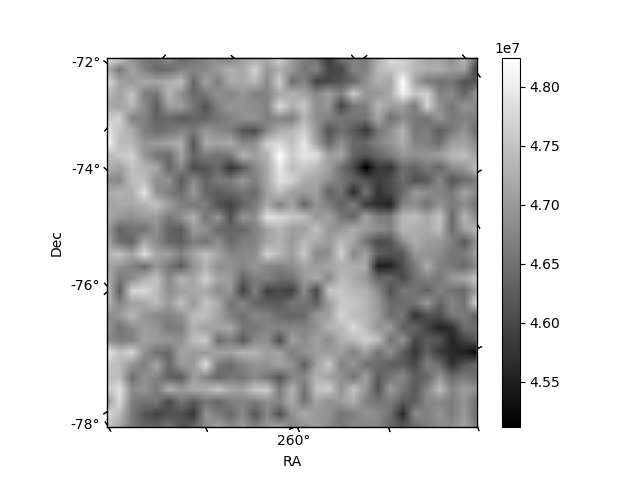
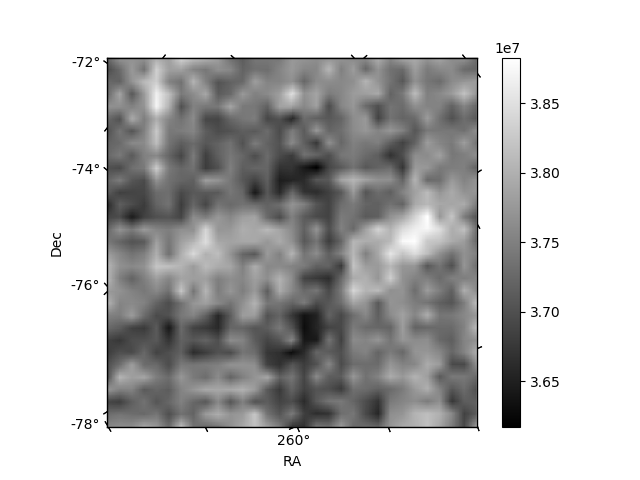
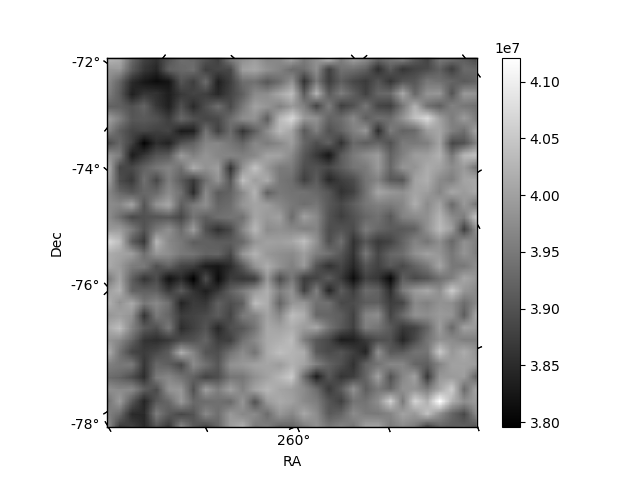
Histogram calculated using DETX and DETY for each event in the final _common_clean file
| Quadrant A | 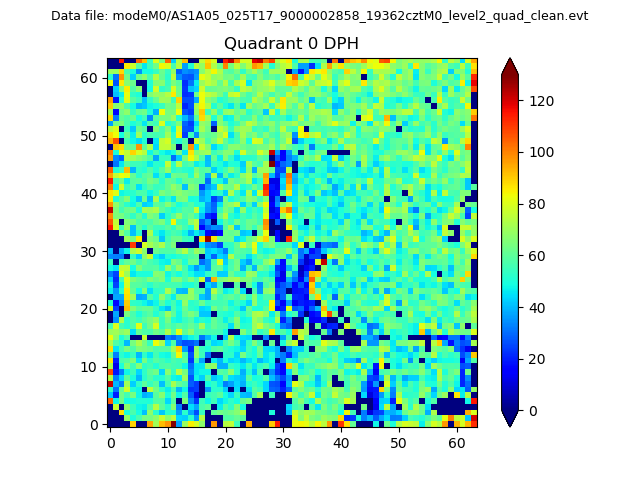 |
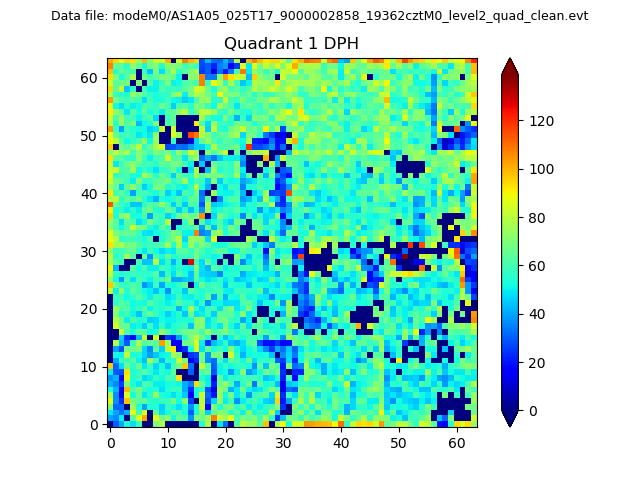 |
Quadrant B |
|---|---|---|---|
| Quadrant D | 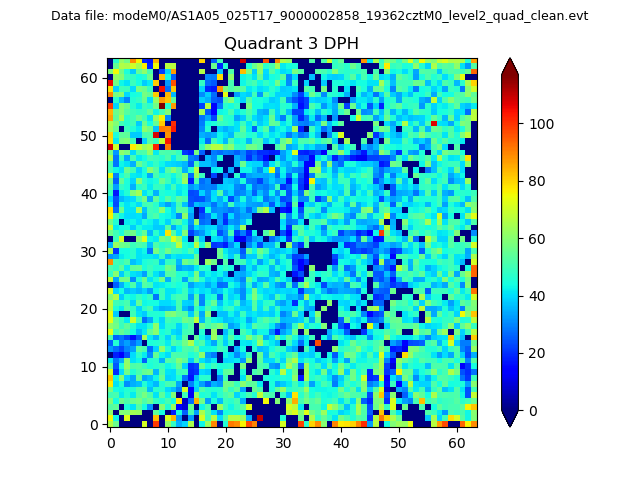 |
 |
Quadrant C |
| Plot type | Count rate plots | Images |
|---|---|---|
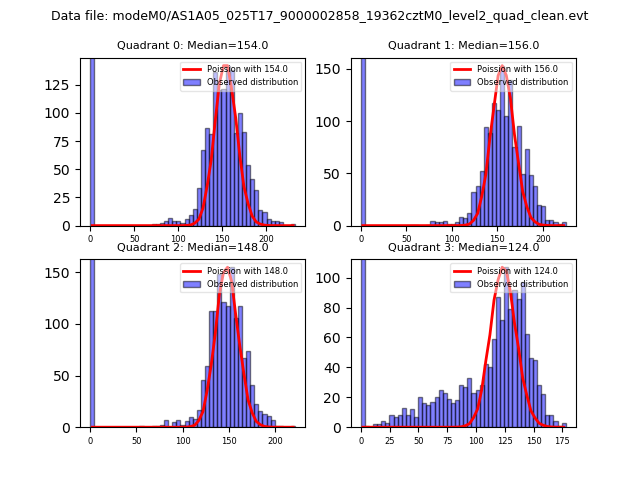
| Comparison with Poisson distribution Blue bars denote a histogram of data divided into 1 sec bins. Red curve is a Poisson curve with rate = median count rate of data. |
 |
 |
| Quadrant-wise count rates Data is divided into 100 sec bins |
 |
|
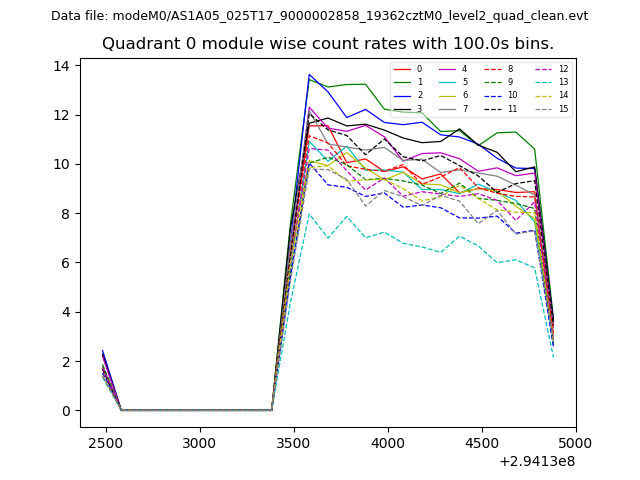
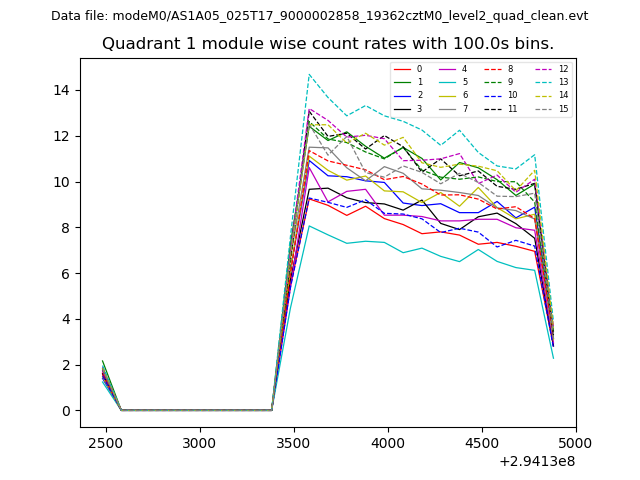
| Module-wise count rates for Quadrant A Data is divided into 100 sec bins |
 |
 |
| Module-wise count rates for Quadrant B Data is divided into 100 sec bins |
 |
 |
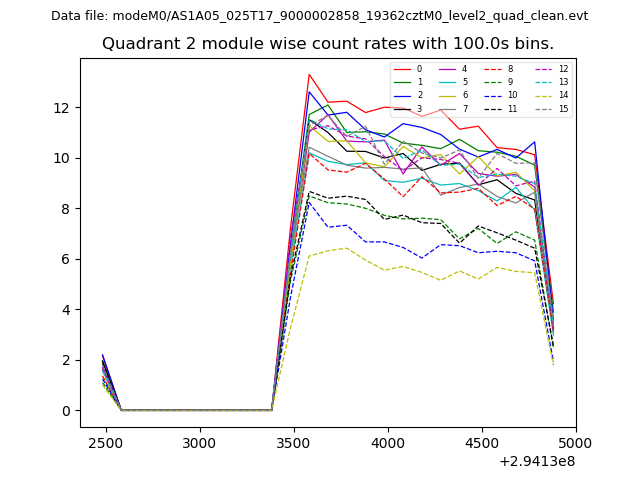
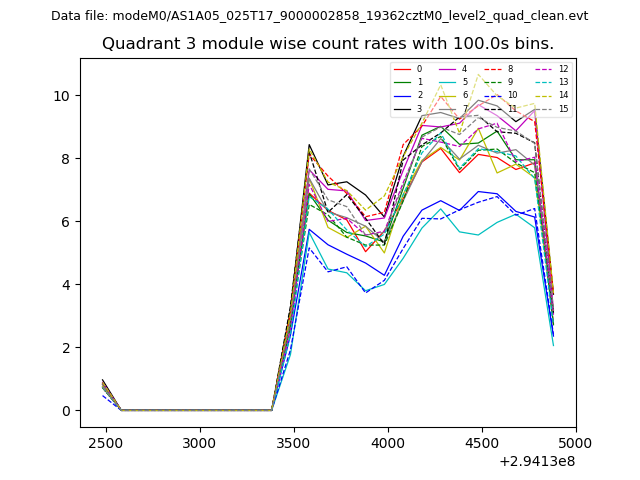
| Module-wise count rates for Quadrant C Data is divided into 100 sec bins |
 |
 |
| Module-wise count rates for Quadrant D Data is divided into 100 sec bins |
 |
 |
| Parameter | Plot |
|---|---|
| CZT HV Monitor | 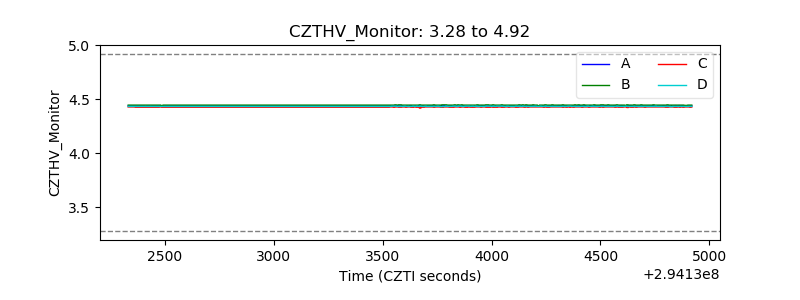 |
| D_VDD | 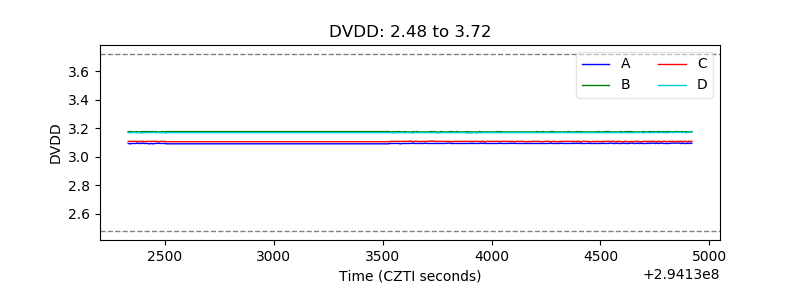 |
| Temperature 1 | 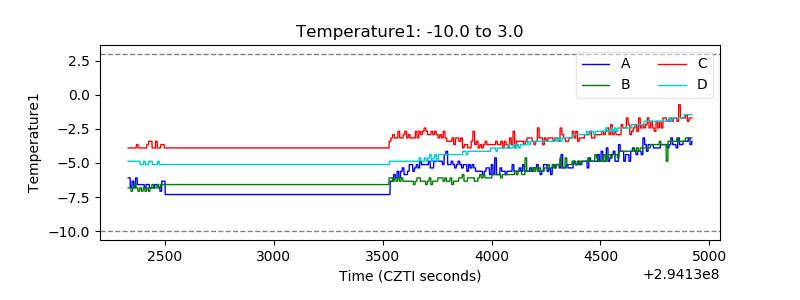 |
| Veto HV Monitor | 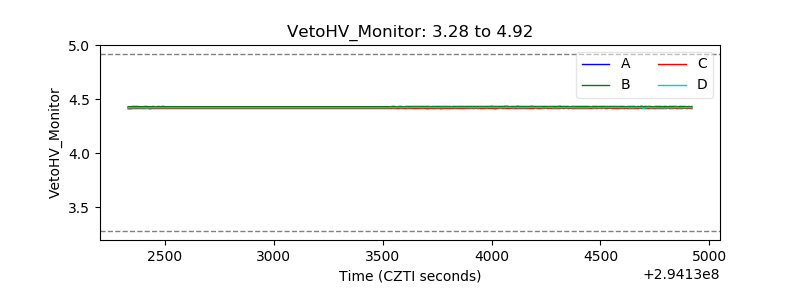 |
| Veto LLD | 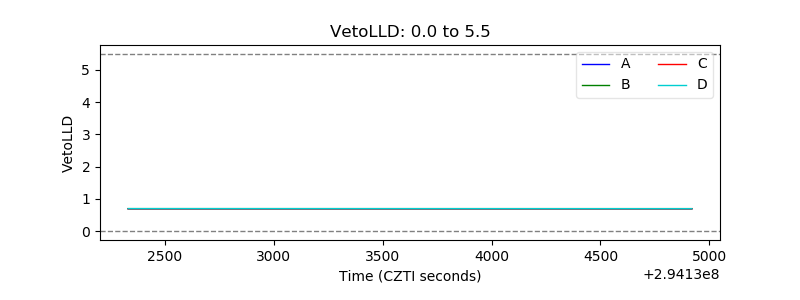 |
| Alpha Counter | 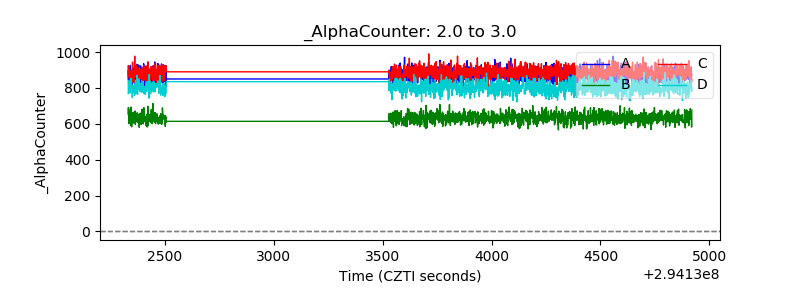 |
| _CPM_Rate | 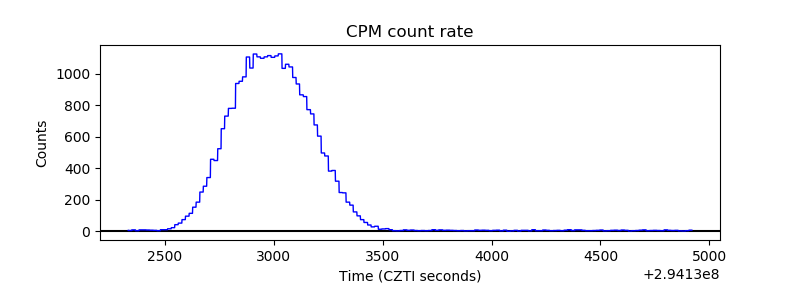 |
| CZT Counter | 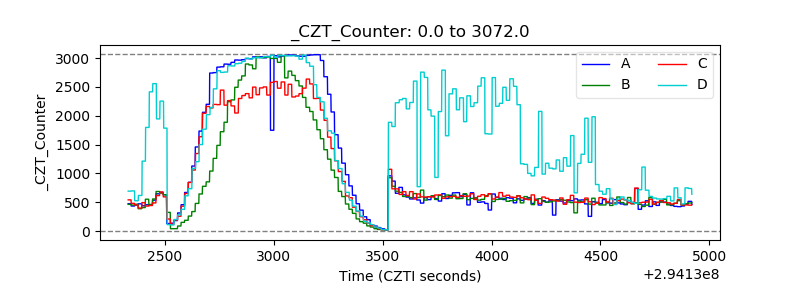 |
| +2.5 Volts monitor |  |
| +5 Volts monitor |  |
| _ROLL_ROT | 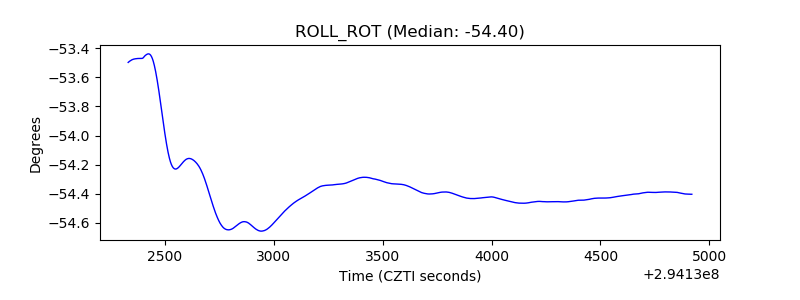 |
| _Roll_DEC | 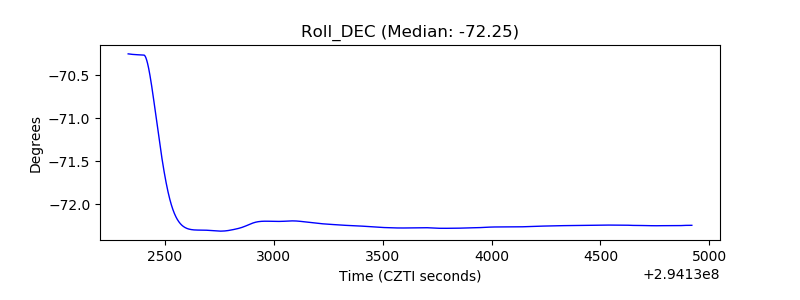 |
| _Roll_RA | 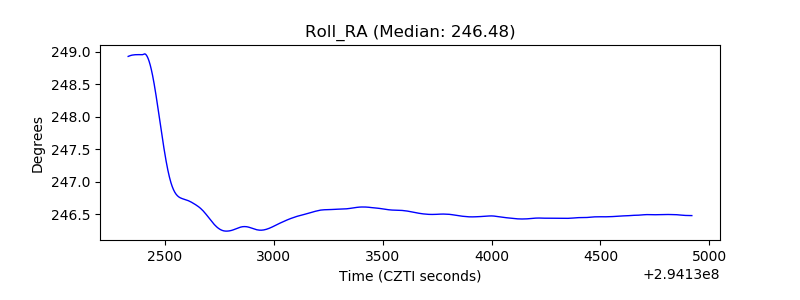 |
| Veto Counter | 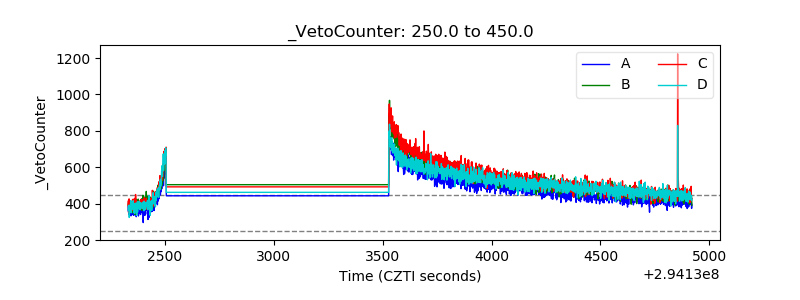 |