| Param | Original file | Final file |
|---|---|---|
| Filename | modeM0/AS1A05_227T03_9000002862cztM0_level2.fits | modeM0/AS1A05_227T03_9000002862cztM0_level2_quad_clean.evt |
| Size (bytes) | 45,538,560 | 33,189,120 |
| Size | 43.4 MB | 31.7 MB |
| Events in quadrant A | 280,508 | 183,352 |
| Events in quadrant B | 273,594 | 181,933 |
| Events in quadrant C | 276,512 | 166,929 |
| Events in quadrant D | 216,192 | 139,663 |
| Mode M0 | |||
|---|---|---|---|
| Quadrant | BADHDUFLAG | Total packets | Discarded packets |
| A | 0 | 9767 | 0 |
| B | 0 | 10214 | 0 |
| C | 0 | 9875 | 0 |
| D | 0 | 20335 | 0 |
| Mode M9 | |||
|---|---|---|---|
| Quadrant | BADHDUFLAG | Total packets | Discarded packets |
| A | 0 | 10 | 0 |
| B | 0 | 10 | 0 |
| C | 0 | 10 | 0 |
| D | 0 | 10 | 0 |
| Mode SS | |||
|---|---|---|---|
| Quadrant | BADHDUFLAG | Total packets | Discarded packets |
| A | 0 | 96 | 0 |
| B | 0 | 96 | 0 |
| C | 0 | 96 | 0 |
| D | 0 | 96 | 0 |
| Quadrant | Total seconds | Saturated seconds | Saturation percentage |
|---|---|---|---|
| A | 4732 | 37 | 0.781910% |
| B | 4732 | 71 | 1.500423% |
| C | 4732 | 61 | 1.289096% |
| D | 4732 | 858 | 18.131868% |
Noise dominated data is calculated using 1-second bins in cleaned event files. If a bin has >2000 counts, and if more than 50% of those come from <1% of pixels, then it is considered to be noise-dominated and hence unusable.
| Quadrant | # 1 sec bins | Bins with >0 counts | Bins with >2000 counts | High rate bins dominated by noise | Noise dominated (total time) | Noise dominated (detector-on time) | Marked lightcurve |
|---|---|---|---|---|---|---|---|
| A | 5747 | 4731 | 0 | 0 | 0.00% | 0.00% | 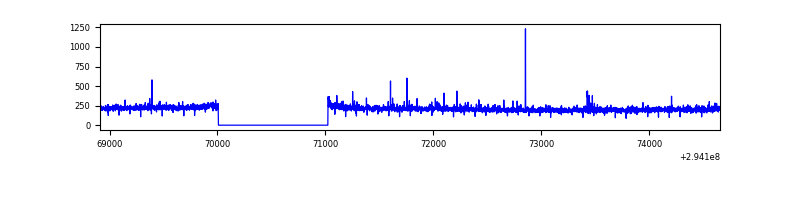 |
| B | 5747 | 4732 | 0 | 0 | 0.00% | 0.00% | 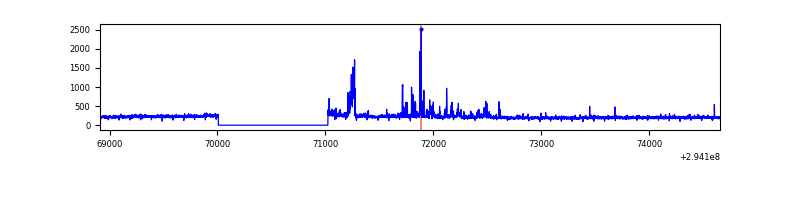 |
| C | 5747 | 4731 | 0 | 0 | 0.00% | 0.00% | 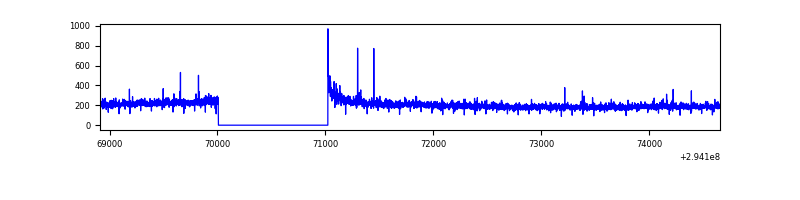 |
| D | 5747 | 4725 | 0 | 0 | 0.00% | 0.00% | 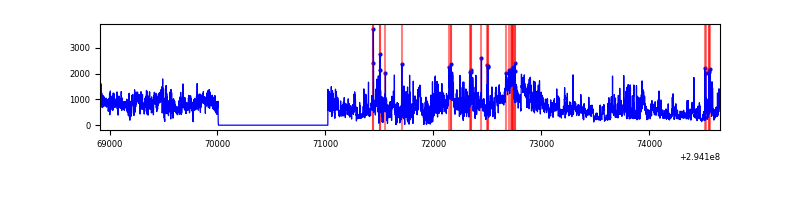 |
Top three noisy pixels from each quadrant. If the there are fewer than three noisy pixels in the level2.evt file, extra rows are filled as -1
| Pixel properties | Quadrant properties | ||||||
|---|---|---|---|---|---|---|---|
| Quadrant | DetID | PixID | Counts | Sigma | Mean | Median | Sigma |
| A | 0 | 29 | 267 | 10.2 | 73 | 69 | 19.4 |
| A | 7 | 110 | 238 | 8.71 | 73 | 69 | 19.4 |
| A | 0 | 30 | 224 | 7.99 | 73 | 69 | 19.4 |
| B | 2 | 9 | 236 | 10.22 | 72 | 69 | 16.3 |
| B | 2 | 8 | 215 | 8.93 | 72 | 69 | 16.3 |
| B | 3 | 17 | 182 | 6.91 | 72 | 69 | 16.3 |
| C | 1 | 81 | 207 | 6.87 | 73 | 69 | 20.1 |
| C | 1 | 80 | 207 | 6.87 | 73 | 69 | 20.1 |
| C | 12 | 241 | 201 | 6.57 | 73 | 69 | 20.1 |
| D | 3 | 159 | 164 | 5.98 | 61 | 56 | 18.1 |
| D | 6 | 67 | 160 | 5.75 | 61 | 56 | 18.1 |
| D | 4 | 246 | 160 | 5.75 | 61 | 56 | 18.1 |
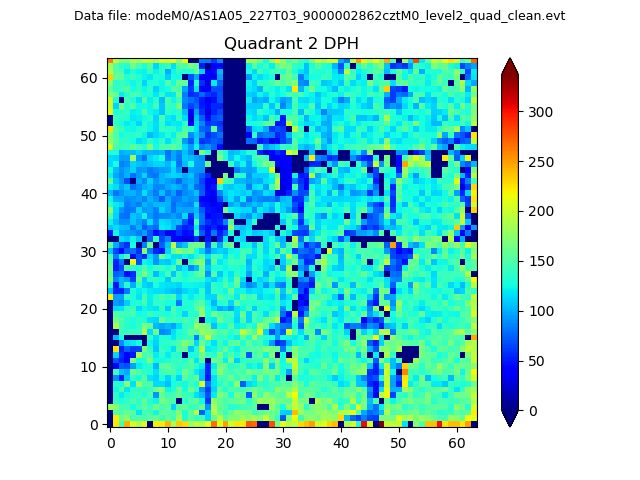
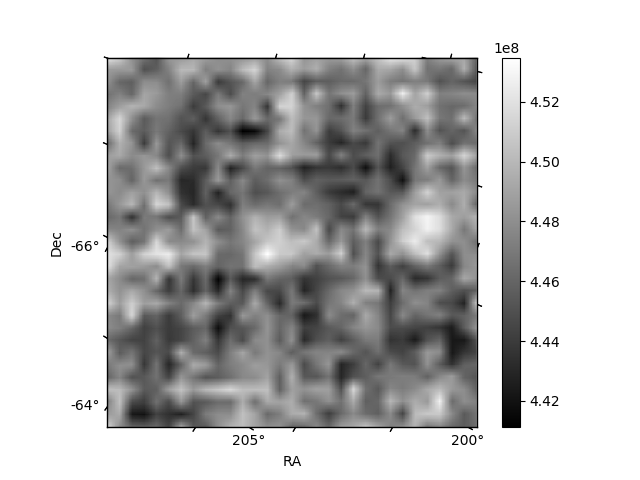
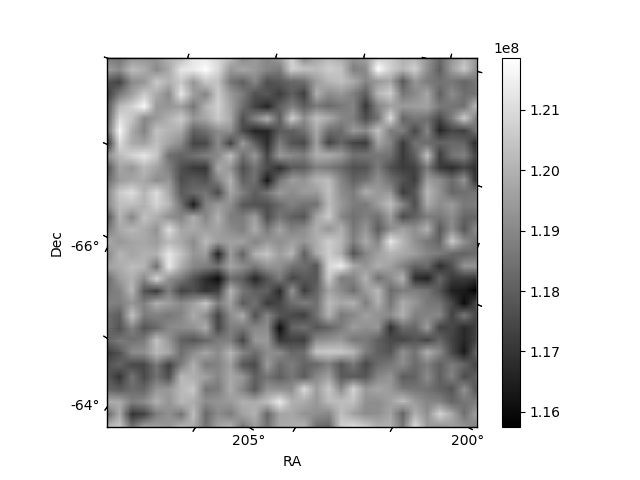
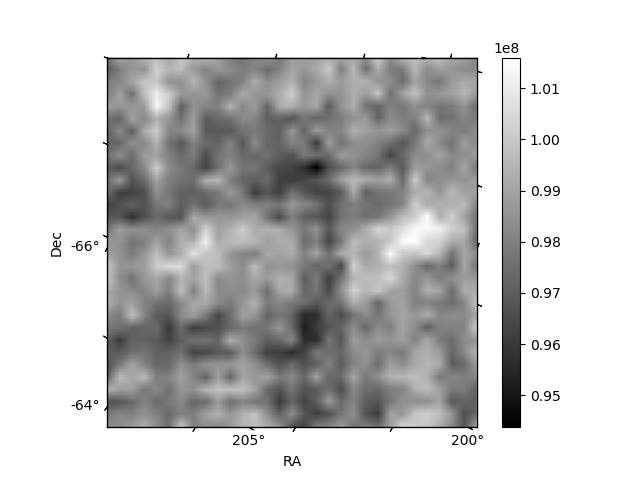
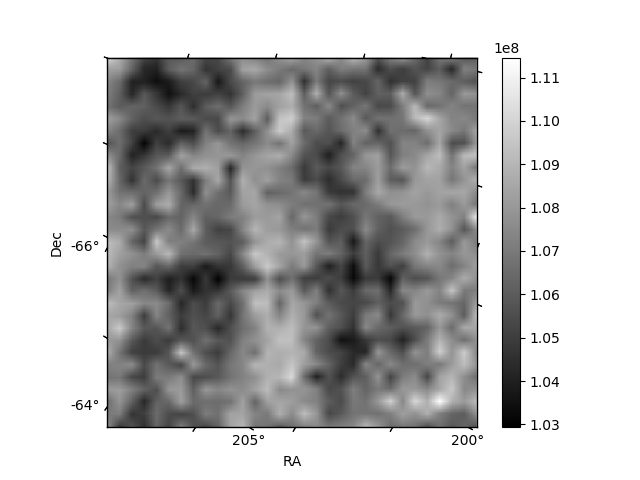
Histogram calculated using DETX and DETY for each event in the final _common_clean file
| Quadrant A | 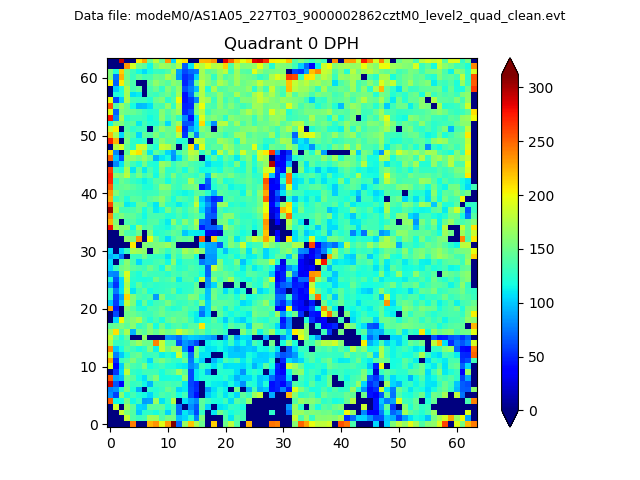 |
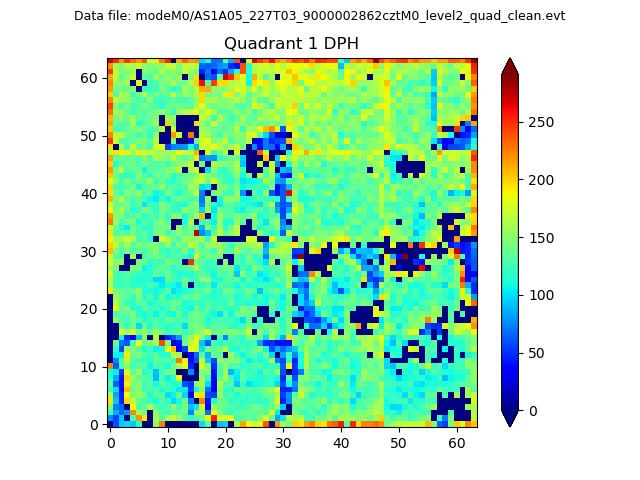 |
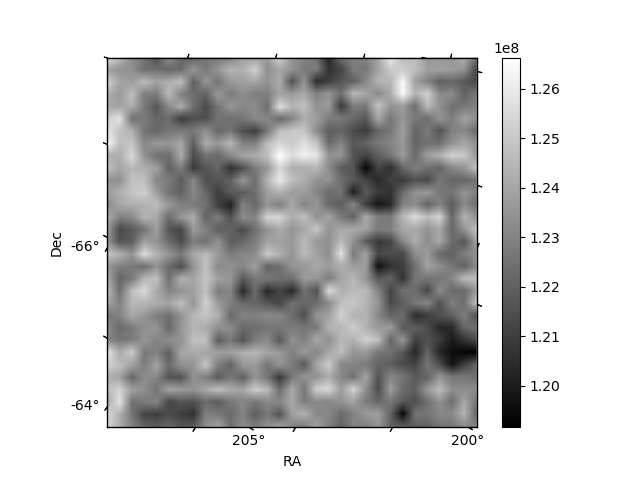
Quadrant B |
|---|---|---|---|
| Quadrant D | 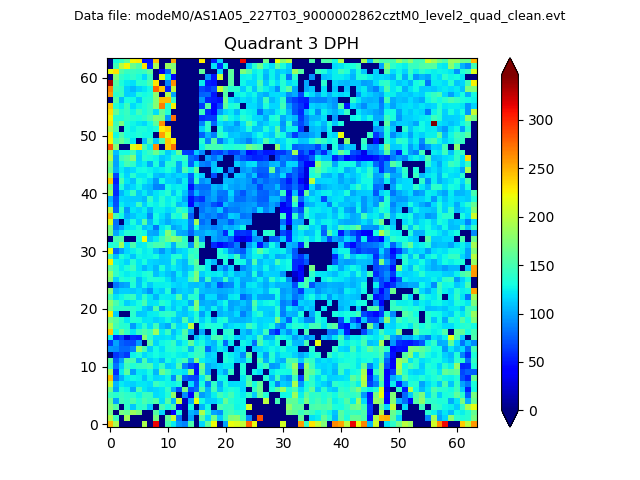 |
 |
Quadrant C |
| Plot type | Count rate plots | Images |
|---|---|---|
| Comparison with Poisson distribution Blue bars denote a histogram of data divided into 1 sec bins. Red curve is a Poisson curve with rate = median count rate of data. |
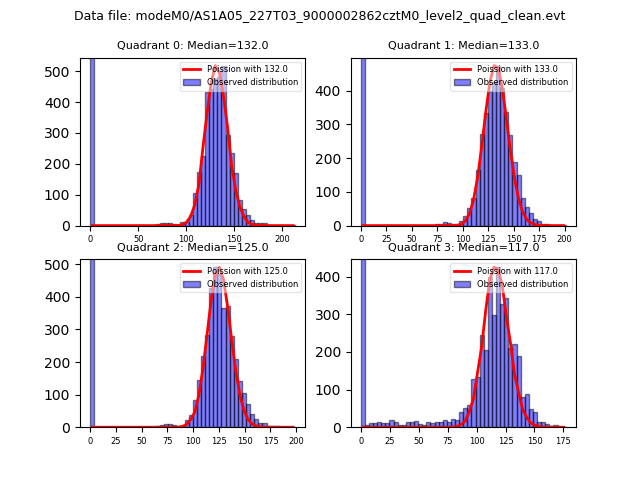 |
 |
| Quadrant-wise count rates Data is divided into 100 sec bins |
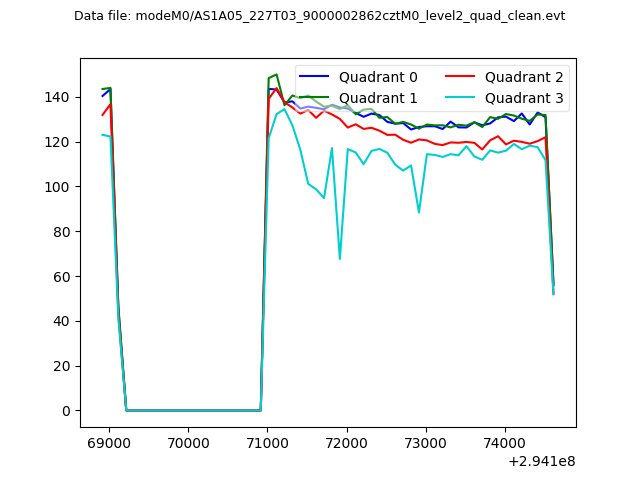 |
|
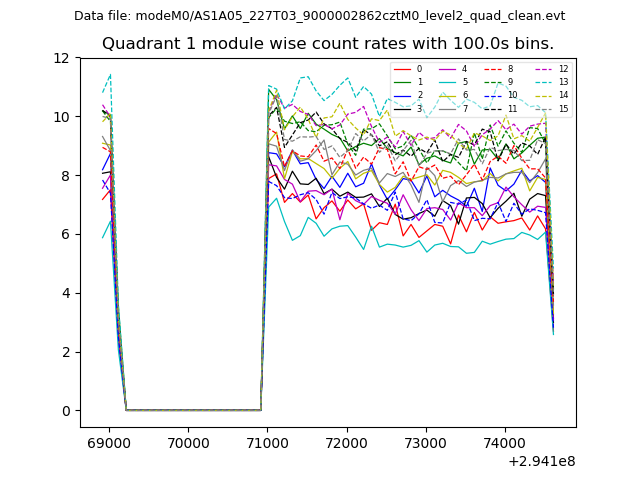
| Module-wise count rates for Quadrant A Data is divided into 100 sec bins |
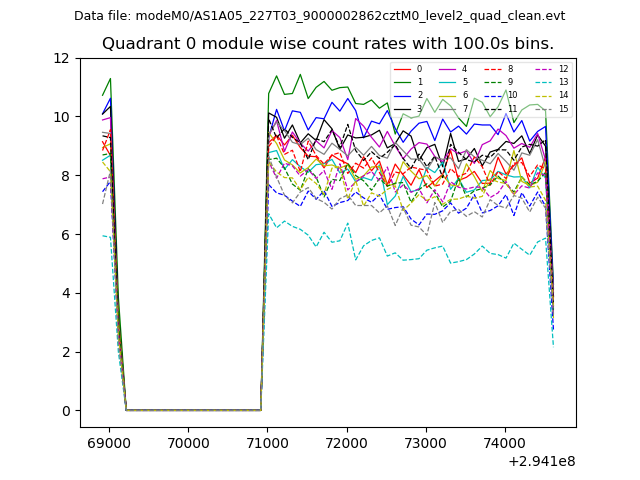 |
 |
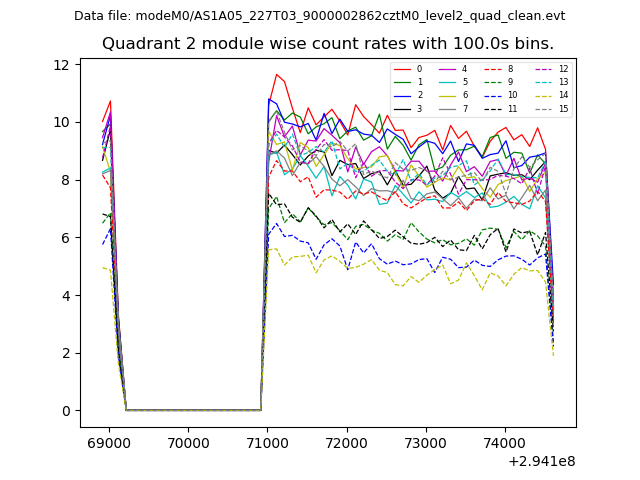
| Module-wise count rates for Quadrant B Data is divided into 100 sec bins |
 |
 |
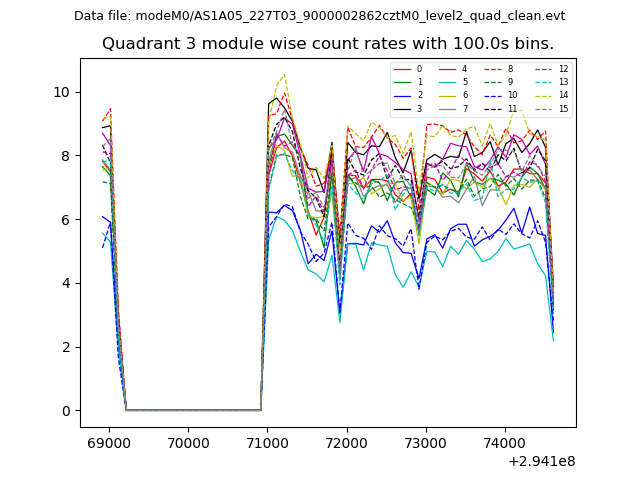
| Module-wise count rates for Quadrant C Data is divided into 100 sec bins |
 |
 |
| Module-wise count rates for Quadrant D Data is divided into 100 sec bins |
 |
 |
| Parameter | Plot |
|---|---|
| CZT HV Monitor | 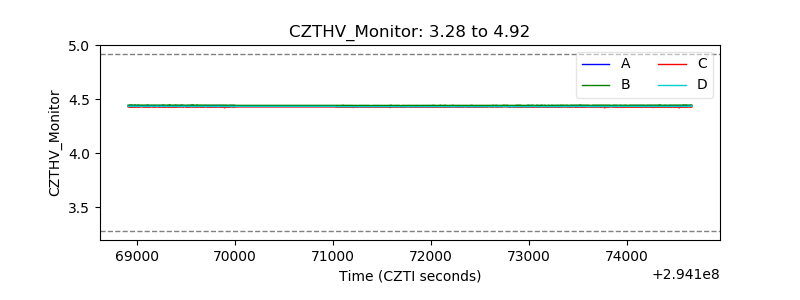 |
| D_VDD | 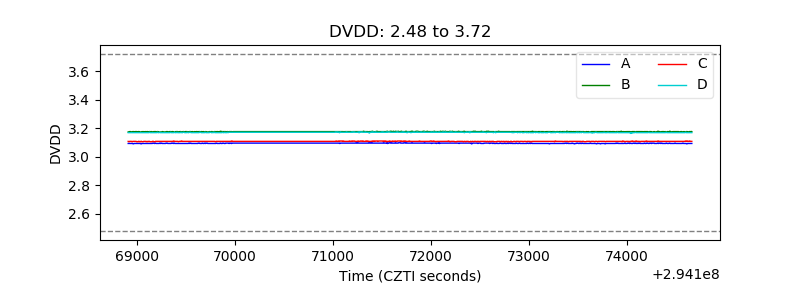 |
| Temperature 1 | 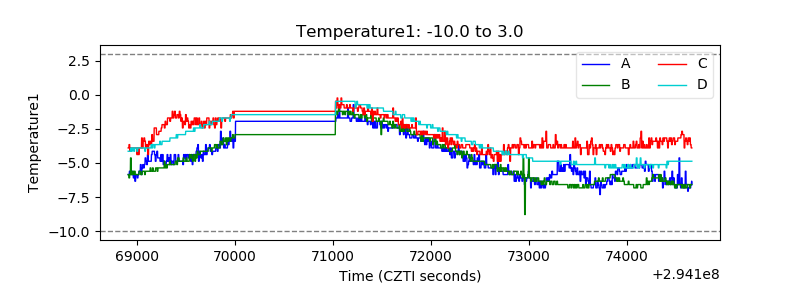 |
| Veto HV Monitor | 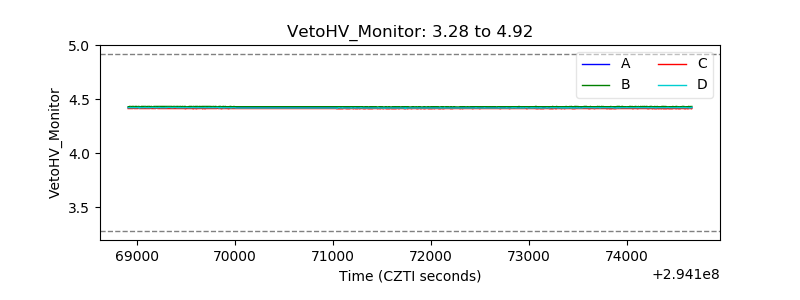 |
| Veto LLD | 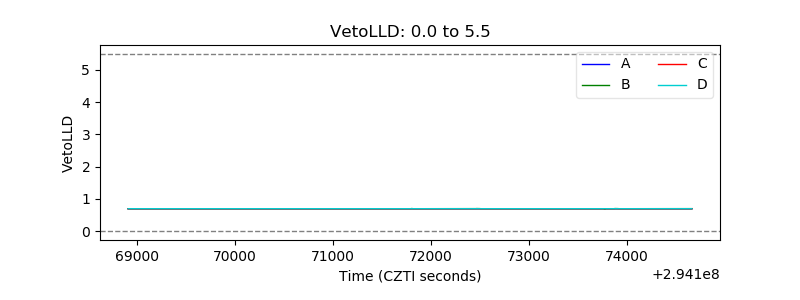 |
| Alpha Counter | 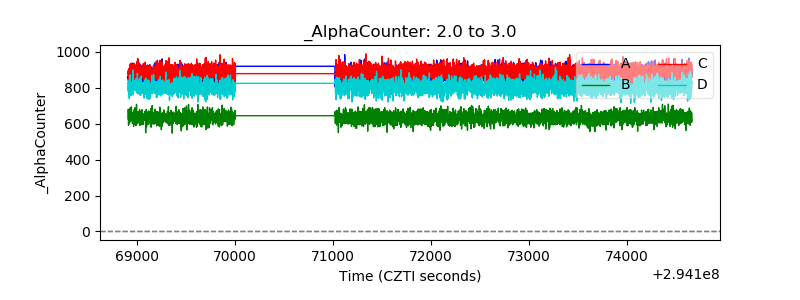 |
| _CPM_Rate | 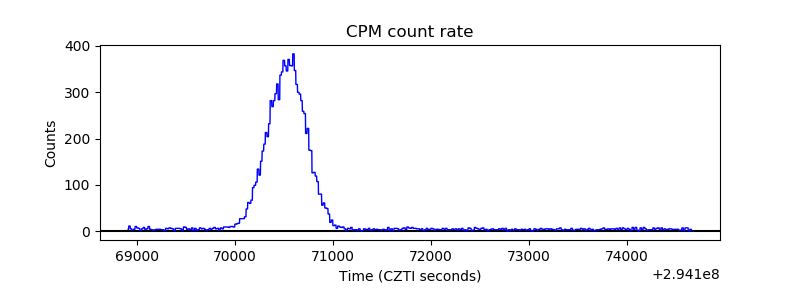 |
| CZT Counter | 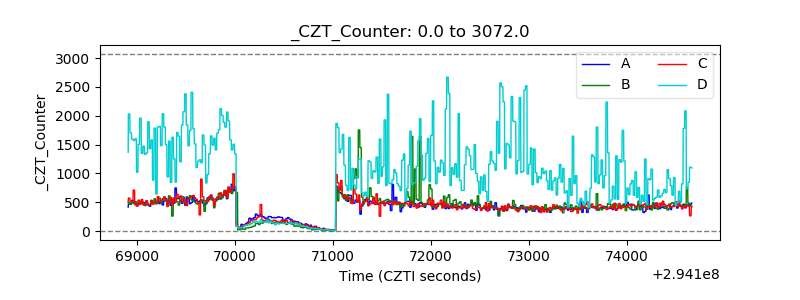 |
| +2.5 Volts monitor | 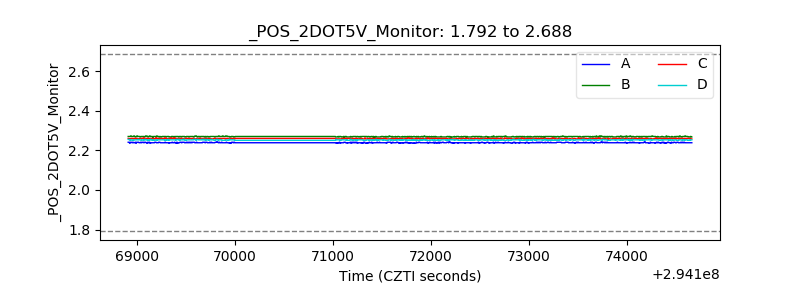 |
| +5 Volts monitor | 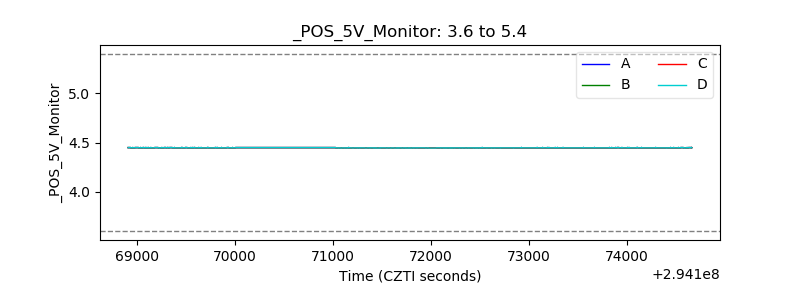 |
| _ROLL_ROT | 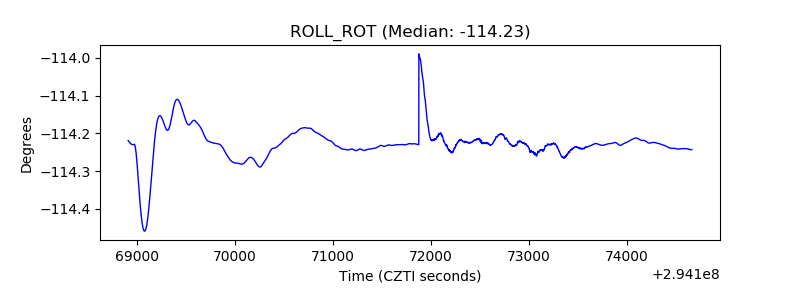 |
| _Roll_DEC | 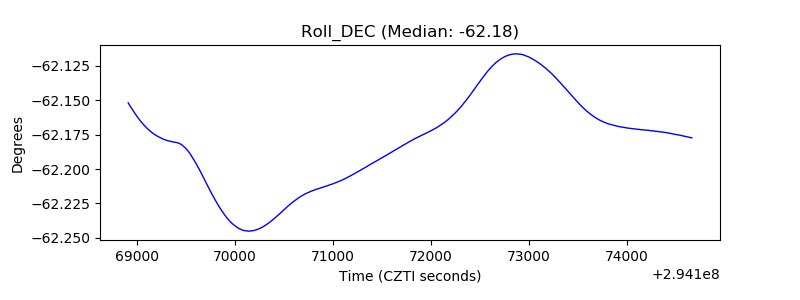 |
| _Roll_RA | 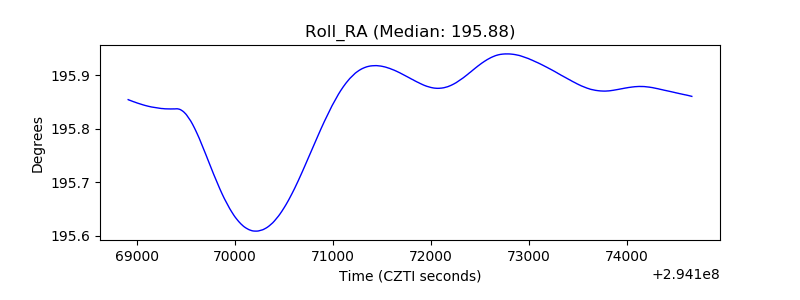 |
| Veto Counter | 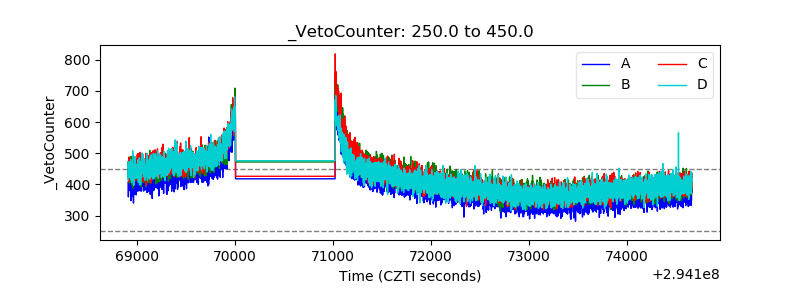 |