| Param | Original file | Final file |
|---|---|---|
| Filename | modeM0/AS1A05_174T01_9000003008_20335cztM0_level2.evt | modeM0/AS1A05_174T01_9000003008_20335cztM0_level2_quad_clean.evt |
| Size (bytes) | 481,582,080 | 110,168,640 |
| Size | 459.3 MB | 105.1 MB |
| Events in quadrant A | 3,073,015 | 734,025 |
| Events in quadrant B | 3,378,504 | 761,272 |
| Events in quadrant C | 3,220,890 | 737,201 |
| Events in quadrant D | 4,496,021 | 675,992 |
| Mode M9 | |||
|---|---|---|---|
| Quadrant | BADHDUFLAG | Total packets | Discarded packets |
| A | 0 | 17 | 0 |
| B | 0 | 18 | 0 |
| C | 0 | 18 | 0 |
| D | 0 | 18 | 0 |
| Mode M0 | |||
|---|---|---|---|
| Quadrant | BADHDUFLAG | Total packets | Discarded packets |
| A | 0 | 12976 | 2 |
| B | 0 | 14006 | 2 |
| C | 0 | 13406 | 2 |
| D | 0 | 17361 | 2 |
| Mode SS | |||
|---|---|---|---|
| Quadrant | BADHDUFLAG | Total packets | Discarded packets |
| A | 0 | 124 | 0 |
| B | 0 | 124 | 0 |
| C | 0 | 124 | 0 |
| D | 0 | 124 | 0 |
| Quadrant | Total seconds | Saturated seconds | Saturation percentage |
|---|---|---|---|
| A | 6134 | 14 | 0.228236% |
| B | 6134 | 76 | 1.238996% |
| C | 6134 | 68 | 1.108575% |
| D | 6134 | 543 | 8.852299% |
Noise dominated data is calculated using 1-second bins in cleaned event files. If a bin has >2000 counts, and if more than 50% of those come from <1% of pixels, then it is considered to be noise-dominated and hence unusable.
| Quadrant | # 1 sec bins | Bins with >0 counts | Bins with >2000 counts | High rate bins dominated by noise | Noise dominated (total time) | Noise dominated (detector-on time) | Marked lightcurve |
|---|---|---|---|---|---|---|---|
| A | 7429 | 6135 | 0 | 0 | 0.00% | 0.00% | 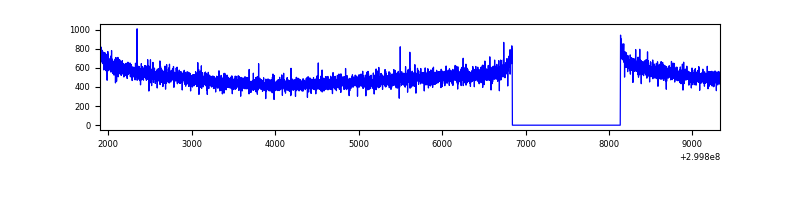 |
| B | 7429 | 6135 | 20 | 20 | 0.27% | 0.33% | 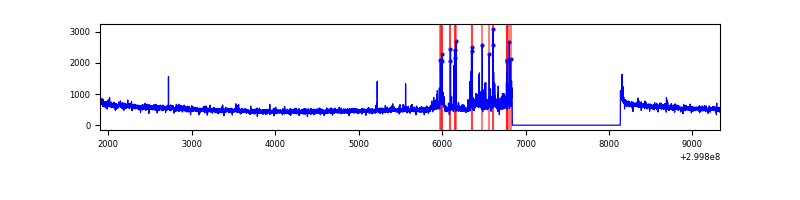 |
| C | 7429 | 6135 | 0 | 0 | 0.00% | 0.00% | 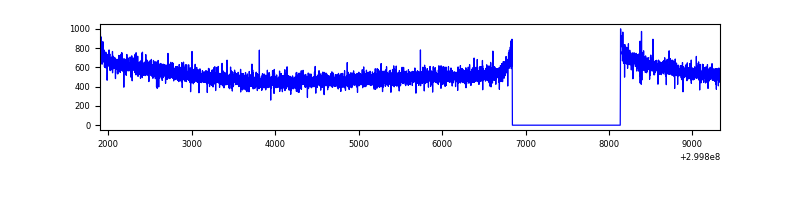 |
| D | 7429 | 6135 | 374 | 374 | 5.03% | 6.10% | 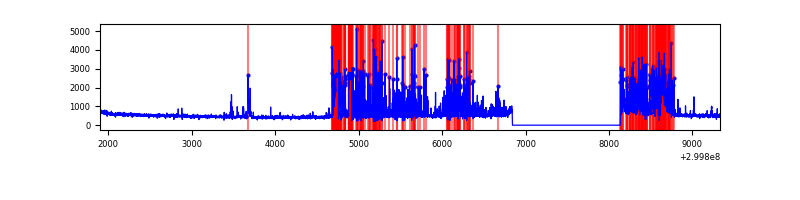 |
Top three noisy pixels from each quadrant. If the there are fewer than three noisy pixels in the level2.evt file, extra rows are filled as -1
| Pixel properties | Quadrant properties | ||||||
|---|---|---|---|---|---|---|---|
| Quadrant | DetID | PixID | Counts | Sigma | Mean | Median | Sigma |
| A | 13 | 254 | 7076 | 39.63 | 797 | 781 | 158.8 |
| A | 0 | 226 | 6874 | 38.36 | 797 | 781 | 158.8 |
| A | 3 | 137 | 6074 | 33.32 | 797 | 781 | 158.8 |
| B | 7 | 220 | 126673 | 846.86 | 802 | 783 | 148.7 |
| B | 4 | 80 | 52914 | 350.68 | 802 | 783 | 148.7 |
| B | 0 | 198 | 18755 | 120.89 | 802 | 783 | 148.7 |
| C | 14 | 238 | 125893 | 683.77 | 791 | 797 | 183.0 |
| C | 3 | 233 | 7183 | 34.91 | 791 | 797 | 183.0 |
| C | 1 | 16 | 5724 | 26.93 | 791 | 797 | 183.0 |
| D | 1 | 52 | 1572751 | 8599.16 | 758 | 738 | 182.8 |
| D | 2 | 16 | 49821 | 268.49 | 758 | 738 | 182.8 |
| D | 2 | 234 | 21902 | 115.77 | 758 | 738 | 182.8 |
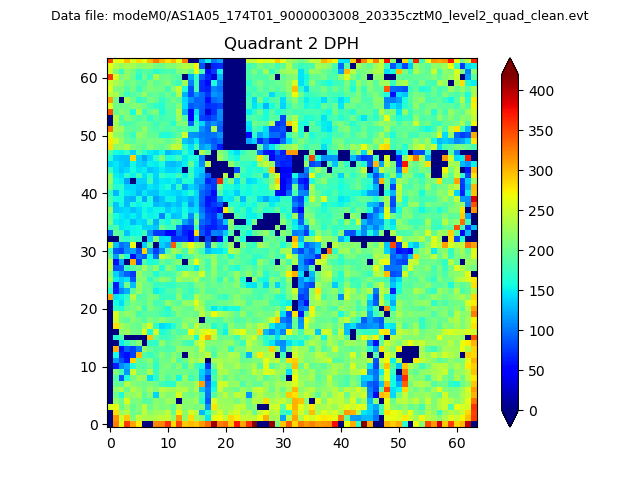
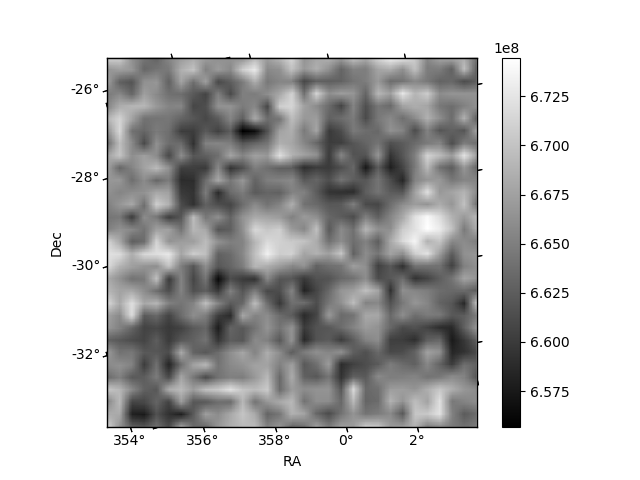
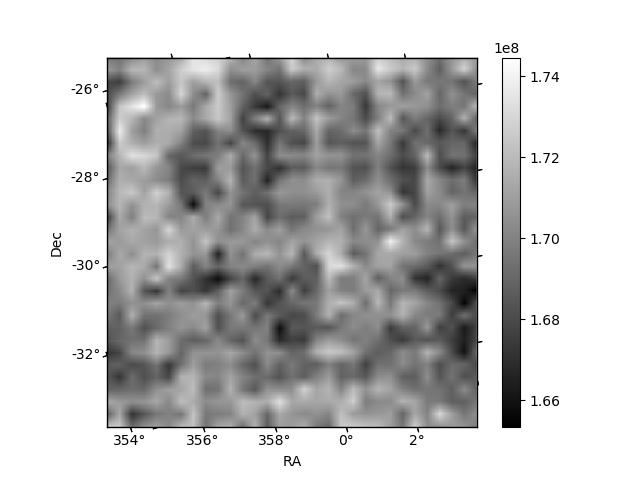
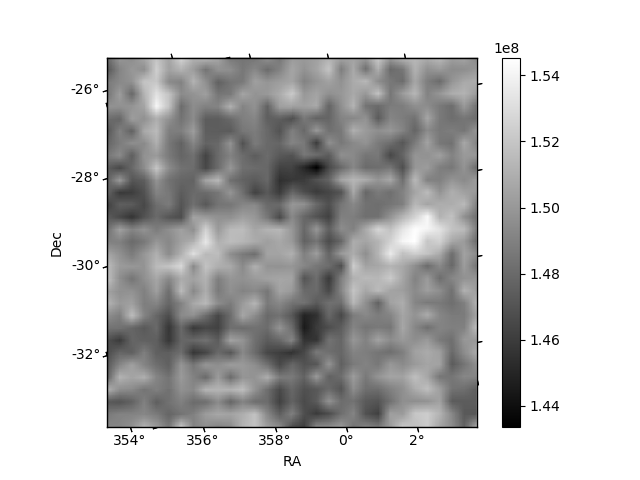
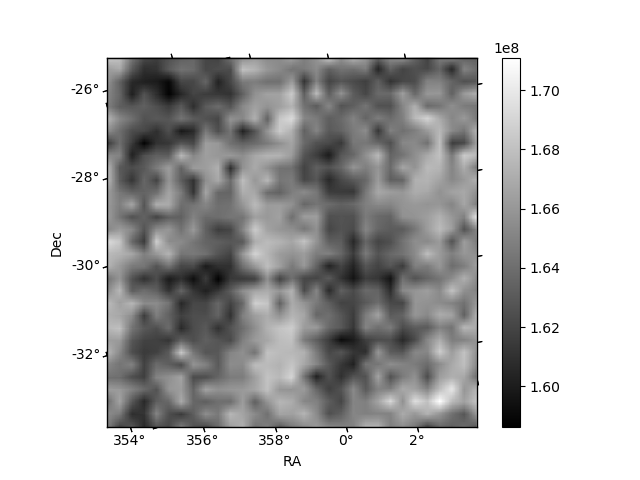
Histogram calculated using DETX and DETY for each event in the final _common_clean file
| Quadrant A | 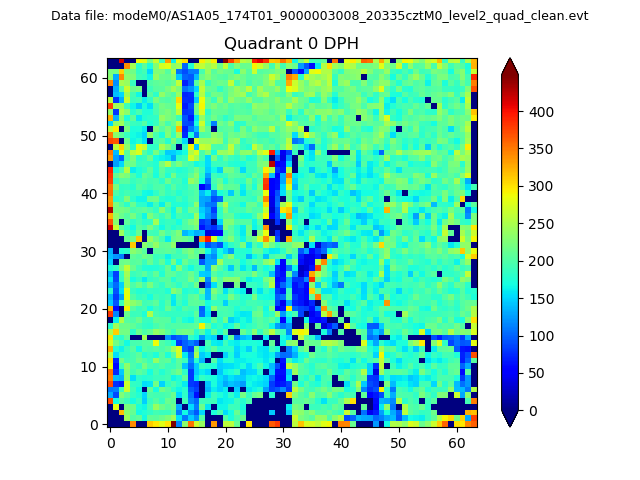 |
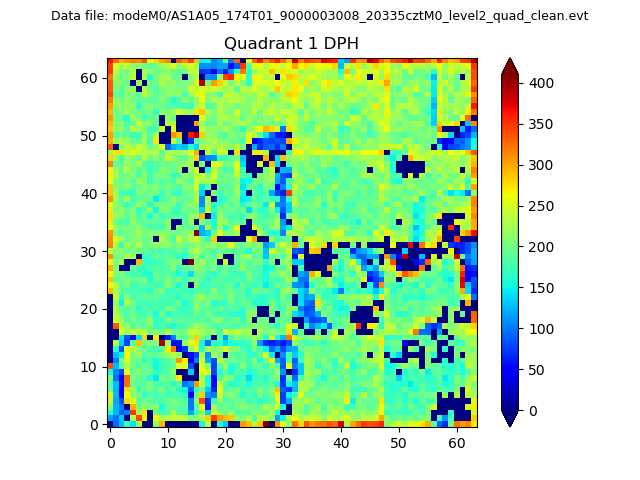 |
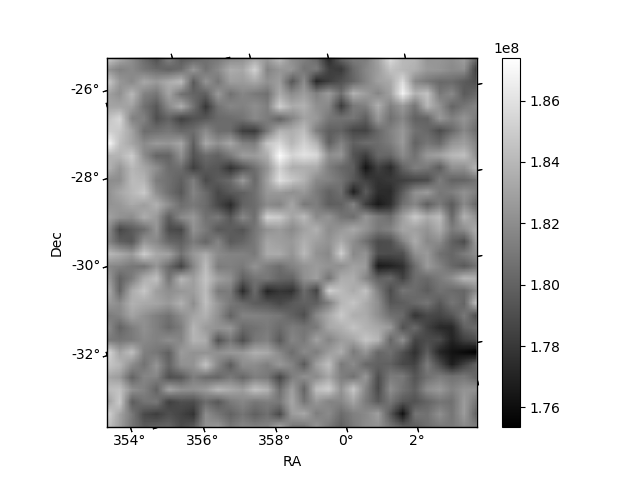
Quadrant B |
|---|---|---|---|
| Quadrant D | 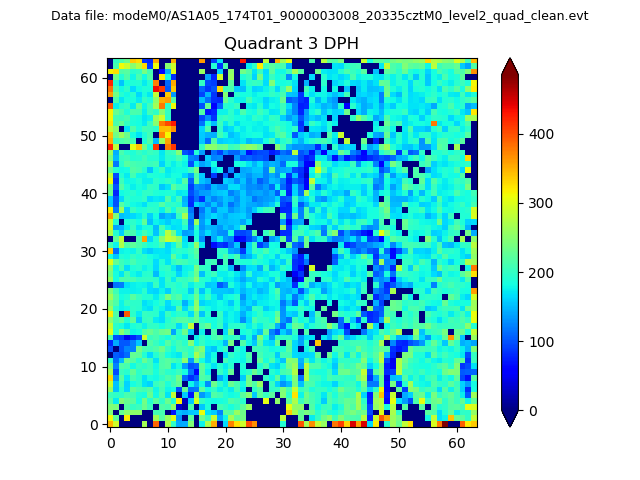 |
 |
Quadrant C |
| Plot type | Count rate plots | Images |
|---|---|---|
| Comparison with Poisson distribution Blue bars denote a histogram of data divided into 1 sec bins. Red curve is a Poisson curve with rate = median count rate of data. |
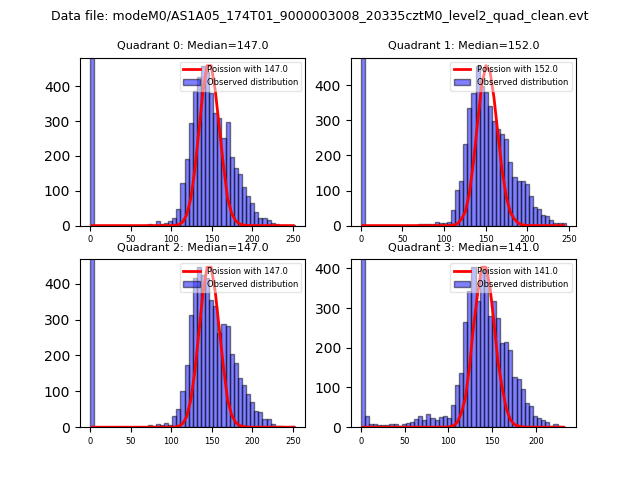 |
 |
| Quadrant-wise count rates Data is divided into 100 sec bins |
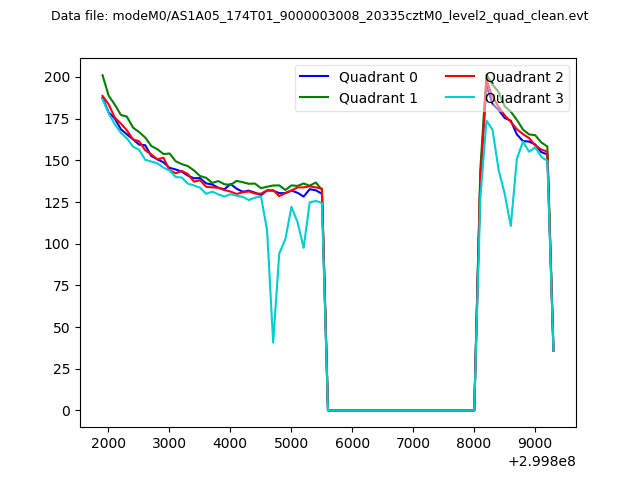 |
|
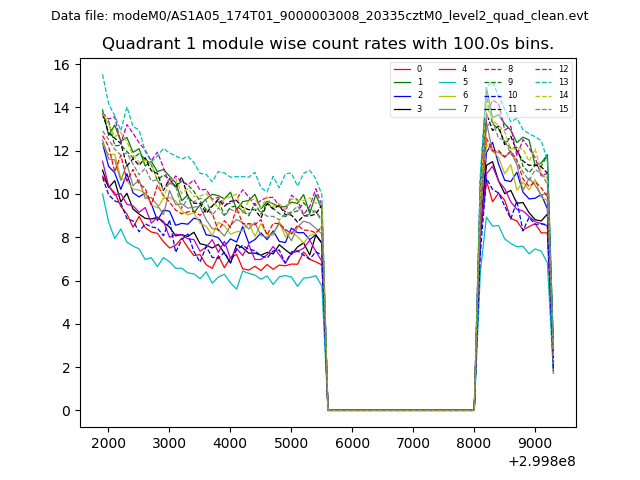
| Module-wise count rates for Quadrant A Data is divided into 100 sec bins |
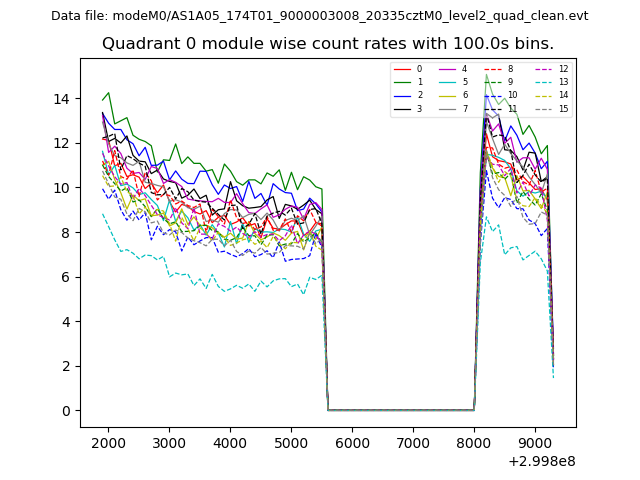 |
 |
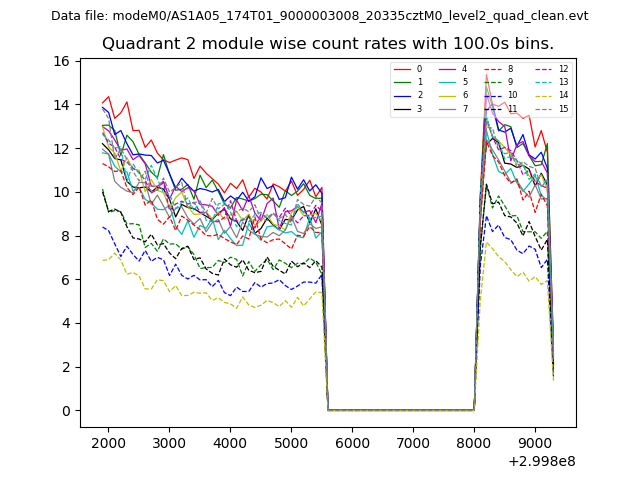
| Module-wise count rates for Quadrant B Data is divided into 100 sec bins |
 |
 |
| Module-wise count rates for Quadrant C Data is divided into 100 sec bins |
 |
 |
| Module-wise count rates for Quadrant D Data is divided into 100 sec bins |
 |
 |
| Parameter | Plot |
|---|---|
| CZT HV Monitor | 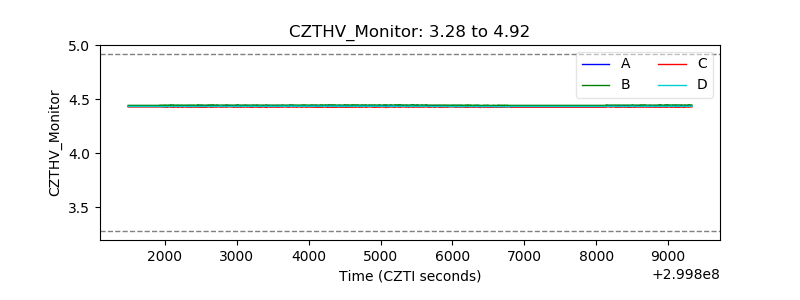 |
| D_VDD |  |
| Temperature 1 | 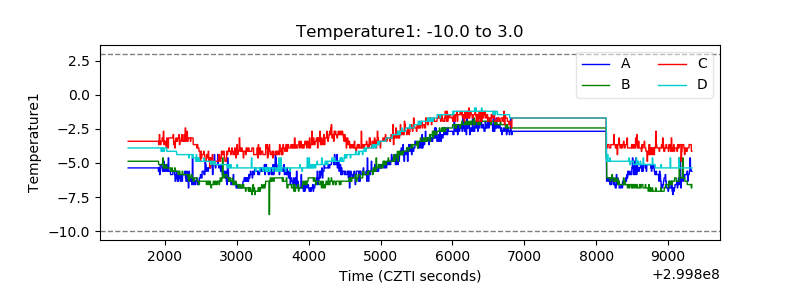 |
| Veto HV Monitor | 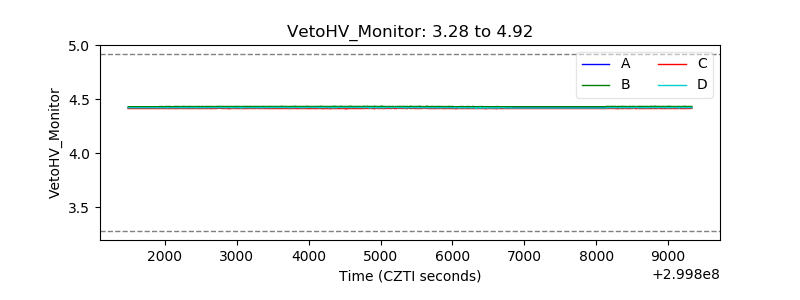 |
| Veto LLD | 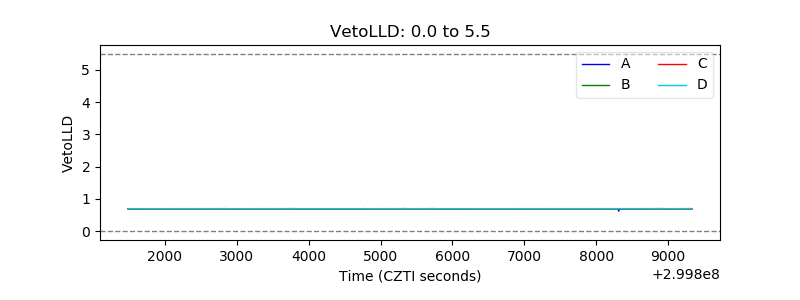 |
| Alpha Counter | 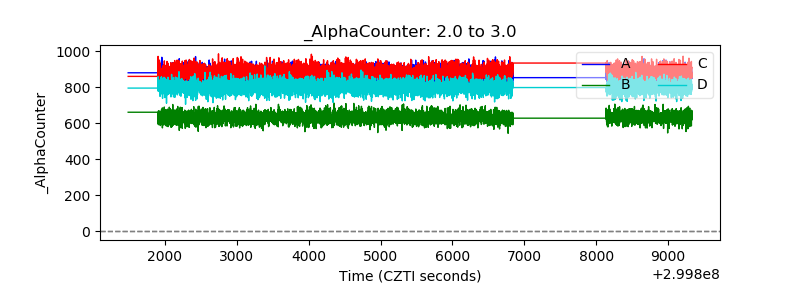 |
| _CPM_Rate | 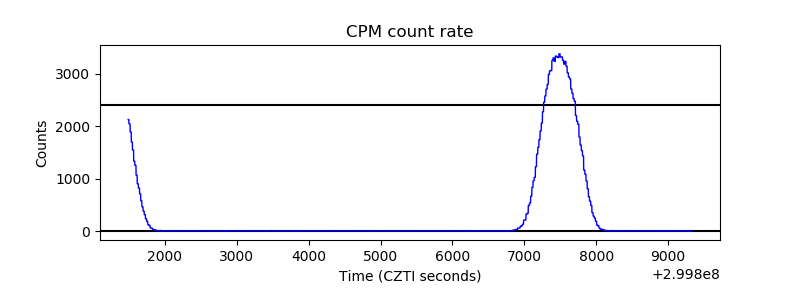 |
| CZT Counter | 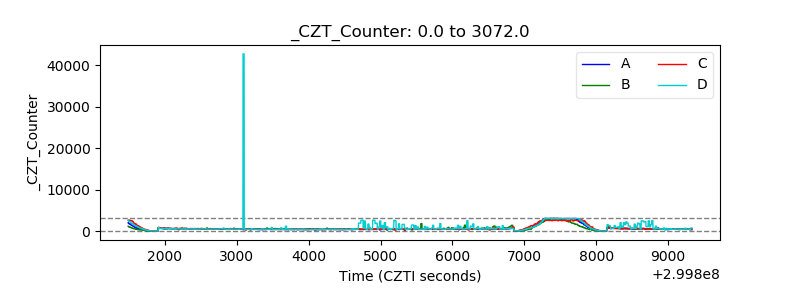 |
| +2.5 Volts monitor |  |
| +5 Volts monitor |  |
| _ROLL_ROT | 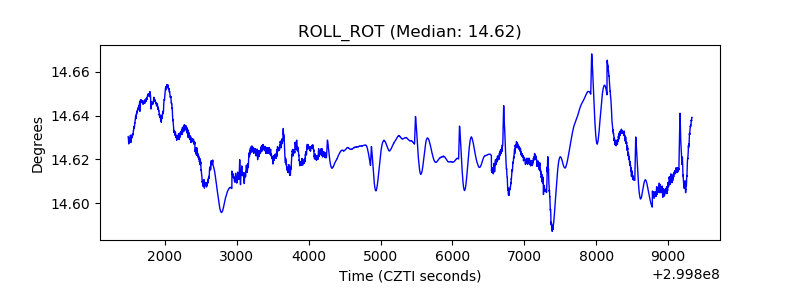 |
| _Roll_DEC |  |
| _Roll_RA | 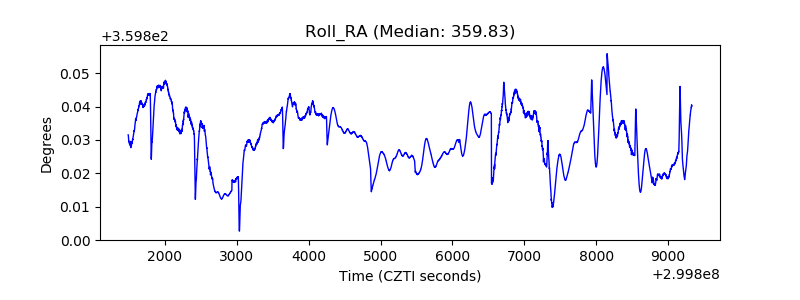 |
| Veto Counter | 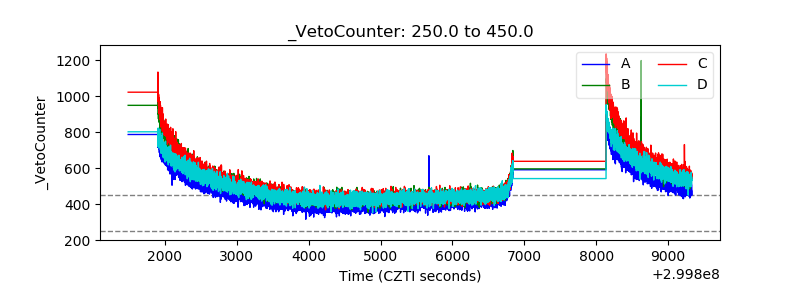 |