| Param | Original file | Final file |
|---|---|---|
| Filename | modeM0/AS1A05_163T01_9000003010_20337cztM0_level2.evt | modeM0/AS1A05_163T01_9000003010_20337cztM0_level2_quad_clean.evt |
| Size (bytes) | 309,343,680 | 56,520,000 |
| Size | 295.0 MB | 53.9 MB |
| Events in quadrant A | 2,255,536 | 351,859 |
| Events in quadrant B | 2,317,080 | 360,743 |
| Events in quadrant C | 2,288,619 | 345,348 |
| Events in quadrant D | 2,203,640 | 340,138 |
| Mode SS | |||
|---|---|---|---|
| Quadrant | BADHDUFLAG | Total packets | Discarded packets |
| A | 0 | 90 | 0 |
| B | 0 | 90 | 0 |
| C | 0 | 90 | 0 |
| D | 0 | 90 | 0 |
| Mode M0 | |||
|---|---|---|---|
| Quadrant | BADHDUFLAG | Total packets | Discarded packets |
| A | 0 | 9318 | 1 |
| B | 0 | 9446 | 1 |
| C | 0 | 9408 | 1 |
| D | 0 | 9409 | 1 |
| Mode M9 | |||
|---|---|---|---|
| Quadrant | BADHDUFLAG | Total packets | Discarded packets |
| A | 0 | 14 | 0 |
| B | 0 | 14 | 0 |
| C | 0 | 14 | 0 |
| D | 0 | 14 | 0 |
| Quadrant | Total seconds | Saturated seconds | Saturation percentage |
|---|---|---|---|
| A | 4455 | 22 | 0.493827% |
| B | 4455 | 45 | 1.010101% |
| C | 4455 | 61 | 1.369248% |
| D | 4455 | 12 | 0.269360% |
Noise dominated data is calculated using 1-second bins in cleaned event files. If a bin has >2000 counts, and if more than 50% of those come from <1% of pixels, then it is considered to be noise-dominated and hence unusable.
| Quadrant | # 1 sec bins | Bins with >0 counts | Bins with >2000 counts | High rate bins dominated by noise | Noise dominated (total time) | Noise dominated (detector-on time) | Marked lightcurve |
|---|---|---|---|---|---|---|---|
| A | 5795 | 4456 | 0 | 0 | 0.00% | 0.00% | 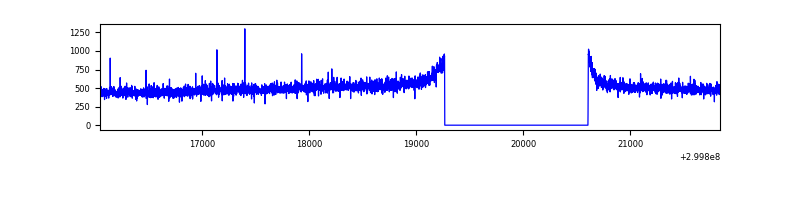 |
| B | 5795 | 4456 | 0 | 0 | 0.00% | 0.00% | 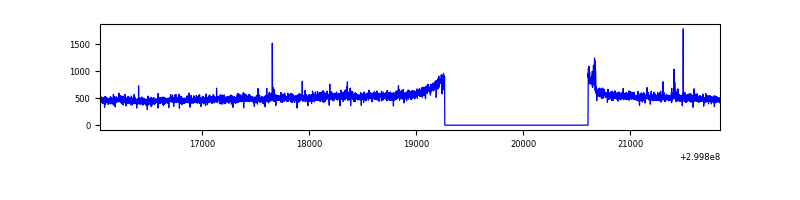 |
| C | 5795 | 4456 | 0 | 0 | 0.00% | 0.00% | 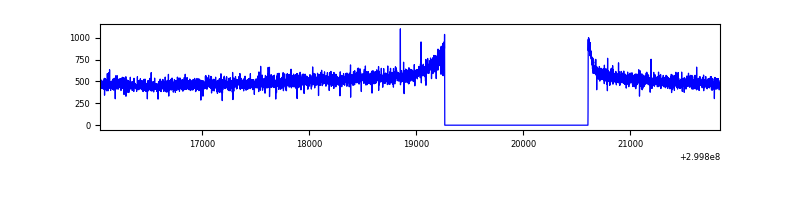 |
| D | 5795 | 4456 | 4 | 4 | 0.07% | 0.09% | 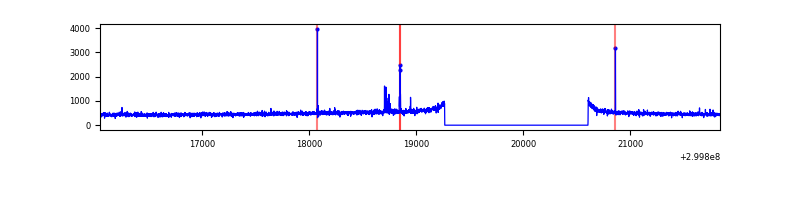 |
Top three noisy pixels from each quadrant. If the there are fewer than three noisy pixels in the level2.evt file, extra rows are filled as -1
| Pixel properties | Quadrant properties | ||||||
|---|---|---|---|---|---|---|---|
| Quadrant | DetID | PixID | Counts | Sigma | Mean | Median | Sigma |
| A | 0 | 226 | 5026 | 37.79 | 585 | 573 | 117.8 |
| A | 3 | 137 | 4590 | 34.09 | 585 | 573 | 117.8 |
| A | 13 | 254 | 4302 | 31.65 | 585 | 573 | 117.8 |
| B | 0 | 230 | 16116 | 140.53 | 584 | 570 | 110.6 |
| B | 12 | 111 | 13129 | 113.53 | 584 | 570 | 110.6 |
| B | 11 | 111 | 11851 | 101.98 | 584 | 570 | 110.6 |
| C | 14 | 238 | 88367 | 663.74 | 564 | 570 | 132.3 |
| C | 13 | 61 | 3958 | 25.61 | 564 | 570 | 132.3 |
| C | 1 | 16 | 1753 | 8.94 | 564 | 570 | 132.3 |
| D | 1 | 52 | 23869 | 168.12 | 571 | 554 | 138.7 |
| D | 2 | 234 | 17224 | 120.2 | 571 | 554 | 138.7 |
| D | 2 | 184 | 13280 | 91.76 | 571 | 554 | 138.7 |
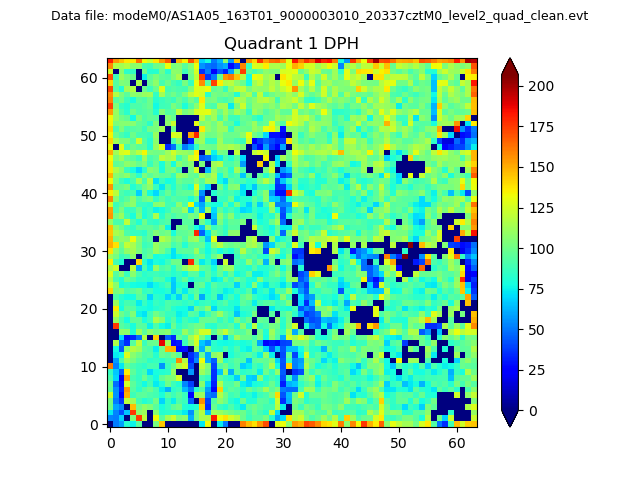
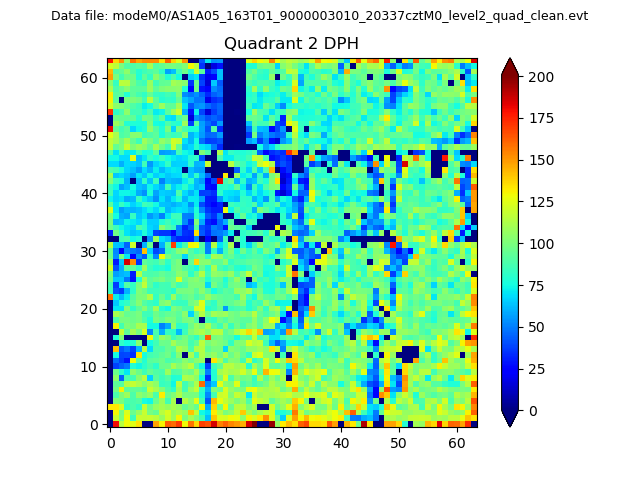
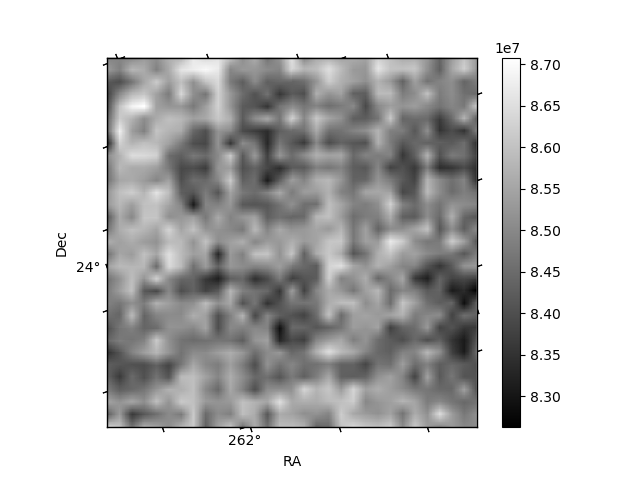
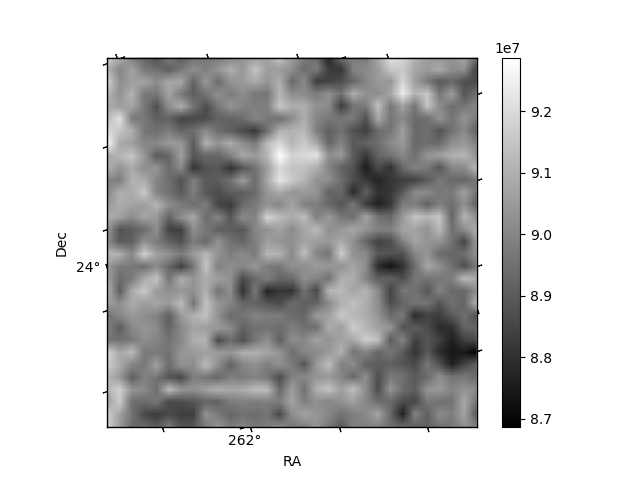
Histogram calculated using DETX and DETY for each event in the final _common_clean file
| Quadrant A |  |
 |
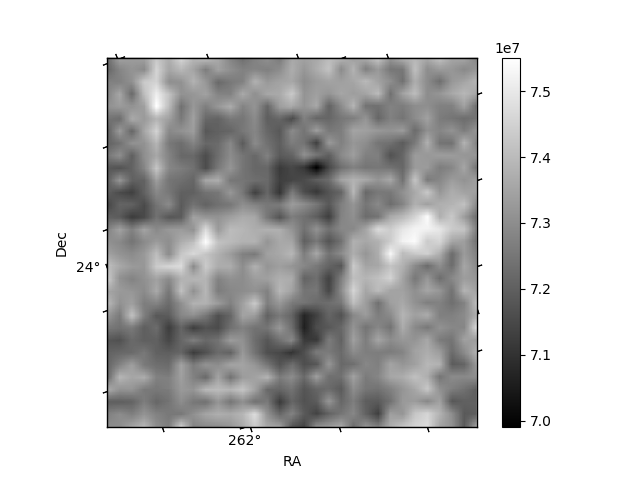
Quadrant B |
|---|---|---|---|
| Quadrant D |  |
 |
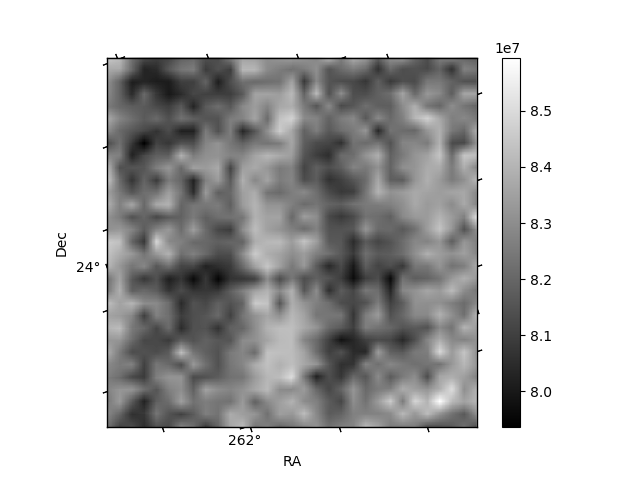
Quadrant C |
| Plot type | Count rate plots | Images |
|---|---|---|
| Comparison with Poisson distribution Blue bars denote a histogram of data divided into 1 sec bins. Red curve is a Poisson curve with rate = median count rate of data. |
 |
 |
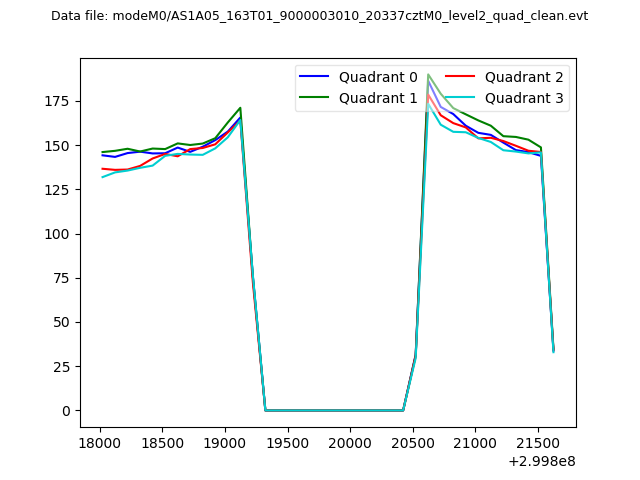
| Quadrant-wise count rates Data is divided into 100 sec bins |
 |
|
| Module-wise count rates for Quadrant A Data is divided into 100 sec bins |
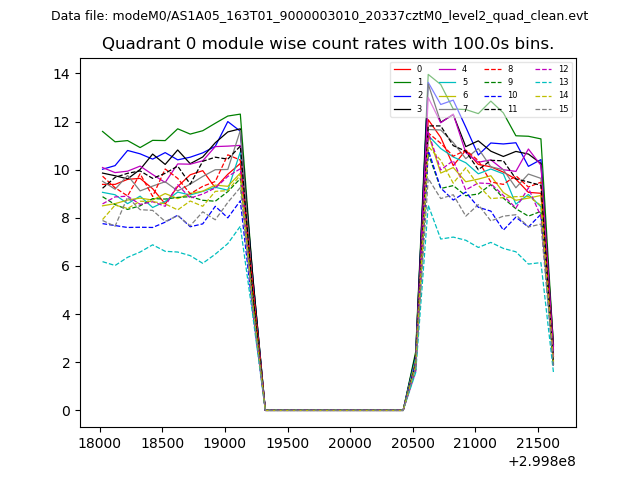 |
 |
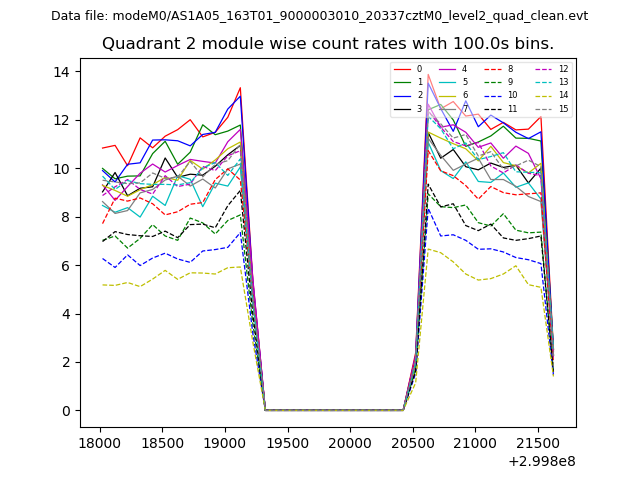
| Module-wise count rates for Quadrant B Data is divided into 100 sec bins |
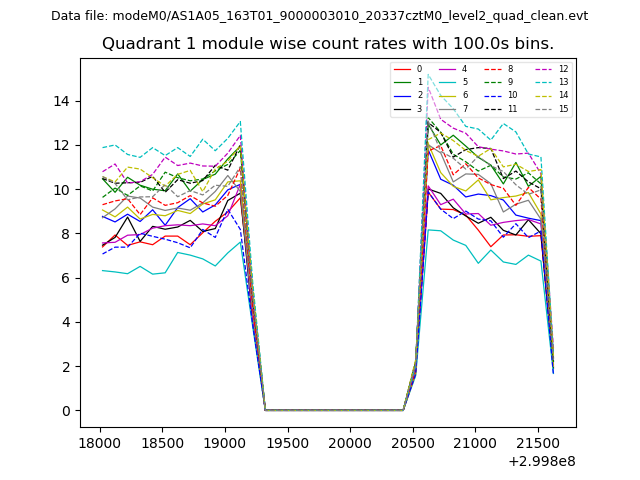 |
 |
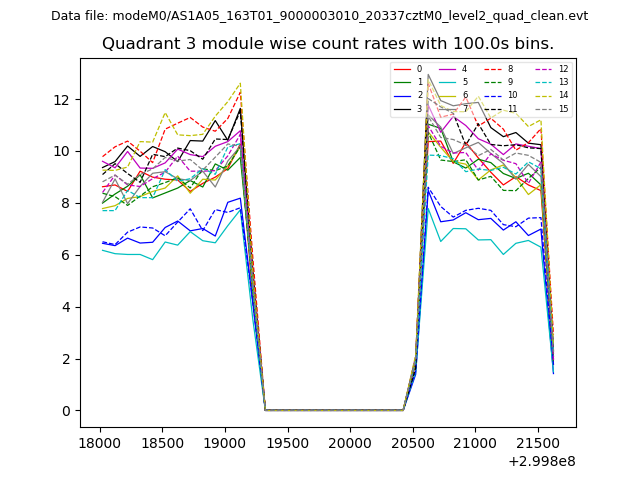
| Module-wise count rates for Quadrant C Data is divided into 100 sec bins |
 |
 |
| Module-wise count rates for Quadrant D Data is divided into 100 sec bins |
 |
 |
| Parameter | Plot |
|---|---|
| CZT HV Monitor | 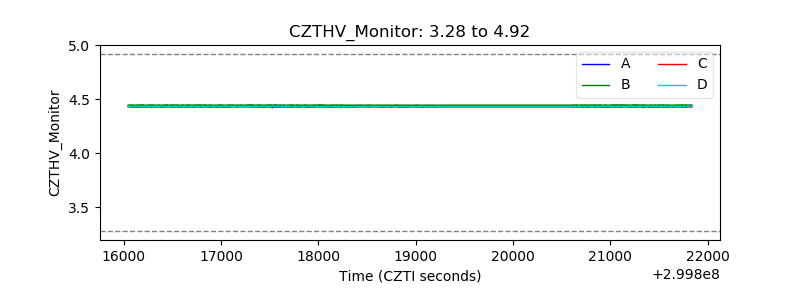 |
| D_VDD | 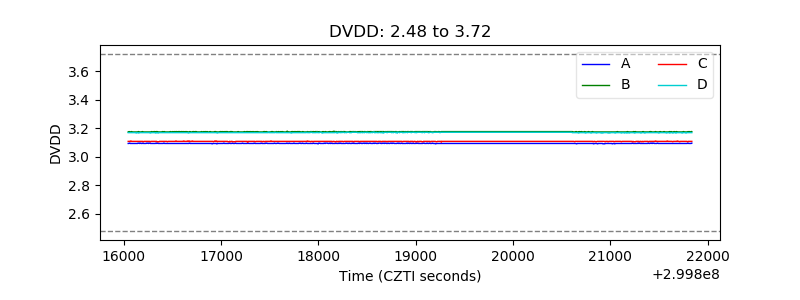 |
| Temperature 1 | 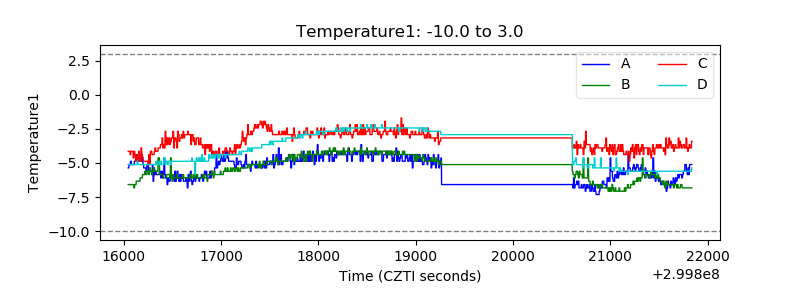 |
| Veto HV Monitor |  |
| Veto LLD | 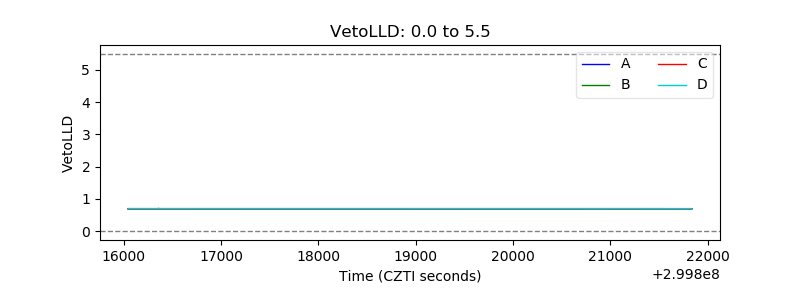 |
| Alpha Counter | 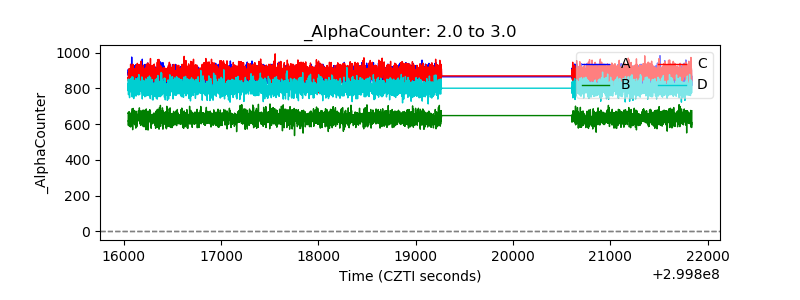 |
| _CPM_Rate | 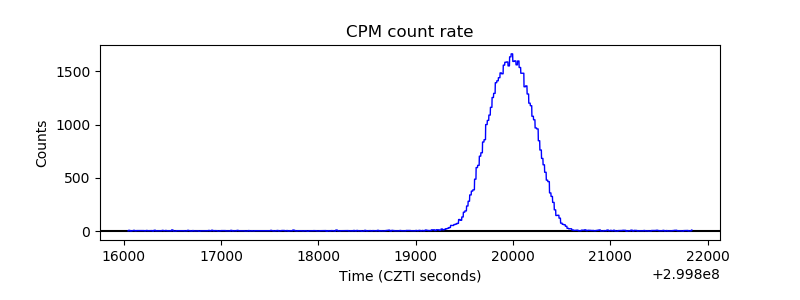 |
| CZT Counter |  |
| +2.5 Volts monitor | 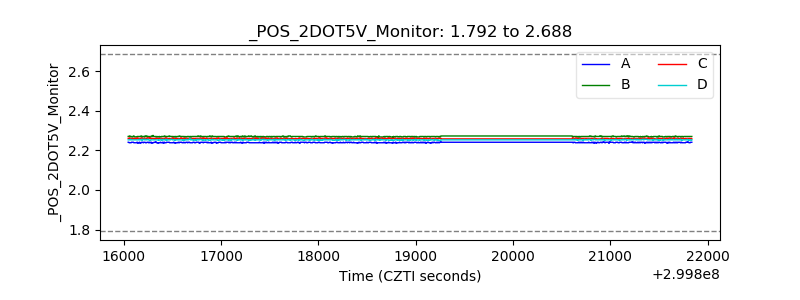 |
| +5 Volts monitor |  |
| _ROLL_ROT | 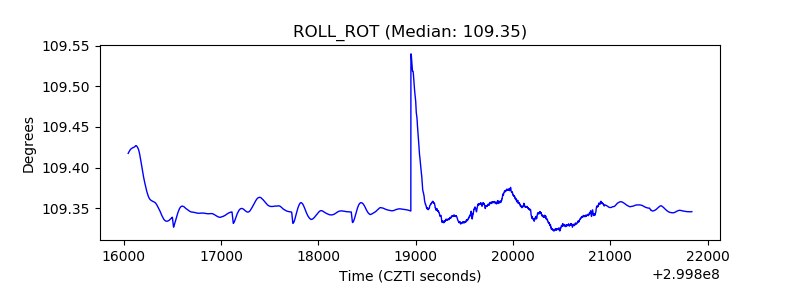 |
| _Roll_DEC | 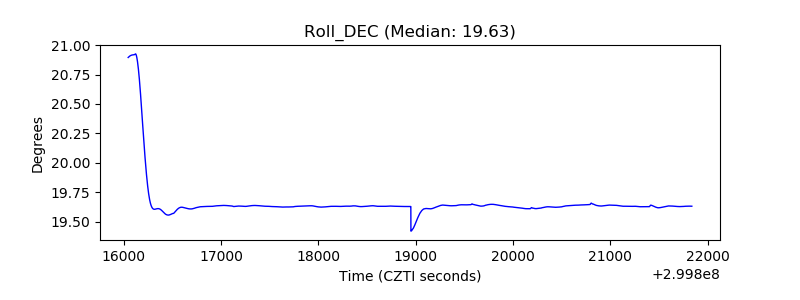 |
| _Roll_RA |  |
| Veto Counter | 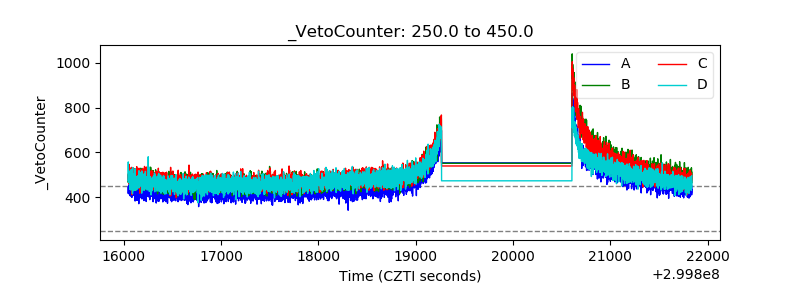 |