| Param | Original file | Final file |
|---|---|---|
| Filename | modeM0/AS1A05_163T01_9000003010_20360cztM0_level2.evt | modeM0/AS1A05_163T01_9000003010_20360cztM0_level2_quad_clean.evt |
| Size (bytes) | 466,318,080 | 97,231,680 |
| Size | 444.7 MB | 92.7 MB |
| Events in quadrant A | 3,034,519 | 631,781 |
| Events in quadrant B | 3,092,895 | 639,173 |
| Events in quadrant C | 3,092,625 | 619,053 |
| Events in quadrant D | 4,465,682 | 605,946 |
| Mode SS | |||
|---|---|---|---|
| Quadrant | BADHDUFLAG | Total packets | Discarded packets |
| A | 0 | 132 | 0 |
| B | 0 | 132 | 0 |
| C | 0 | 132 | 0 |
| D | 0 | 132 | 0 |
| Mode M0 | |||
|---|---|---|---|
| Quadrant | BADHDUFLAG | Total packets | Discarded packets |
| A | 0 | 13227 | 1 |
| B | 0 | 13311 | 1 |
| C | 0 | 13313 | 1 |
| D | 0 | 17836 | 1 |
| Mode M9 | |||
|---|---|---|---|
| Quadrant | BADHDUFLAG | Total packets | Discarded packets |
| A | 0 | 9 | 0 |
| B | 0 | 9 | 0 |
| C | 0 | 9 | 0 |
| D | 0 | 9 | 0 |
| Quadrant | Total seconds | Saturated seconds | Saturation percentage |
|---|---|---|---|
| A | 6424 | 38 | 0.591532% |
| B | 6425 | 49 | 0.762646% |
| C | 6425 | 75 | 1.167315% |
| D | 6425 | 187 | 2.910506% |
Noise dominated data is calculated using 1-second bins in cleaned event files. If a bin has >2000 counts, and if more than 50% of those come from <1% of pixels, then it is considered to be noise-dominated and hence unusable.
| Quadrant | # 1 sec bins | Bins with >0 counts | Bins with >2000 counts | High rate bins dominated by noise | Noise dominated (total time) | Noise dominated (detector-on time) | Marked lightcurve |
|---|---|---|---|---|---|---|---|
| A | 7355 | 6425 | 0 | 0 | 0.00% | 0.00% | 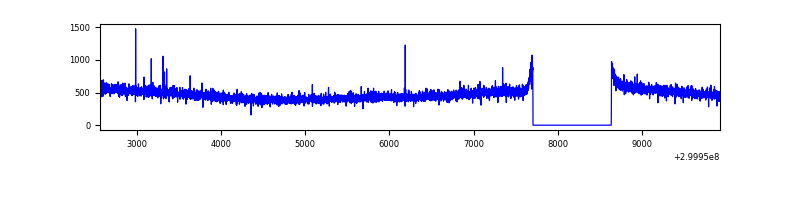 |
| B | 7356 | 6427 | 0 | 0 | 0.00% | 0.00% | 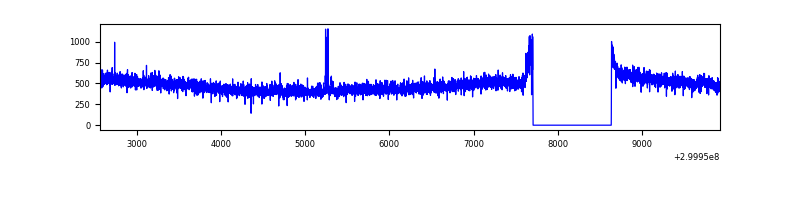 |
| C | 7356 | 6426 | 0 | 0 | 0.00% | 0.00% | 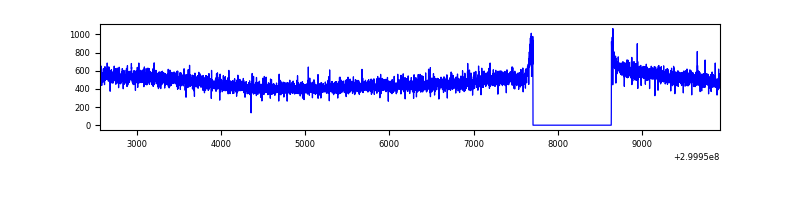 |
| D | 7356 | 6426 | 117 | 117 | 1.59% | 1.82% | 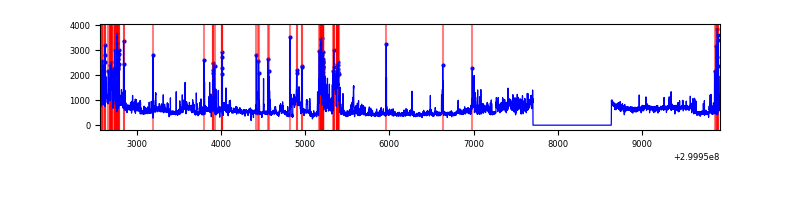 |
Top three noisy pixels from each quadrant. If the there are fewer than three noisy pixels in the level2.evt file, extra rows are filled as -1
| Pixel properties | Quadrant properties | ||||||
|---|---|---|---|---|---|---|---|
| Quadrant | DetID | PixID | Counts | Sigma | Mean | Median | Sigma |
| A | 13 | 254 | 7963 | 45.41 | 784 | 768 | 158.5 |
| A | 6 | 16 | 7779 | 44.24 | 784 | 768 | 158.5 |
| A | 0 | 226 | 6759 | 37.81 | 784 | 768 | 158.5 |
| B | 0 | 230 | 20970 | 133.76 | 780 | 759 | 151.1 |
| B | 0 | 198 | 18966 | 120.5 | 780 | 759 | 151.1 |
| B | 12 | 111 | 18801 | 119.41 | 780 | 759 | 151.1 |
| C | 14 | 238 | 117011 | 649.69 | 762 | 768 | 178.9 |
| C | 13 | 61 | 5156 | 24.52 | 762 | 768 | 178.9 |
| C | 3 | 233 | 2667 | 10.61 | 762 | 768 | 178.9 |
| D | 1 | 52 | 1274959 | 6304.86 | 762 | 749 | 202.1 |
| D | 7 | 238 | 255855 | 1262.28 | 762 | 749 | 202.1 |
| D | 2 | 234 | 27903 | 134.36 | 762 | 749 | 202.1 |
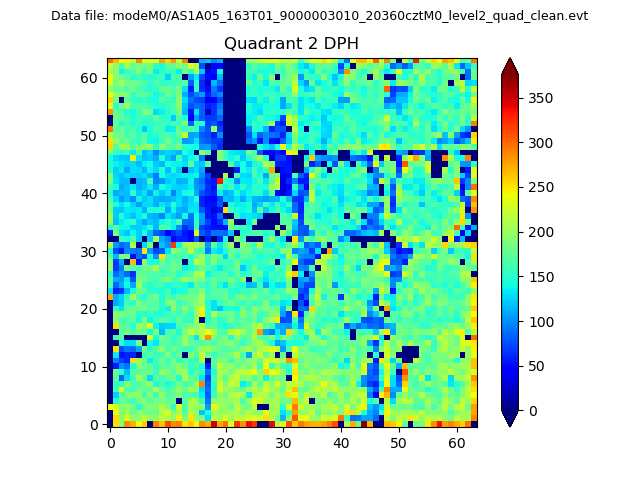
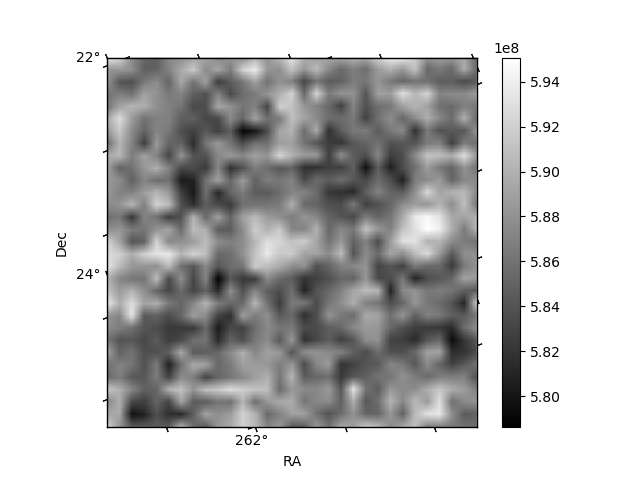
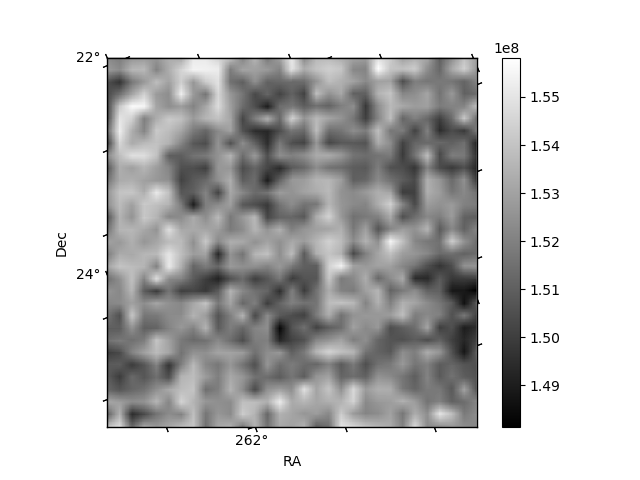
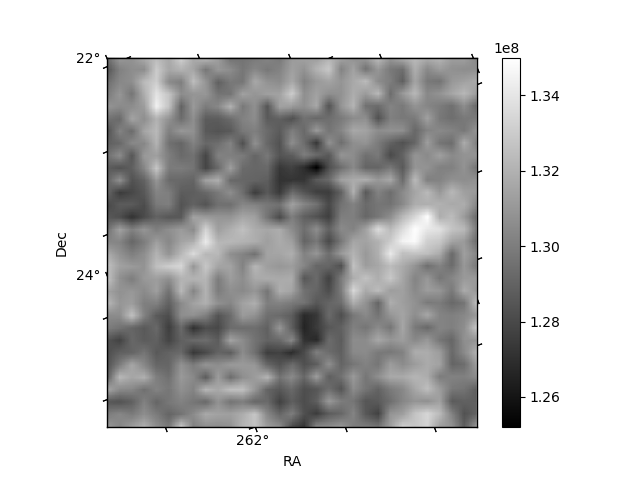
Histogram calculated using DETX and DETY for each event in the final _common_clean file
| Quadrant A | 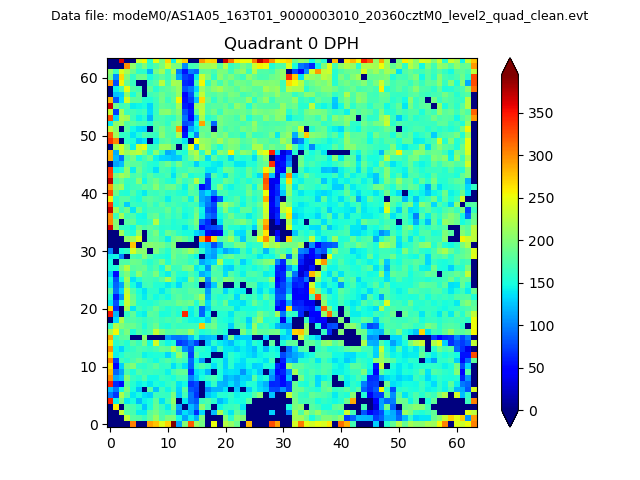 |
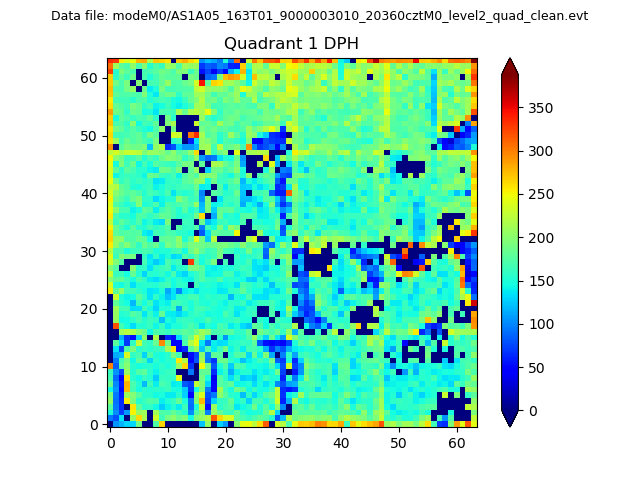 |
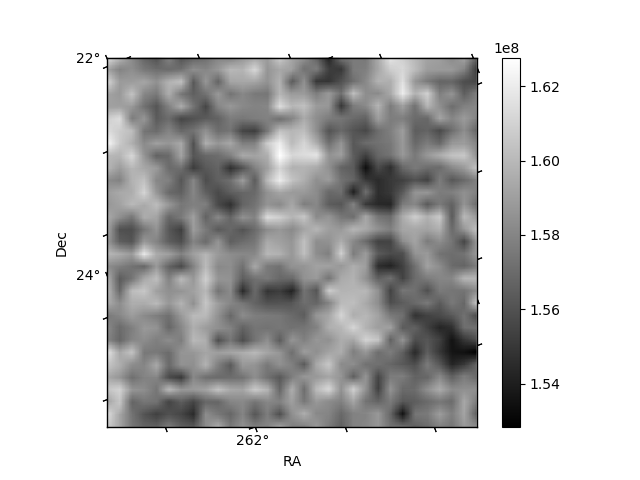
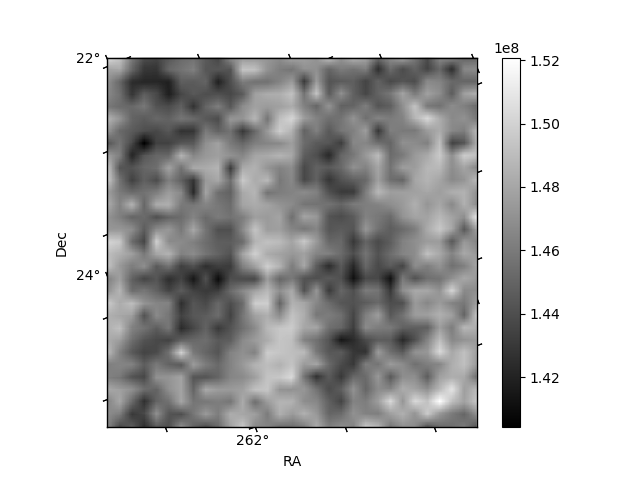
Quadrant B |
|---|---|---|---|
| Quadrant D | 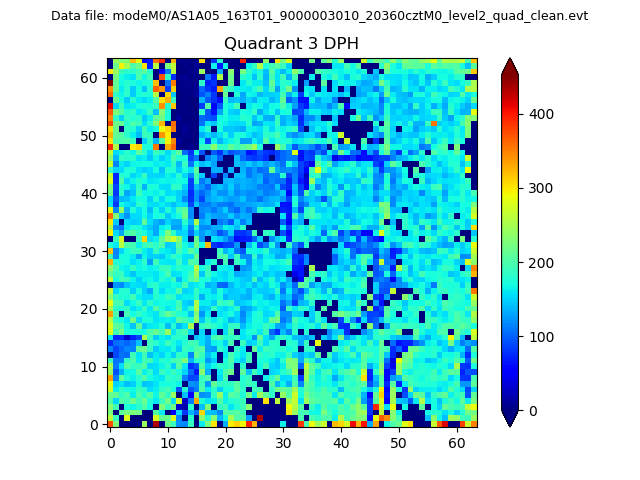 |
 |
Quadrant C |
| Plot type | Count rate plots | Images |
|---|---|---|
| Comparison with Poisson distribution Blue bars denote a histogram of data divided into 1 sec bins. Red curve is a Poisson curve with rate = median count rate of data. |
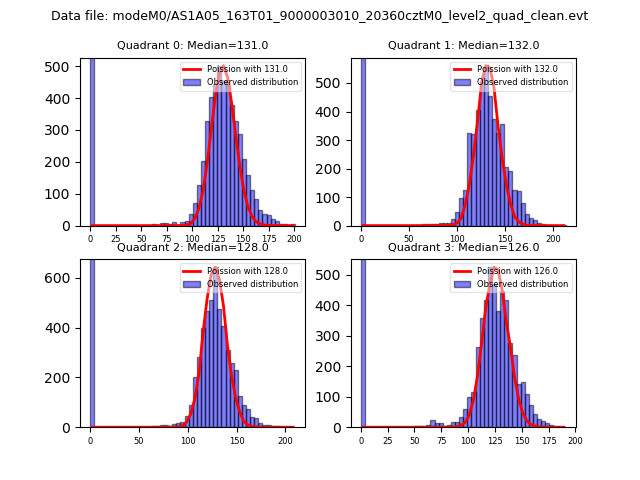 |
 |
| Quadrant-wise count rates Data is divided into 100 sec bins |
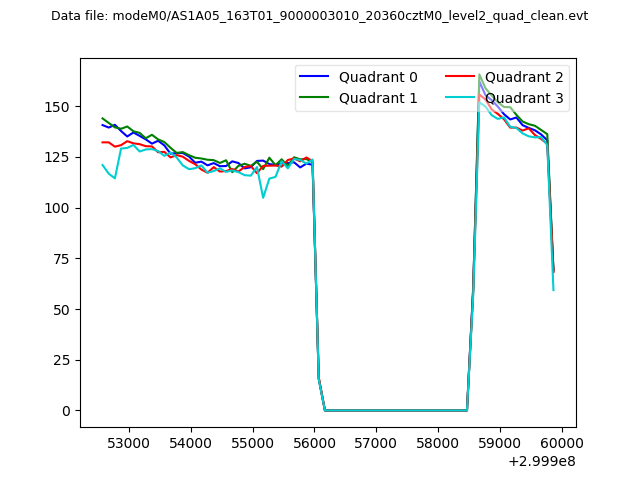 |
|
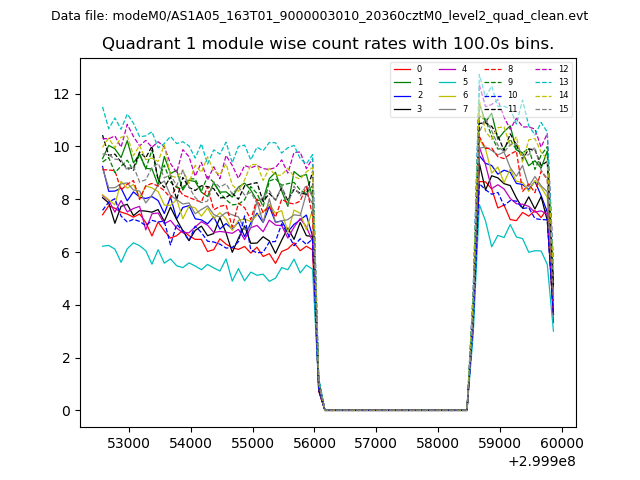
| Module-wise count rates for Quadrant A Data is divided into 100 sec bins |
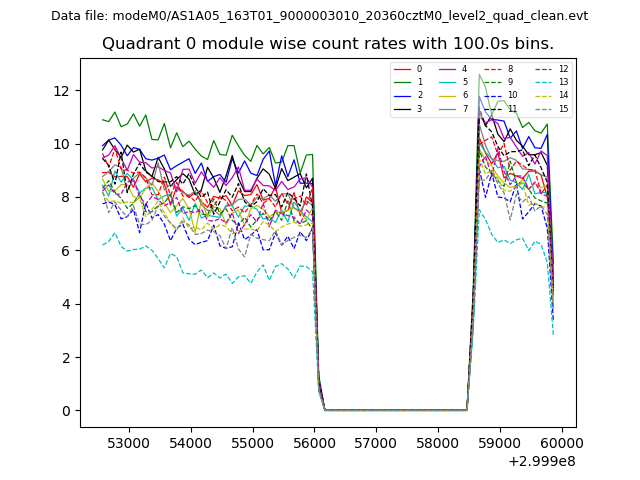 |
 |
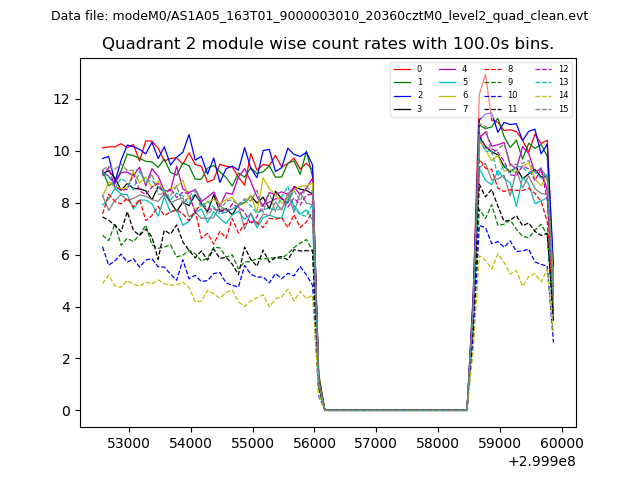
| Module-wise count rates for Quadrant B Data is divided into 100 sec bins |
 |
 |
| Module-wise count rates for Quadrant C Data is divided into 100 sec bins |
 |
 |
| Module-wise count rates for Quadrant D Data is divided into 100 sec bins |
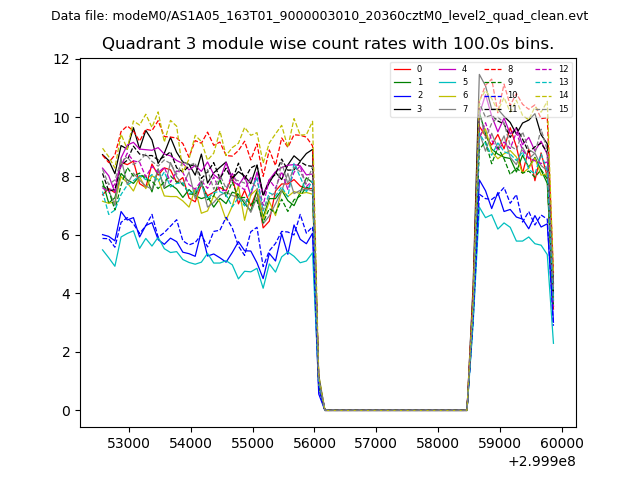 |
 |
| Parameter | Plot |
|---|---|
| CZT HV Monitor | 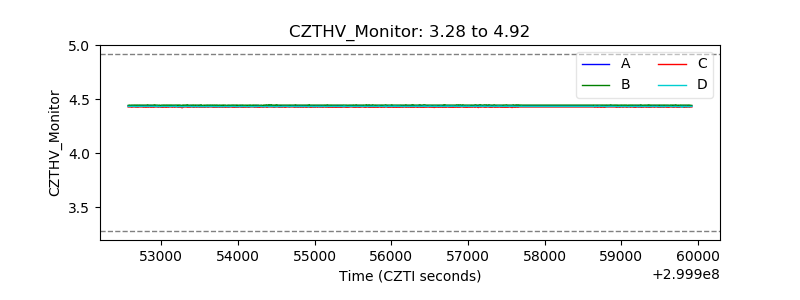 |
| D_VDD | 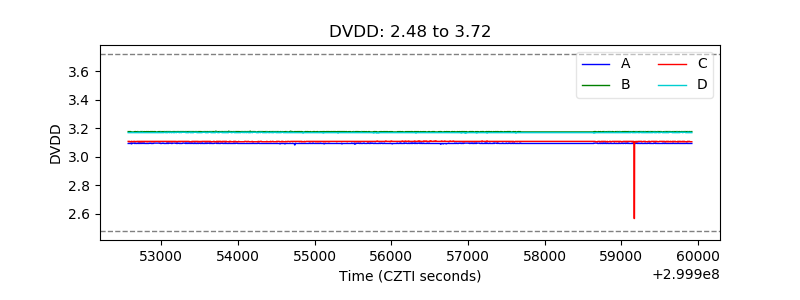 |
| Temperature 1 |  |
| Veto HV Monitor |  |
| Veto LLD | 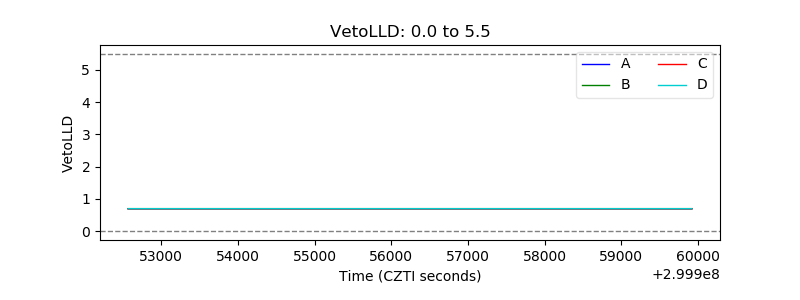 |
| Alpha Counter | 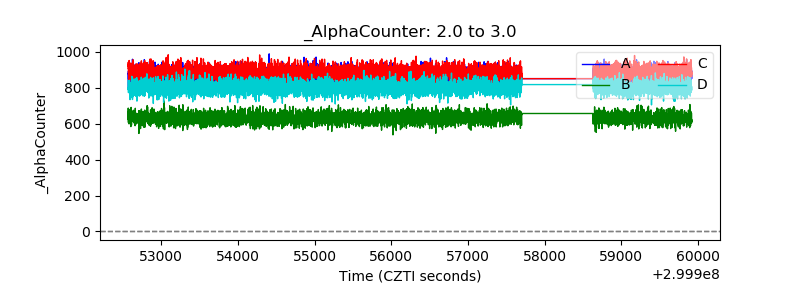 |
| _CPM_Rate | 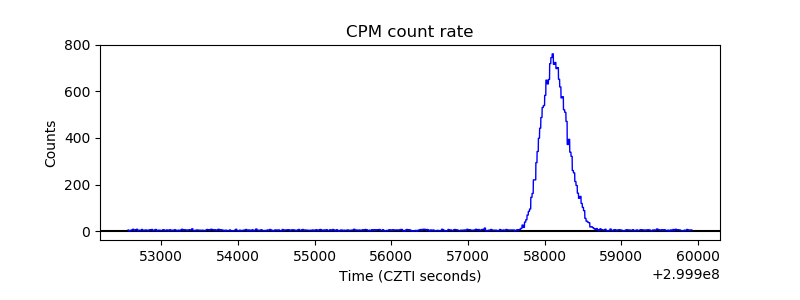 |
| CZT Counter | 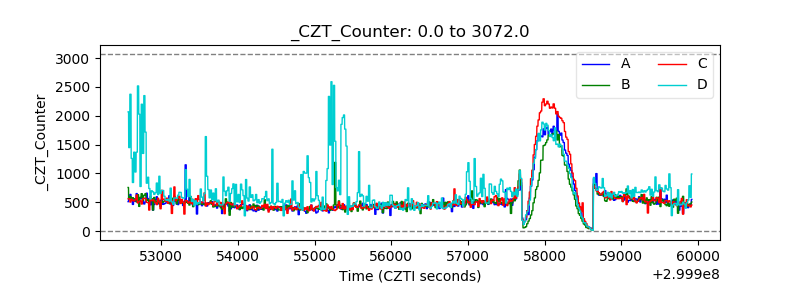 |
| +2.5 Volts monitor |  |
| +5 Volts monitor |  |
| _ROLL_ROT | 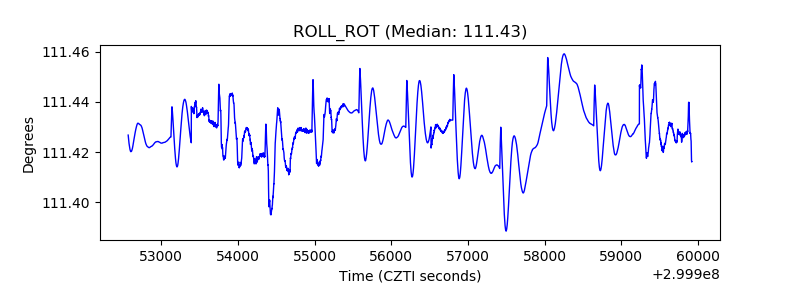 |
| _Roll_DEC | 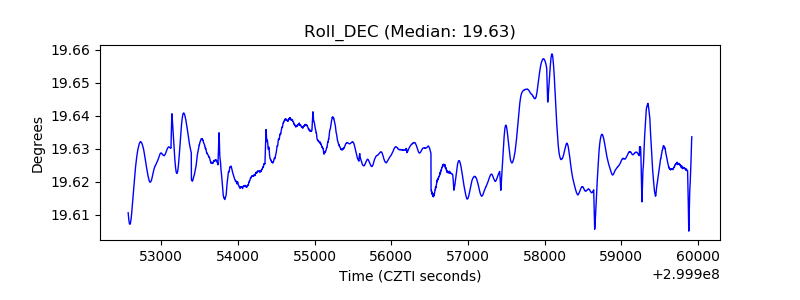 |
| _Roll_RA | 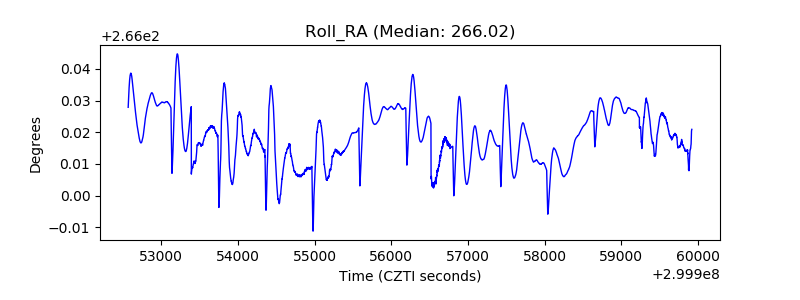 |
| Veto Counter |  |