| Param | Original file | Final file |
|---|---|---|
| Filename | modeM0/AS1A05_088T03_9000003042_20573cztM0_level2.evt | modeM0/AS1A05_088T03_9000003042_20573cztM0_level2_quad_clean.evt |
| Size (bytes) | 548,758,080 | 91,627,200 |
| Size | 523.3 MB | 87.4 MB |
| Events in quadrant A | 3,400,429 | 575,089 |
| Events in quadrant B | 3,517,563 | 574,811 |
| Events in quadrant C | 3,519,413 | 562,729 |
| Events in quadrant D | 5,680,274 | 547,766 |
| Mode SS | |||
|---|---|---|---|
| Quadrant | BADHDUFLAG | Total packets | Discarded packets |
| A | 0 | 148 | 0 |
| B | 0 | 148 | 0 |
| C | 0 | 148 | 0 |
| D | 0 | 148 | 0 |
| Mode M9 | |||
|---|---|---|---|
| Quadrant | BADHDUFLAG | Total packets | Discarded packets |
| A | 0 | 3 | 0 |
| B | 0 | 3 | 0 |
| C | 0 | 3 | 0 |
| D | 0 | 3 | 0 |
| Mode M0 | |||
|---|---|---|---|
| Quadrant | BADHDUFLAG | Total packets | Discarded packets |
| A | 0 | 15097 | 2 |
| B | 0 | 15221 | 1 |
| C | 0 | 15284 | 1 |
| D | 0 | 21908 | 1 |
| Quadrant | Total seconds | Saturated seconds | Saturation percentage |
|---|---|---|---|
| A | 7394 | 61 | 0.824993% |
| B | 7395 | 104 | 1.406356% |
| C | 7395 | 97 | 1.311697% |
| D | 7395 | 610 | 8.248817% |
Noise dominated data is calculated using 1-second bins in cleaned event files. If a bin has >2000 counts, and if more than 50% of those come from <1% of pixels, then it is considered to be noise-dominated and hence unusable.
| Quadrant | # 1 sec bins | Bins with >0 counts | Bins with >2000 counts | High rate bins dominated by noise | Noise dominated (total time) | Noise dominated (detector-on time) | Marked lightcurve |
|---|---|---|---|---|---|---|---|
| A | 7674 | 7396 | 0 | 0 | 0.00% | 0.00% | 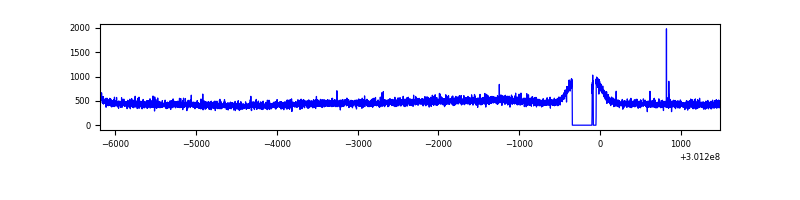 |
| B | 7675 | 7397 | 0 | 0 | 0.00% | 0.00% | 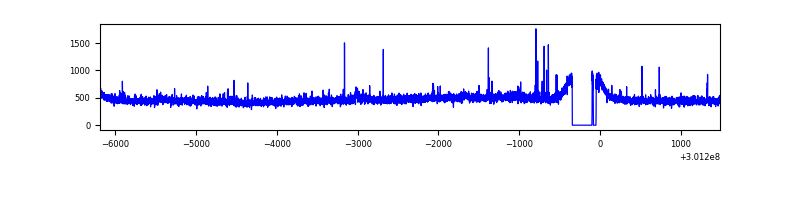 |
| C | 7675 | 7397 | 0 | 0 | 0.00% | 0.00% | 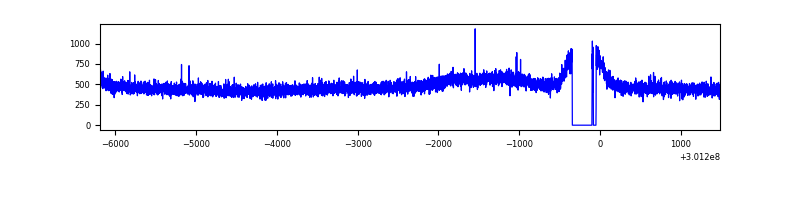 |
| D | 7675 | 7396 | 434 | 434 | 5.65% | 5.87% | 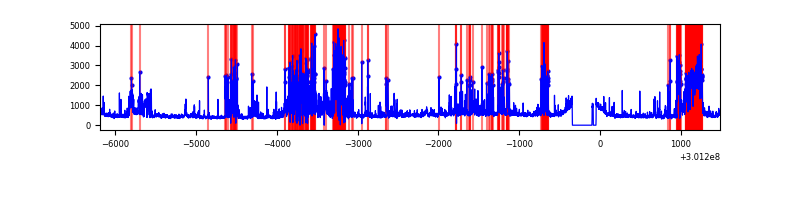 |
Top three noisy pixels from each quadrant. If the there are fewer than three noisy pixels in the level2.evt file, extra rows are filled as -1
| Pixel properties | Quadrant properties | ||||||
|---|---|---|---|---|---|---|---|
| Quadrant | DetID | PixID | Counts | Sigma | Mean | Median | Sigma |
| A | 3 | 137 | 7521 | 37.31 | 883 | 864 | 178.4 |
| A | 0 | 226 | 7511 | 37.25 | 883 | 864 | 178.4 |
| A | 12 | 194 | 6321 | 30.58 | 883 | 864 | 178.4 |
| B | 12 | 111 | 21396 | 120.66 | 880 | 859 | 170.2 |
| B | 11 | 111 | 18547 | 103.92 | 880 | 859 | 170.2 |
| B | 14 | 111 | 16614 | 92.56 | 880 | 859 | 170.2 |
| C | 14 | 238 | 131969 | 649.76 | 855 | 862 | 201.8 |
| C | 10 | 91 | 45314 | 220.3 | 855 | 862 | 201.8 |
| C | 13 | 61 | 5896 | 24.95 | 855 | 862 | 201.8 |
| D | 1 | 52 | 1655617 | 8231.26 | 832 | 808 | 201.0 |
| D | 5 | 222 | 754859 | 3750.76 | 832 | 808 | 201.0 |
| D | 1 | 20 | 39225 | 191.09 | 832 | 808 | 201.0 |
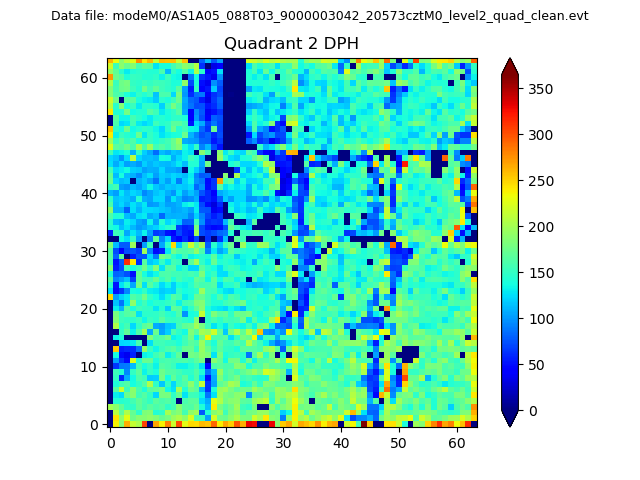
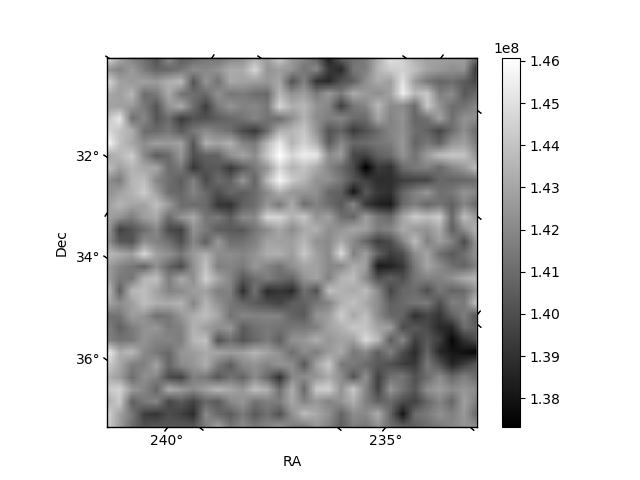
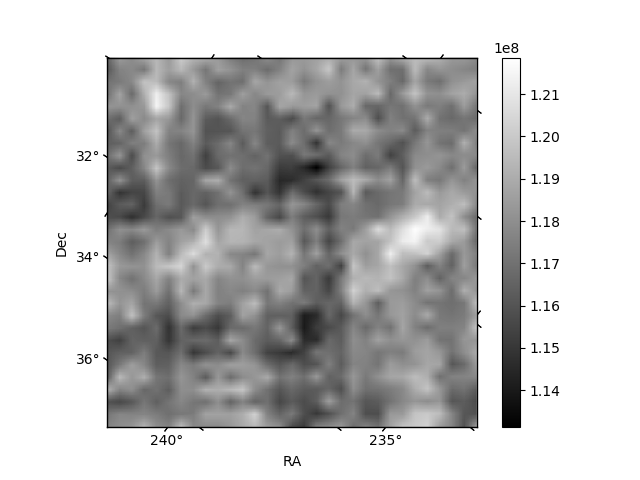
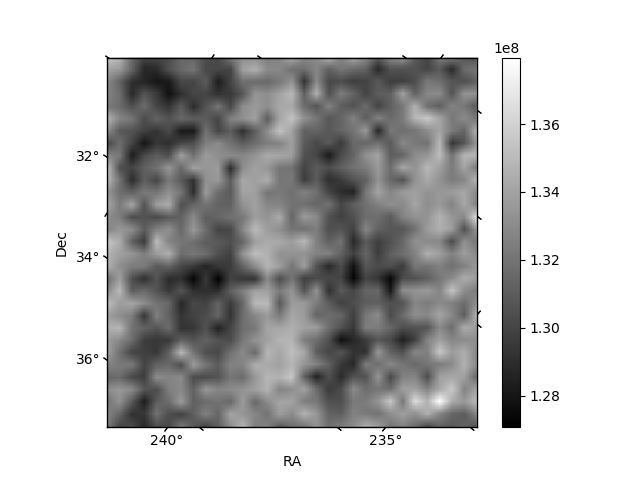
Histogram calculated using DETX and DETY for each event in the final _common_clean file
| Quadrant A | 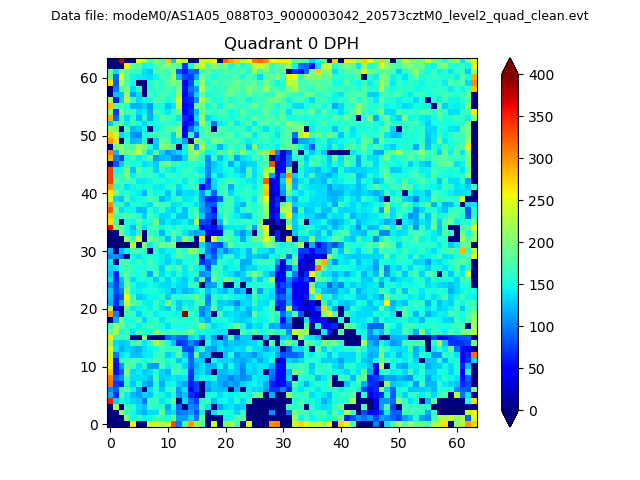 |
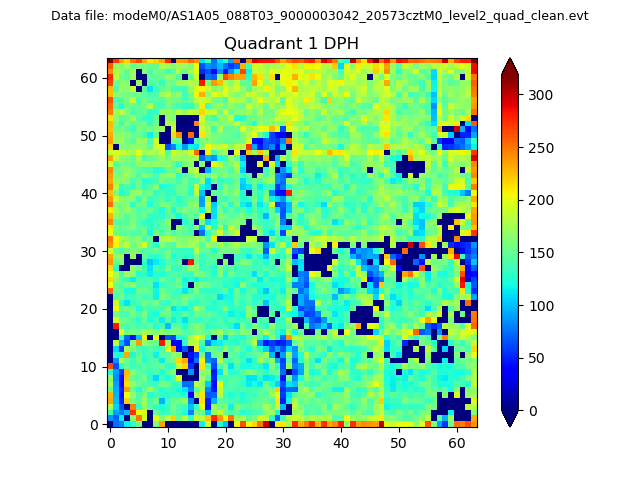 |
Quadrant B |
|---|---|---|---|
| Quadrant D | 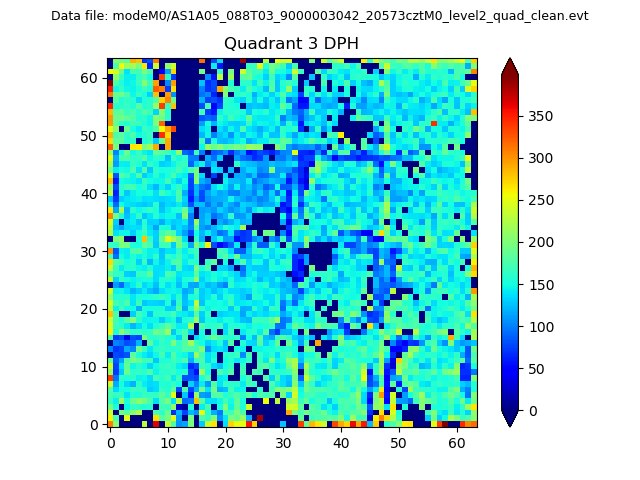 |
 |
Quadrant C |
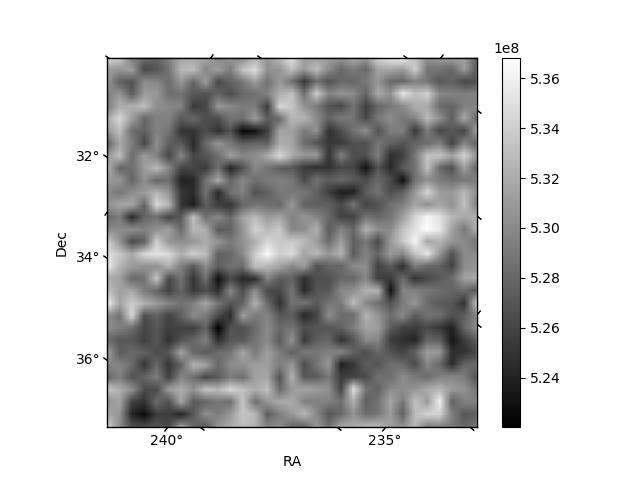
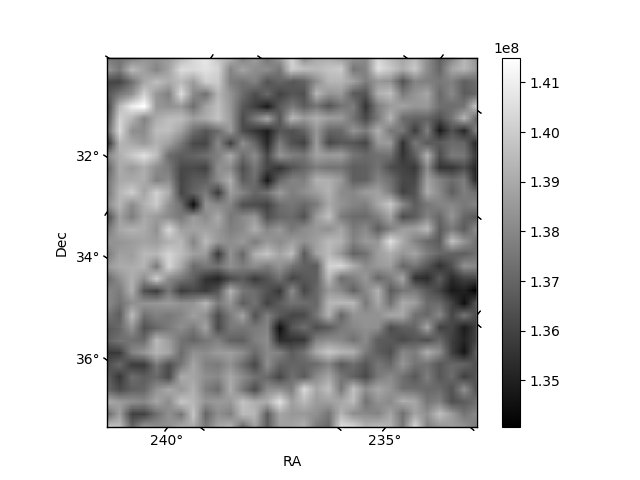
| Plot type | Count rate plots | Images |
|---|---|---|
| Comparison with Poisson distribution Blue bars denote a histogram of data divided into 1 sec bins. Red curve is a Poisson curve with rate = median count rate of data. |
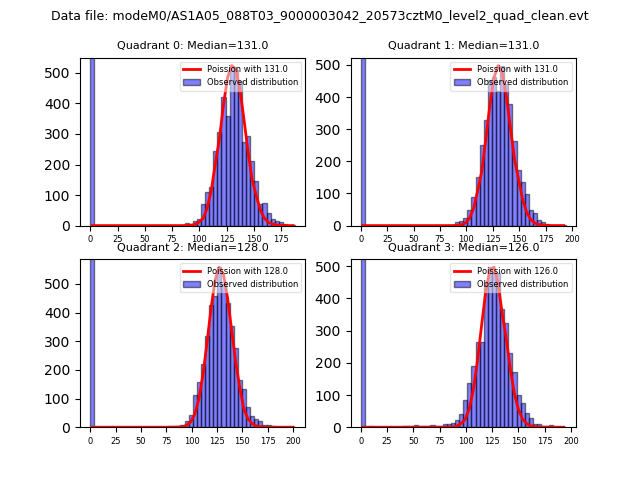 |
 |
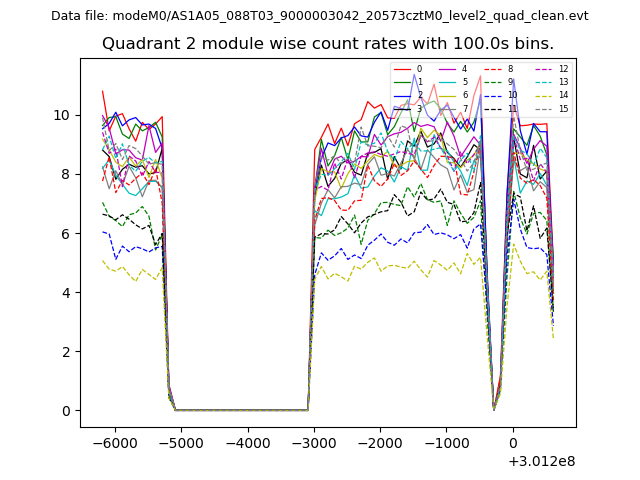
| Quadrant-wise count rates Data is divided into 100 sec bins |
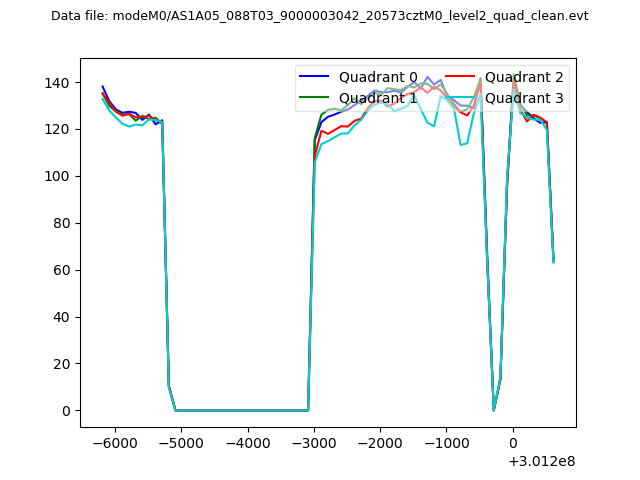 |
|
| Module-wise count rates for Quadrant A Data is divided into 100 sec bins |
 |
 |
| Module-wise count rates for Quadrant B Data is divided into 100 sec bins |
 |
 |
| Module-wise count rates for Quadrant C Data is divided into 100 sec bins |
 |
 |
| Module-wise count rates for Quadrant D Data is divided into 100 sec bins |
 |
 |
| Parameter | Plot |
|---|---|
| CZT HV Monitor | 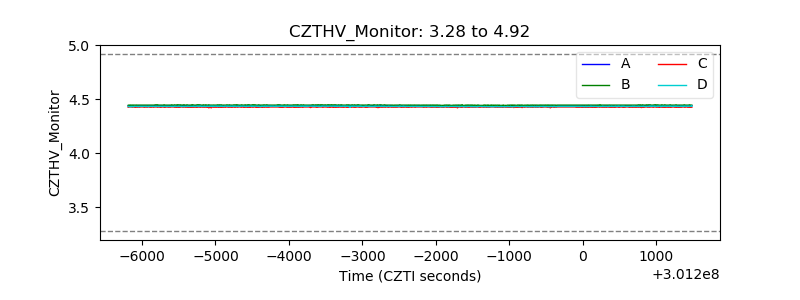 |
| D_VDD | 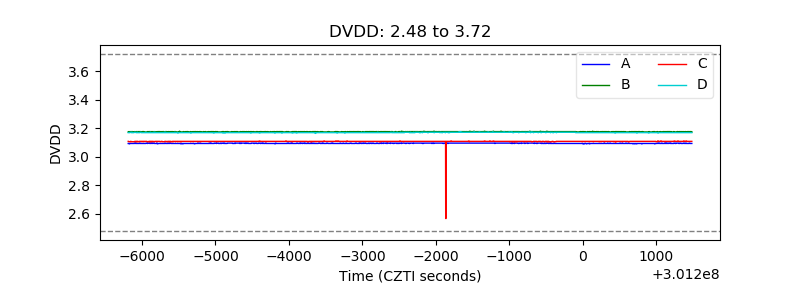 |
| Temperature 1 | 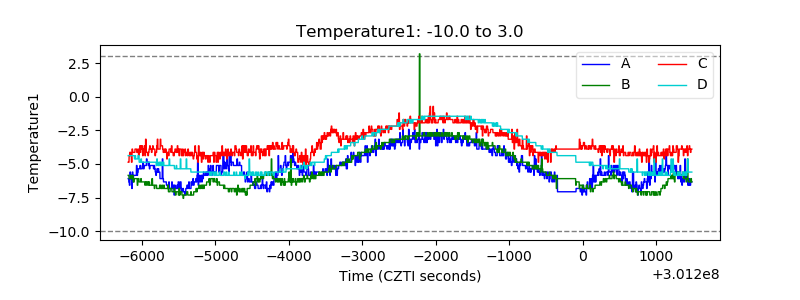 |
| Veto HV Monitor | 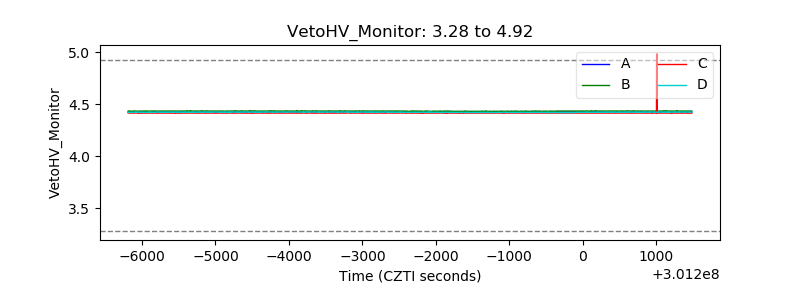 |
| Veto LLD |  |
| Alpha Counter | 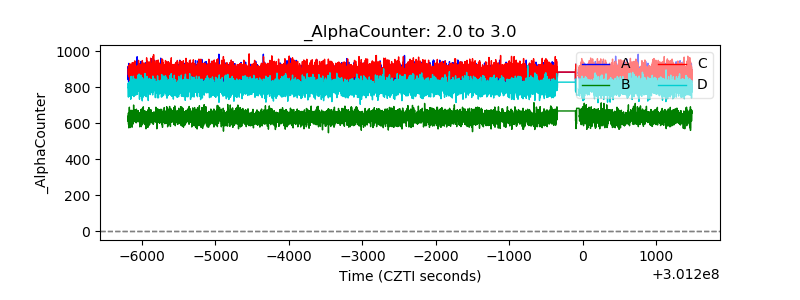 |
| _CPM_Rate | 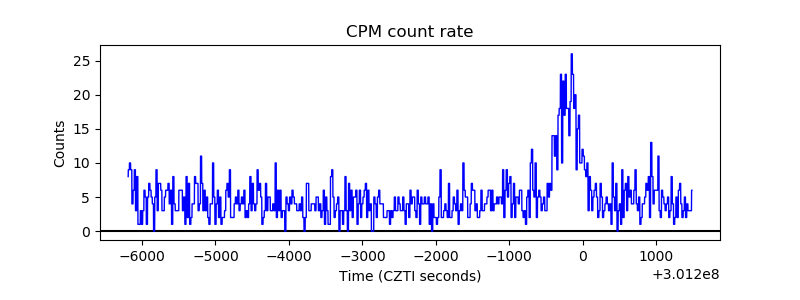 |
| CZT Counter | 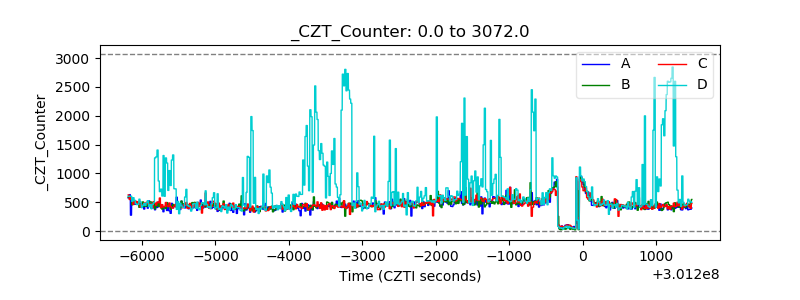 |
| +2.5 Volts monitor |  |
| +5 Volts monitor |  |
| _ROLL_ROT | 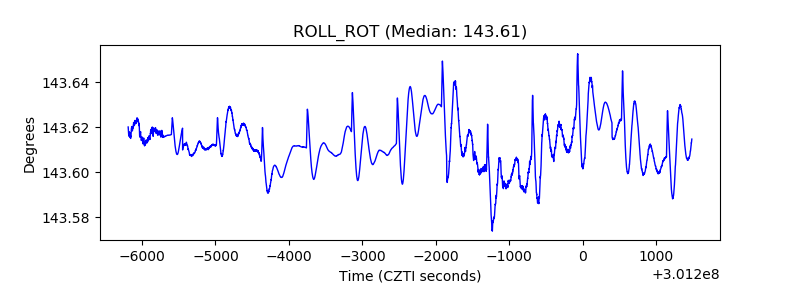 |
| _Roll_DEC | 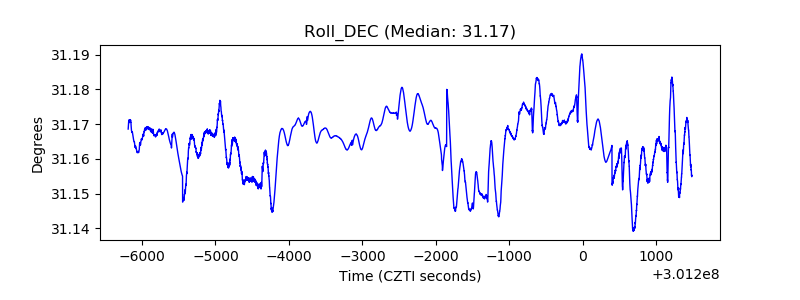 |
| _Roll_RA | 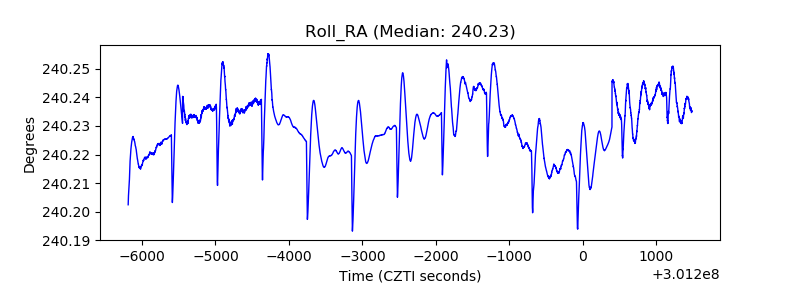 |
| Veto Counter |  |