| Param | Original file | Final file |
|---|---|---|
| Filename | modeM0/AS1A05_165T07_9000003062_20696cztM0_level2.evt | modeM0/AS1A05_165T07_9000003062_20696cztM0_level2_quad_clean.evt |
| Size (bytes) | 118,535,040 | 26,046,720 |
| Size | 113.0 MB | 24.8 MB |
| Events in quadrant A | 861,285 | 176,630 |
| Events in quadrant B | 857,124 | 178,114 |
| Events in quadrant C | 862,195 | 166,228 |
| Events in quadrant D | 911,886 | 163,515 |
| Mode SS | |||
|---|---|---|---|
| Quadrant | BADHDUFLAG | Total packets | Discarded packets |
| A | 0 | 30 | 0 |
| B | 0 | 30 | 0 |
| C | 0 | 30 | 0 |
| D | 0 | 30 | 0 |
| Mode M0 | |||
|---|---|---|---|
| Quadrant | BADHDUFLAG | Total packets | Discarded packets |
| A | 0 | 3549 | 1 |
| B | 0 | 3526 | 1 |
| C | 0 | 3575 | 2 |
| D | 0 | 3698 | 1 |
| Mode M9 | |||
|---|---|---|---|
| Quadrant | BADHDUFLAG | Total packets | Discarded packets |
| A | 0 | 12 | 0 |
| B | 0 | 12 | 0 |
| C | 0 | 12 | 0 |
| D | 0 | 12 | 0 |
| Quadrant | Total seconds | Saturated seconds | Saturation percentage |
|---|---|---|---|
| A | 1394 | 44 | 3.156385% |
| B | 1394 | 46 | 3.299857% |
| C | 1393 | 69 | 4.953338% |
| D | 1393 | 47 | 3.374013% |
Noise dominated data is calculated using 1-second bins in cleaned event files. If a bin has >2000 counts, and if more than 50% of those come from <1% of pixels, then it is considered to be noise-dominated and hence unusable.
| Quadrant | # 1 sec bins | Bins with >0 counts | Bins with >2000 counts | High rate bins dominated by noise | Noise dominated (total time) | Noise dominated (detector-on time) | Marked lightcurve |
|---|---|---|---|---|---|---|---|
| A | 2584 | 1395 | 0 | 0 | 0.00% | 0.00% | 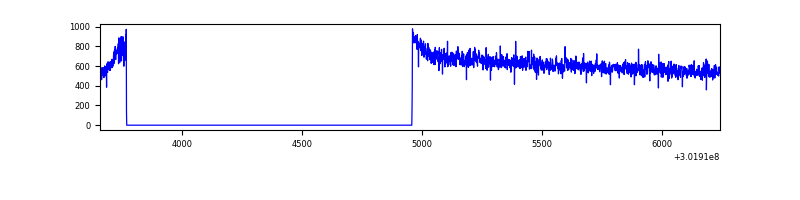 |
| B | 2584 | 1395 | 0 | 0 | 0.00% | 0.00% | 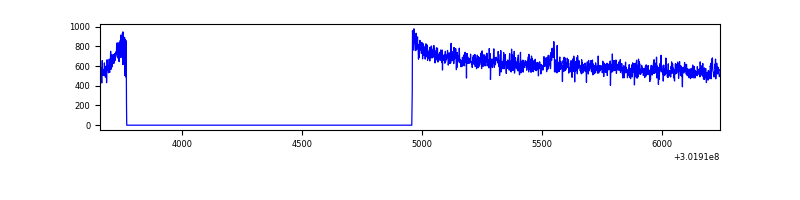 |
| C | 2583 | 1394 | 0 | 0 | 0.00% | 0.00% | 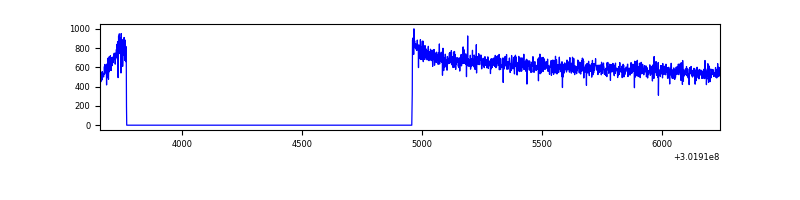 |
| D | 2583 | 1394 | 5 | 5 | 0.19% | 0.36% | 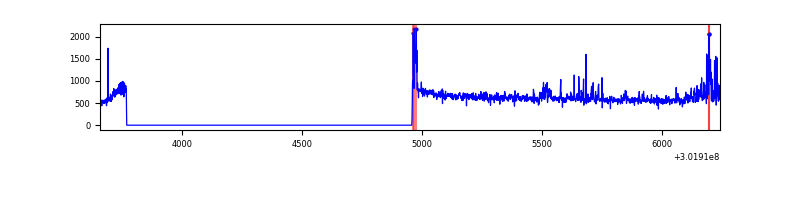 |
Top three noisy pixels from each quadrant. If the there are fewer than three noisy pixels in the level2.evt file, extra rows are filled as -1
| Pixel properties | Quadrant properties | ||||||
|---|---|---|---|---|---|---|---|
| Quadrant | DetID | PixID | Counts | Sigma | Mean | Median | Sigma |
| A | 0 | 226 | 2016 | 38.78 | 224 | 219 | 46.3 |
| A | 12 | 194 | 1657 | 31.03 | 224 | 219 | 46.3 |
| A | 3 | 137 | 1635 | 30.56 | 224 | 219 | 46.3 |
| B | 12 | 111 | 4648 | 104.5 | 217 | 212 | 42.5 |
| B | 11 | 111 | 4429 | 99.34 | 217 | 212 | 42.5 |
| B | 0 | 189 | 4012 | 89.51 | 217 | 212 | 42.5 |
| C | 14 | 238 | 33548 | 663.78 | 211 | 212 | 50.2 |
| C | 7 | 247 | 3902 | 73.48 | 211 | 212 | 50.2 |
| C | 13 | 61 | 1496 | 25.57 | 211 | 212 | 50.2 |
| D | 5 | 222 | 44586 | 835.0 | 218 | 212 | 53.1 |
| D | 7 | 238 | 27284 | 509.43 | 218 | 212 | 53.1 |
| D | 1 | 52 | 7092 | 129.46 | 218 | 212 | 53.1 |
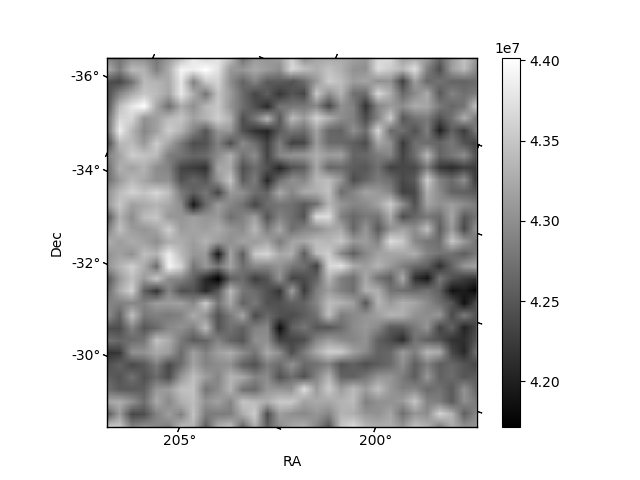
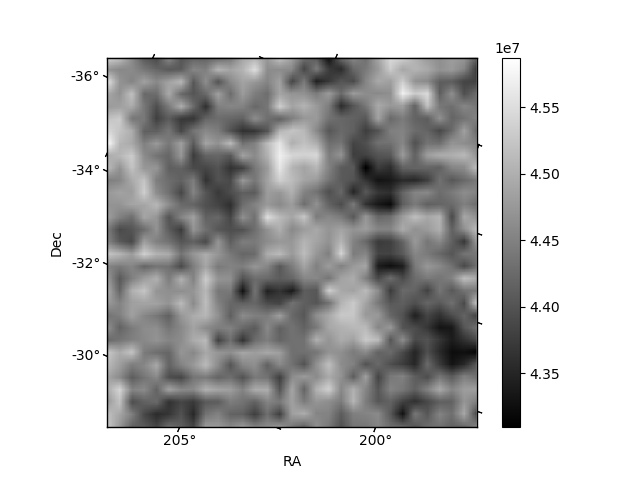
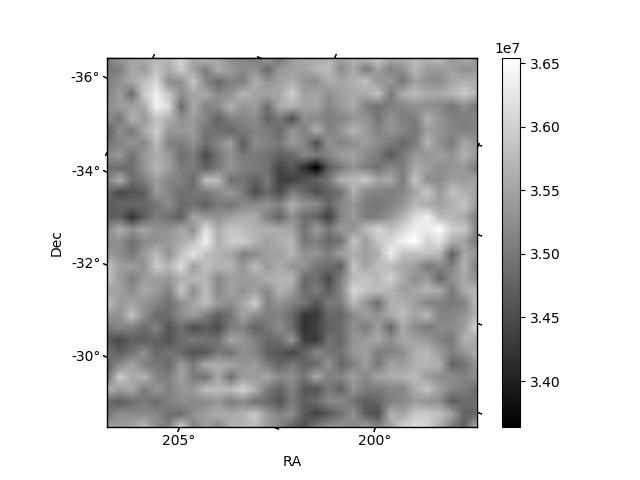
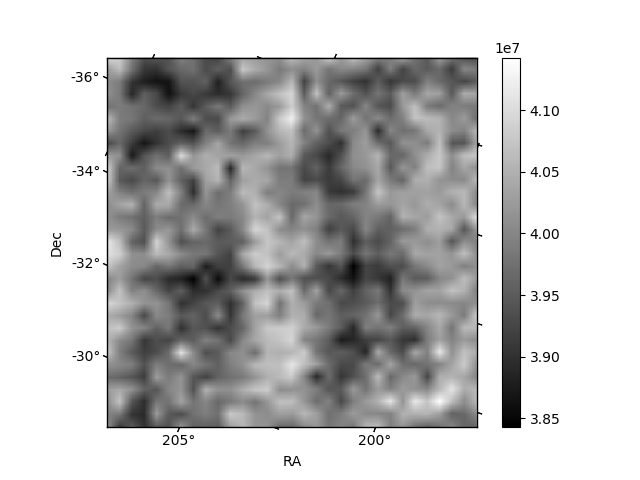
Histogram calculated using DETX and DETY for each event in the final _common_clean file
| Quadrant A | 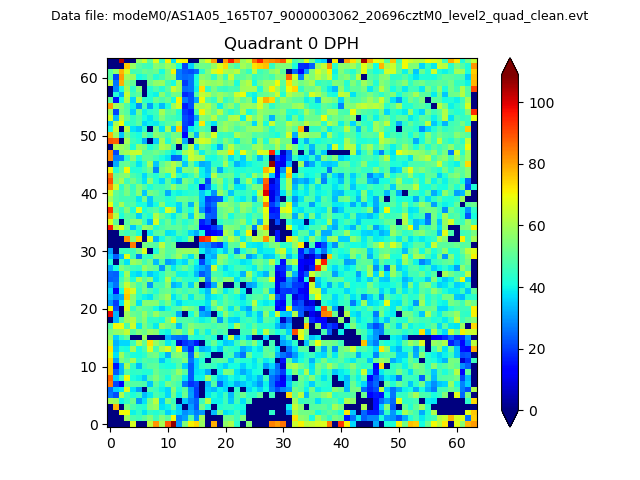 |
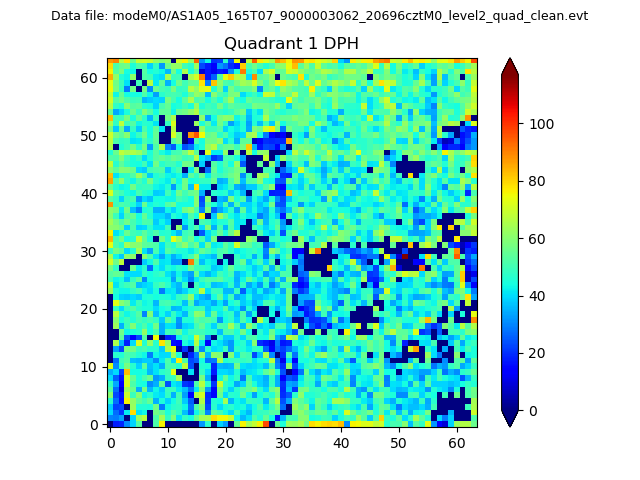 |
Quadrant B |
|---|---|---|---|
| Quadrant D |  |
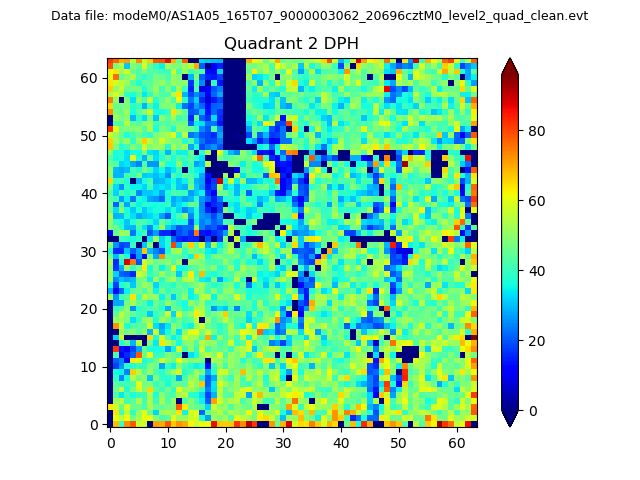 |
Quadrant C |
| Plot type | Count rate plots | Images |
|---|---|---|
| Comparison with Poisson distribution Blue bars denote a histogram of data divided into 1 sec bins. Red curve is a Poisson curve with rate = median count rate of data. |
 |
 |
| Quadrant-wise count rates Data is divided into 100 sec bins |
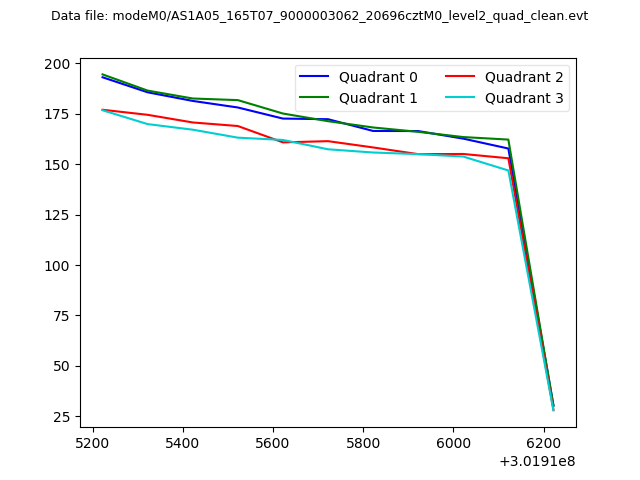 |
|
| Module-wise count rates for Quadrant A Data is divided into 100 sec bins |
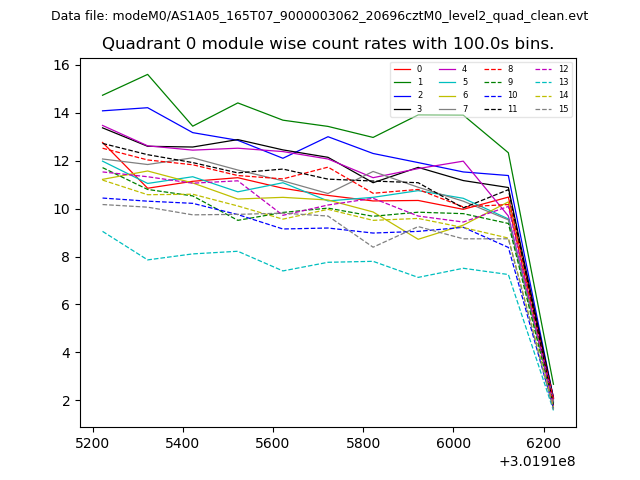 |
 |
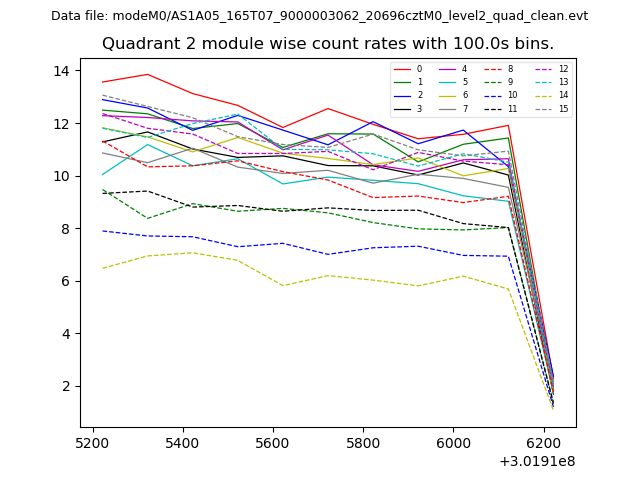
| Module-wise count rates for Quadrant B Data is divided into 100 sec bins |
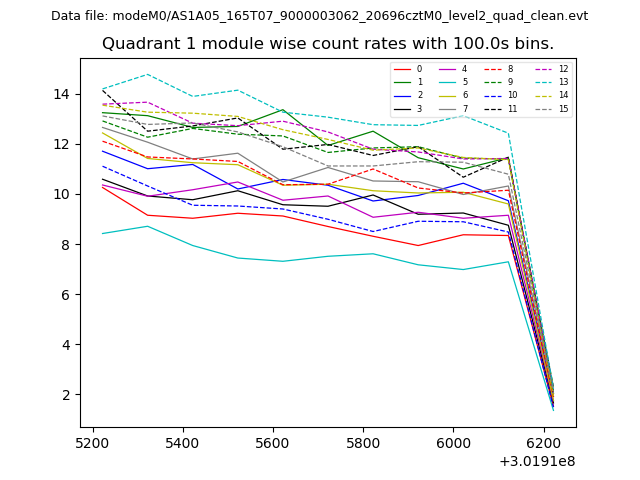 |
 |
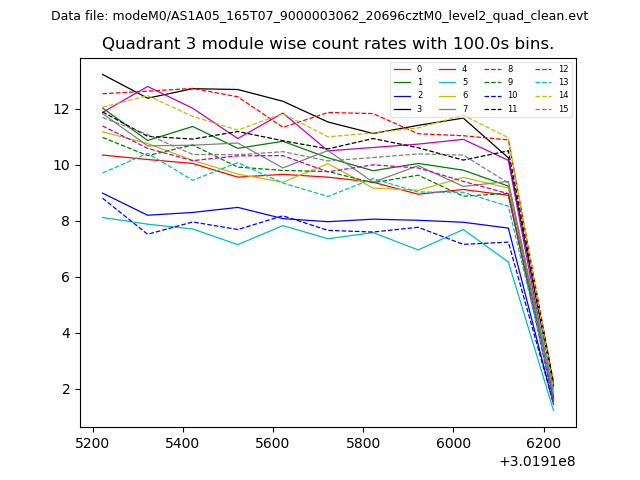
| Module-wise count rates for Quadrant C Data is divided into 100 sec bins |
 |
 |
| Module-wise count rates for Quadrant D Data is divided into 100 sec bins |
 |
 |
| Parameter | Plot |
|---|---|
| CZT HV Monitor | 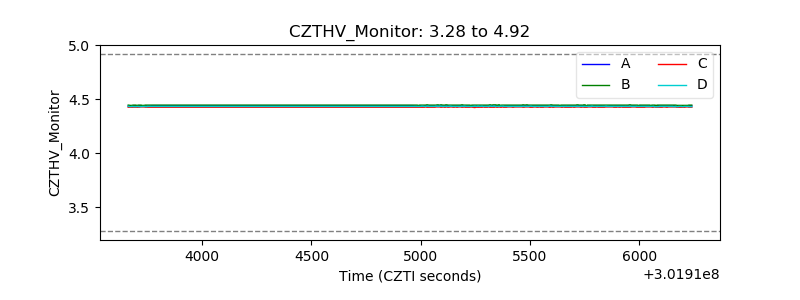 |
| D_VDD | 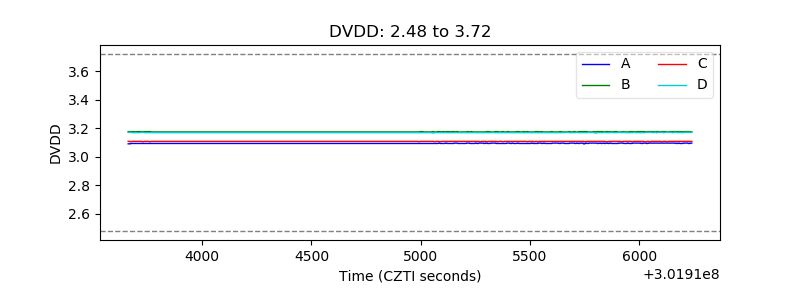 |
| Temperature 1 | 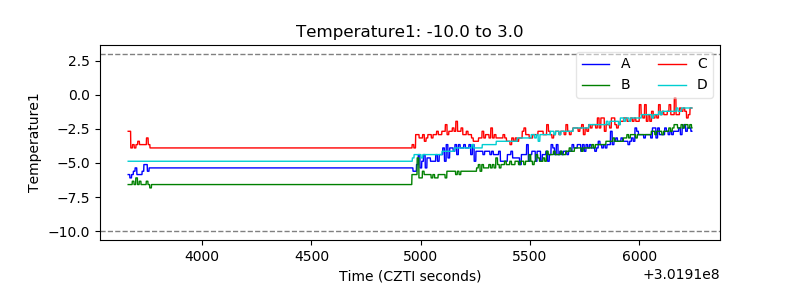 |
| Veto HV Monitor |  |
| Veto LLD | 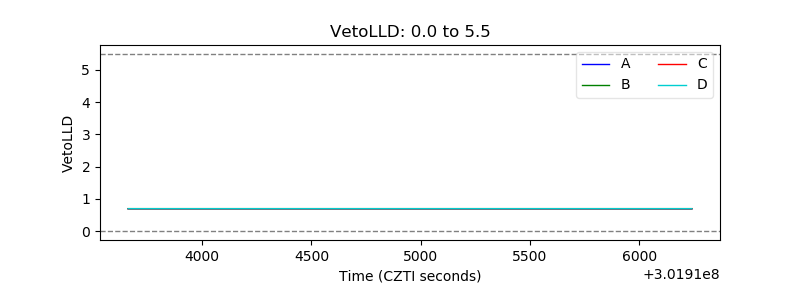 |
| Alpha Counter | 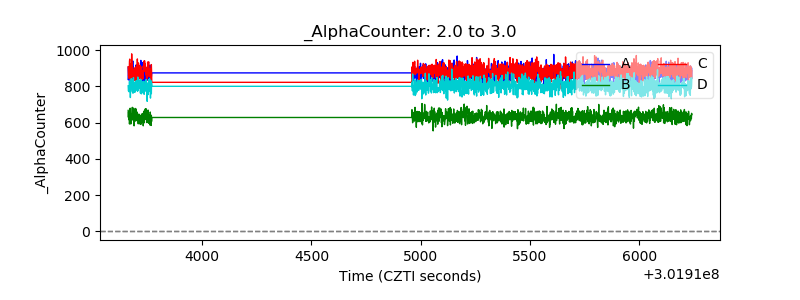 |
| _CPM_Rate | 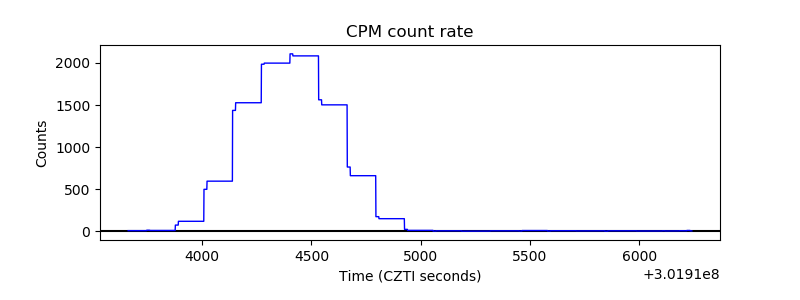 |
| CZT Counter |  |
| +2.5 Volts monitor | 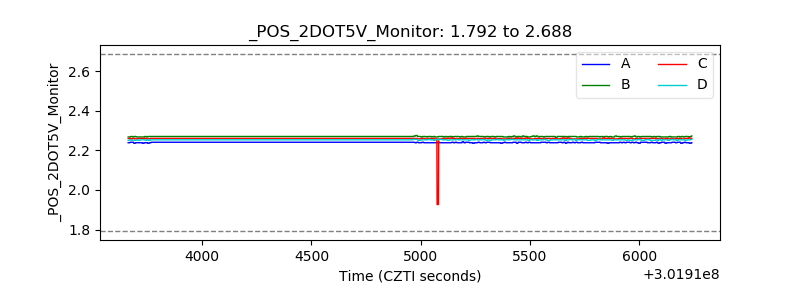 |
| +5 Volts monitor |  |
| _ROLL_ROT | 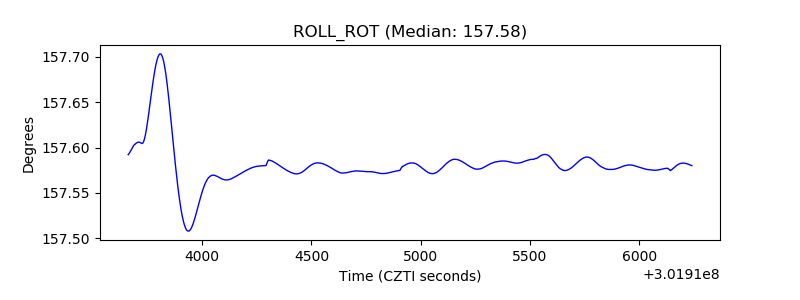 |
| _Roll_DEC | 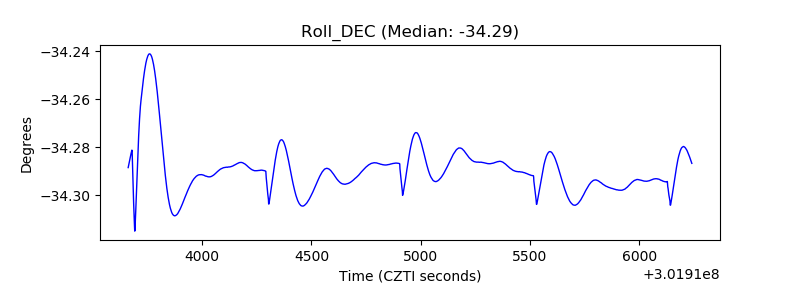 |
| _Roll_RA |  |
| Veto Counter | 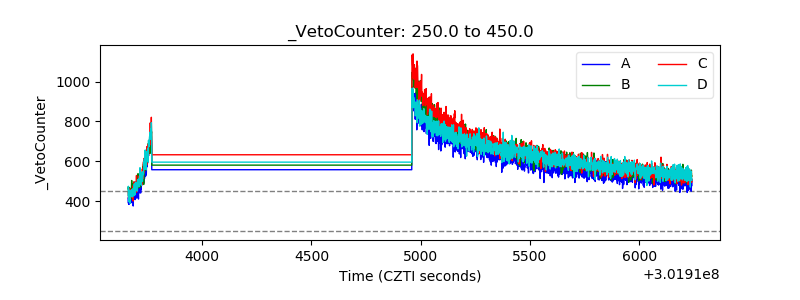 |