| Param | Original file | Final file |
|---|---|---|
| Filename | modeM0/AS1A05_075T06_9000003104_21029cztM0_level2.evt | modeM0/AS1A05_075T06_9000003104_21029cztM0_level2_quad_clean.evt |
| Size (bytes) | 67,777,920 | 18,904,320 |
| Size | 64.6 MB | 18.0 MB |
| Events in quadrant A | 441,548 | 127,533 |
| Events in quadrant B | 531,011 | 132,548 |
| Events in quadrant C | 461,260 | 125,572 |
| Events in quadrant D | 558,461 | 120,285 |
| Mode SS | |||
|---|---|---|---|
| Quadrant | BADHDUFLAG | Total packets | Discarded packets |
| A | 0 | 18 | 0 |
| B | 0 | 18 | 0 |
| C | 0 | 18 | 0 |
| D | 0 | 18 | 0 |
| Mode M9 | |||
|---|---|---|---|
| Quadrant | BADHDUFLAG | Total packets | Discarded packets |
| A | 0 | 2 | 0 |
| B | 0 | 3 | 0 |
| C | 0 | 3 | 0 |
| D | 0 | 3 | 0 |
| Mode M0 | |||
|---|---|---|---|
| Quadrant | BADHDUFLAG | Total packets | Discarded packets |
| A | 0 | 1784 | 1 |
| B | 0 | 2217 | 1 |
| C | 0 | 1840 | 1 |
| D | 0 | 2227 | 1 |
| Quadrant | Total seconds | Saturated seconds | Saturation percentage |
|---|---|---|---|
| A | 835 | 2 | 0.239521% |
| B | 835 | 2 | 0.239521% |
| C | 835 | 9 | 1.077844% |
| D | 835 | 23 | 2.754491% |
Noise dominated data is calculated using 1-second bins in cleaned event files. If a bin has >2000 counts, and if more than 50% of those come from <1% of pixels, then it is considered to be noise-dominated and hence unusable.
| Quadrant | # 1 sec bins | Bins with >0 counts | Bins with >2000 counts | High rate bins dominated by noise | Noise dominated (total time) | Noise dominated (detector-on time) | Marked lightcurve |
|---|---|---|---|---|---|---|---|
| A | 834 | 834 | 0 | 0 | 0.00% | 0.00% | 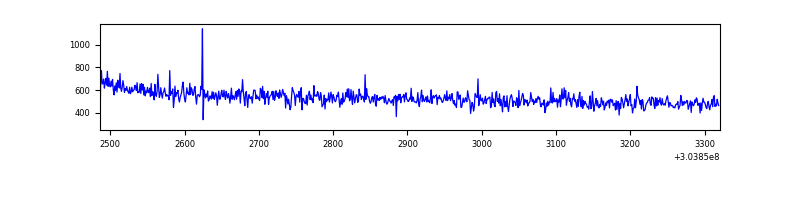 |
| B | 834 | 834 | 0 | 0 | 0.00% | 0.00% | 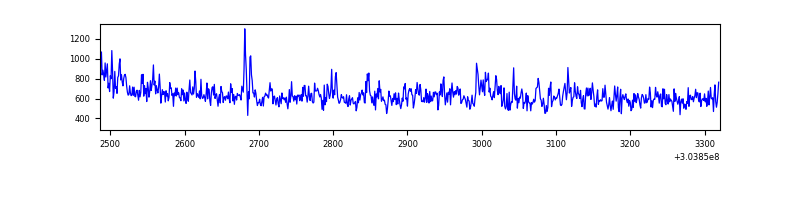 |
| C | 834 | 834 | 0 | 0 | 0.00% | 0.00% | 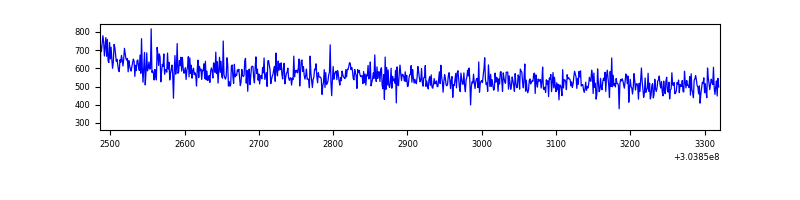 |
| D | 834 | 834 | 20 | 20 | 2.40% | 2.40% | 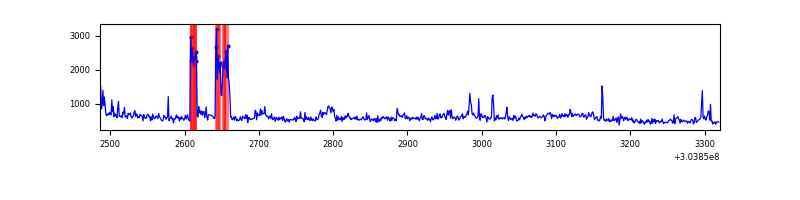 |
Top three noisy pixels from each quadrant. If the there are fewer than three noisy pixels in the level2.evt file, extra rows are filled as -1
| Pixel properties | Quadrant properties | ||||||
|---|---|---|---|---|---|---|---|
| Quadrant | DetID | PixID | Counts | Sigma | Mean | Median | Sigma |
| A | 13 | 254 | 1181 | 42.89 | 114 | 111 | 24.9 |
| A | 0 | 226 | 1029 | 36.8 | 114 | 111 | 24.9 |
| A | 12 | 194 | 827 | 28.7 | 114 | 111 | 24.9 |
| B | 0 | 189 | 55559 | 2318.19 | 116 | 113 | 23.9 |
| B | 0 | 190 | 9091 | 375.37 | 116 | 113 | 23.9 |
| B | 4 | 216 | 5873 | 240.83 | 116 | 113 | 23.9 |
| C | 14 | 238 | 17891 | 635.13 | 113 | 114 | 28.0 |
| C | 13 | 61 | 833 | 25.69 | 113 | 114 | 28.0 |
| C | 0 | 207 | 586 | 16.86 | 113 | 114 | 28.0 |
| D | 6 | 143 | 59194 | 2035.32 | 113 | 109 | 29.0 |
| D | 15 | 0 | 34959 | 1200.49 | 113 | 109 | 29.0 |
| D | 1 | 239 | 13758 | 470.17 | 113 | 109 | 29.0 |
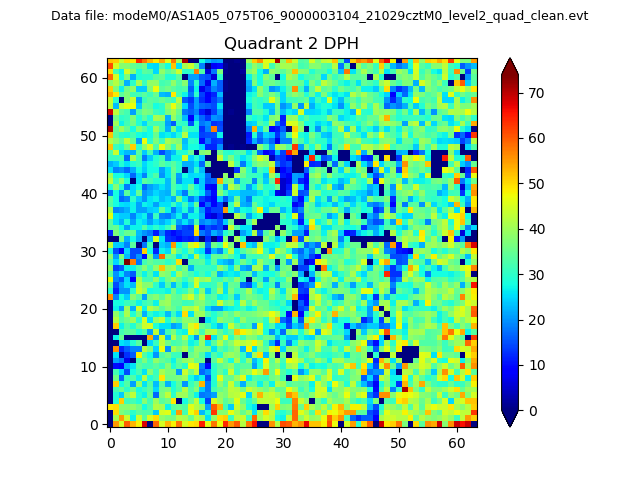
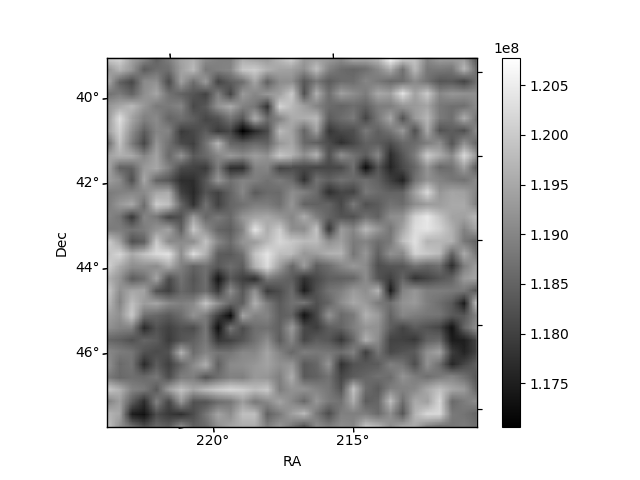
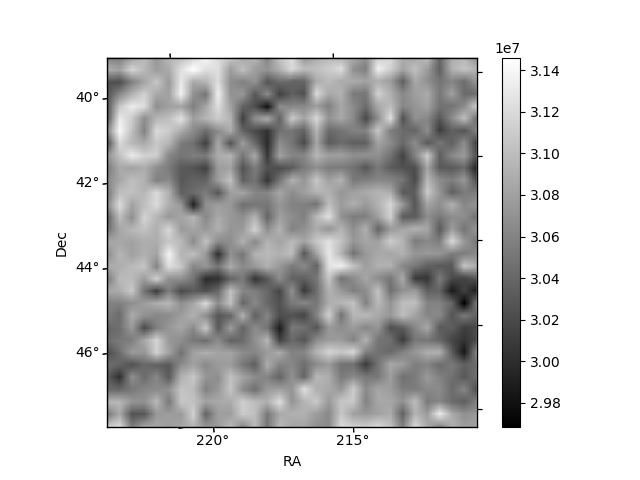
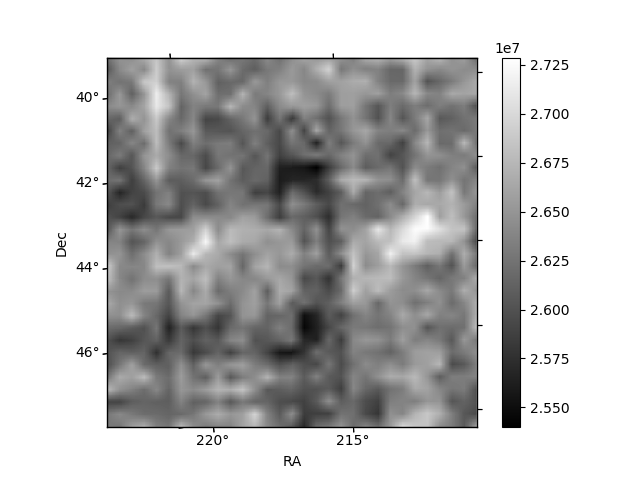
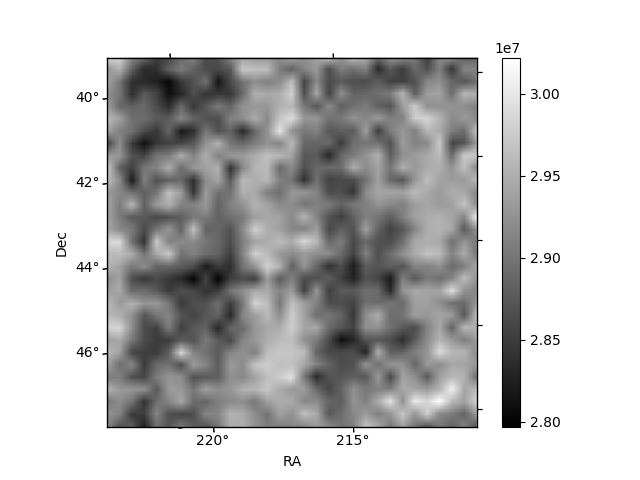
Histogram calculated using DETX and DETY for each event in the final _common_clean file
| Quadrant A | 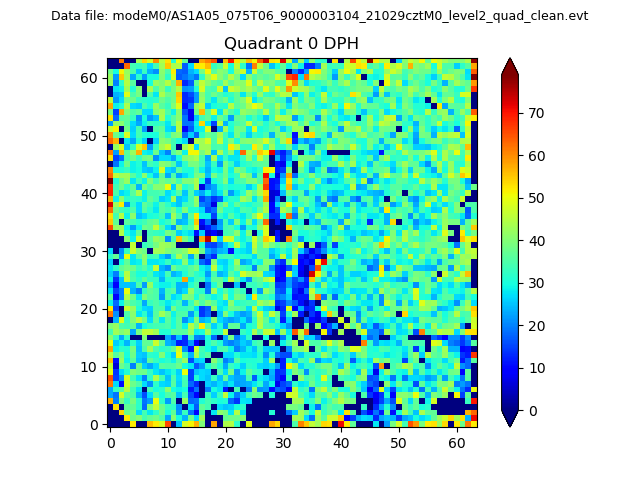 |
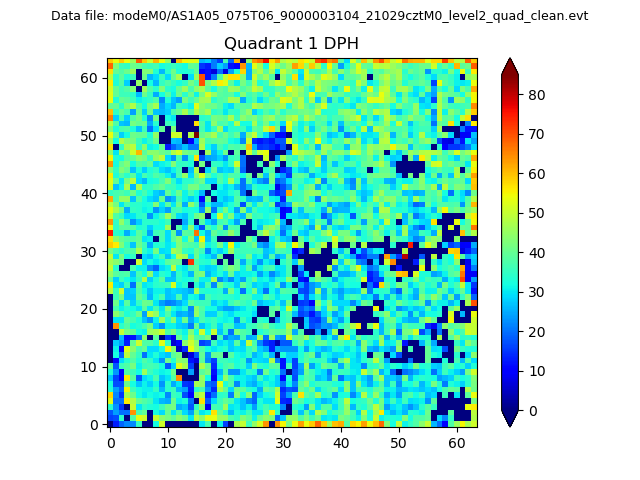 |
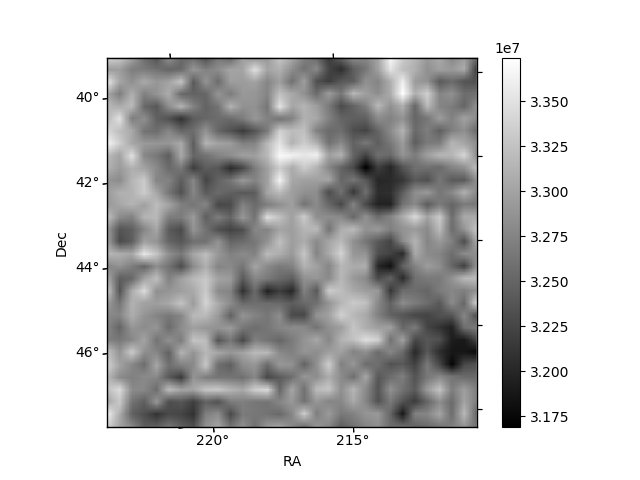
Quadrant B |
|---|---|---|---|
| Quadrant D | 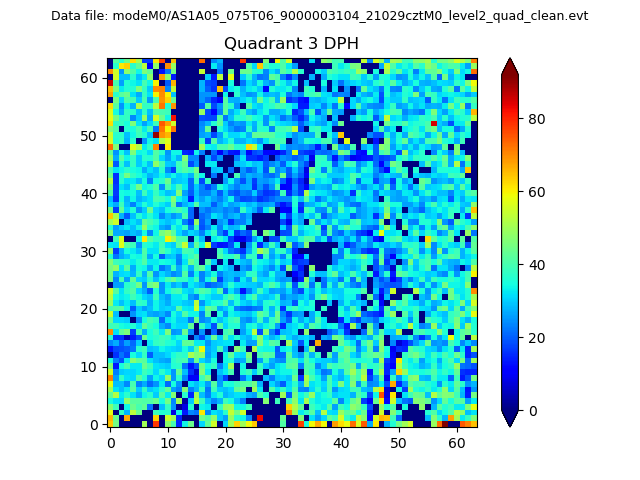 |
 |
Quadrant C |
| Plot type | Count rate plots | Images |
|---|---|---|
| Comparison with Poisson distribution Blue bars denote a histogram of data divided into 1 sec bins. Red curve is a Poisson curve with rate = median count rate of data. |
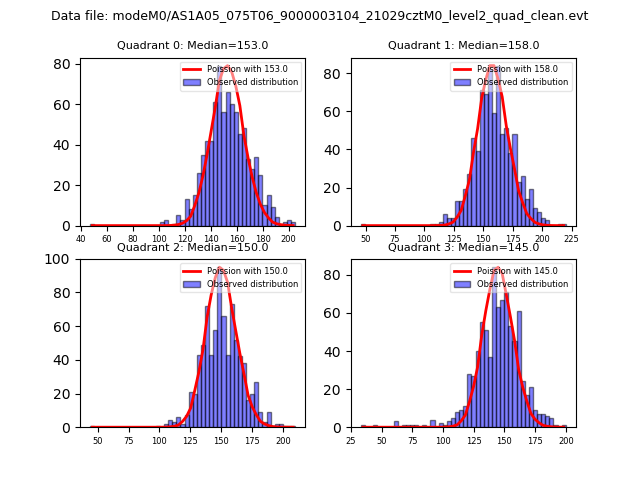 |
 |
| Quadrant-wise count rates Data is divided into 100 sec bins |
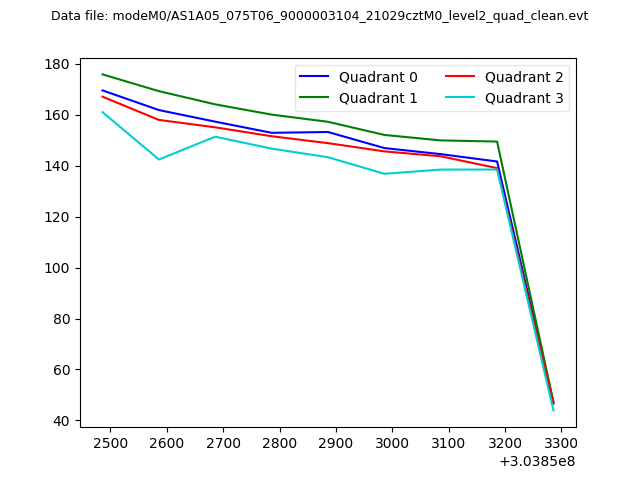 |
|
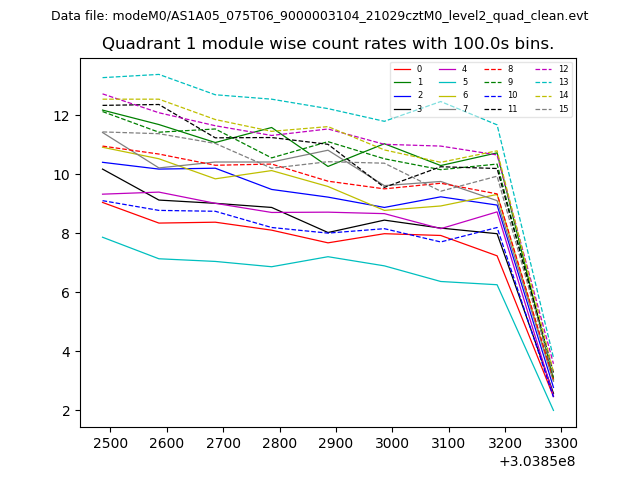
| Module-wise count rates for Quadrant A Data is divided into 100 sec bins |
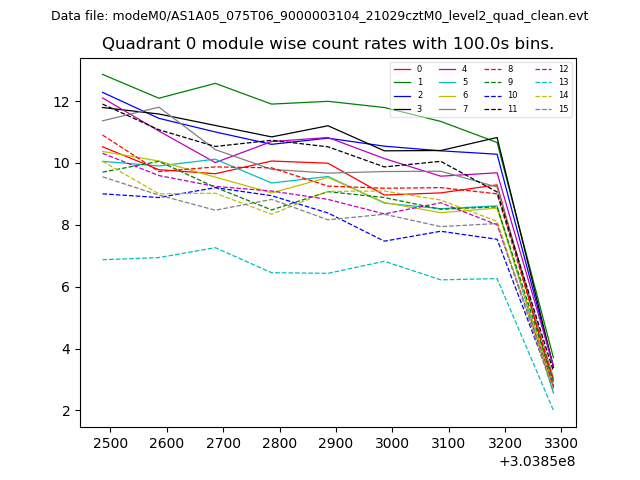 |
 |
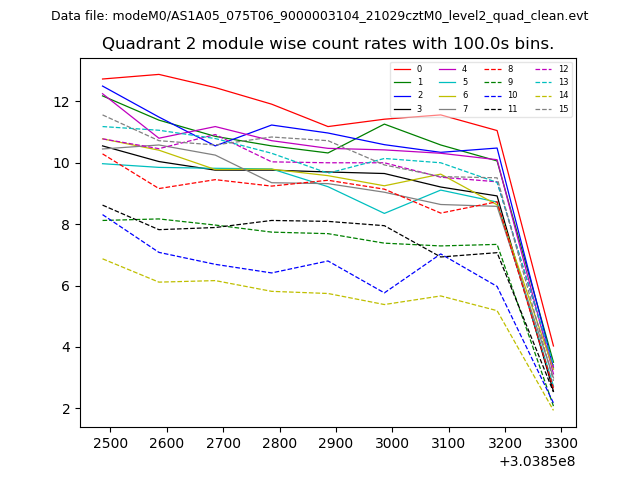
| Module-wise count rates for Quadrant B Data is divided into 100 sec bins |
 |
 |
| Module-wise count rates for Quadrant C Data is divided into 100 sec bins |
 |
 |
| Module-wise count rates for Quadrant D Data is divided into 100 sec bins |
 |
 |
| Parameter | Plot |
|---|---|
| CZT HV Monitor | 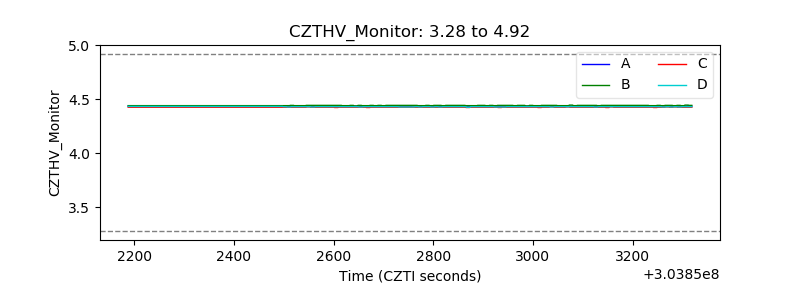 |
| D_VDD |  |
| Temperature 1 | 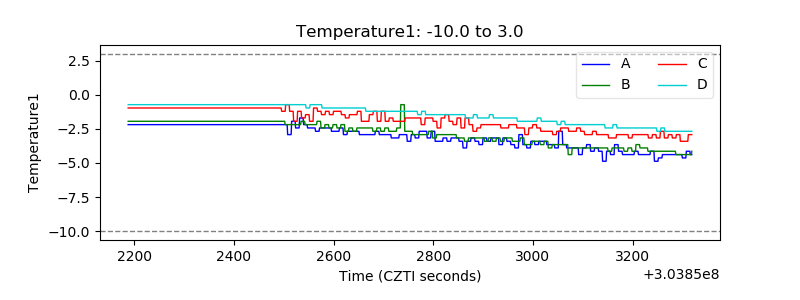 |
| Veto HV Monitor | 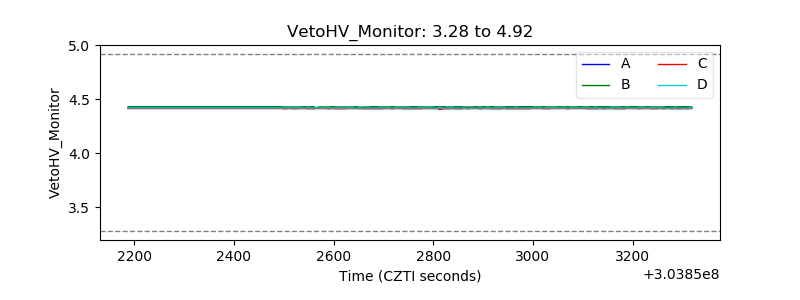 |
| Veto LLD |  |
| Alpha Counter | 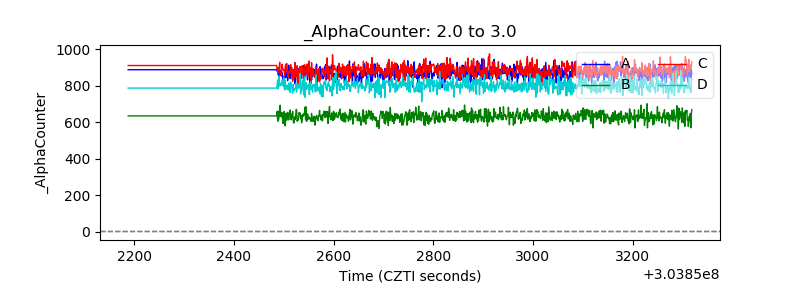 |
| _CPM_Rate | 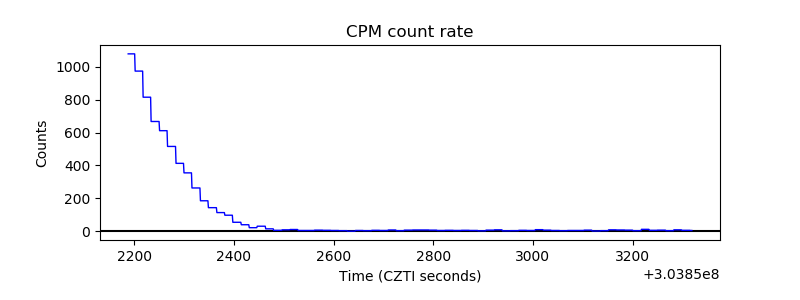 |
| CZT Counter | 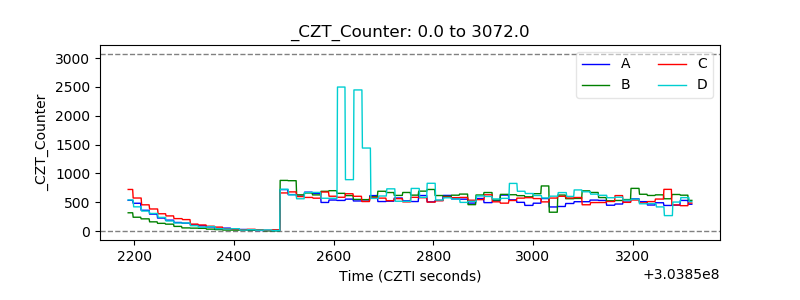 |
| +2.5 Volts monitor |  |
| +5 Volts monitor | 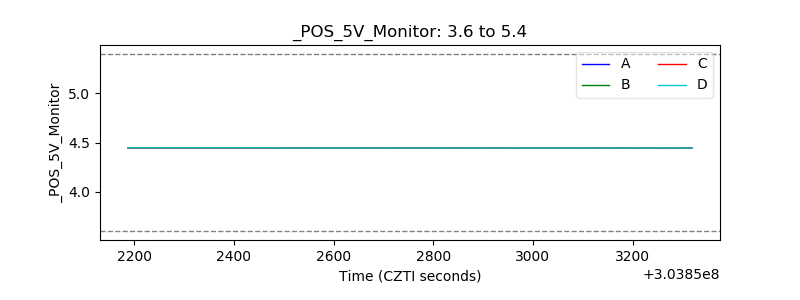 |
| _ROLL_ROT | 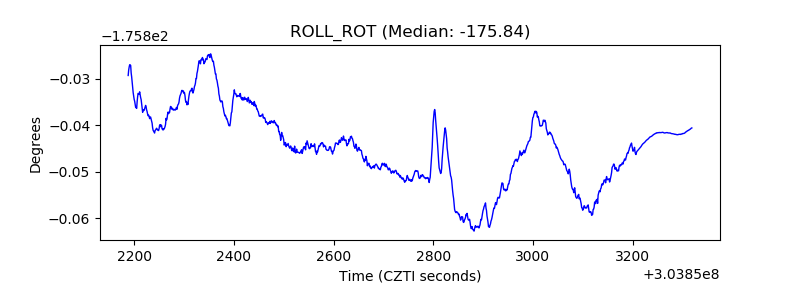 |
| _Roll_DEC | 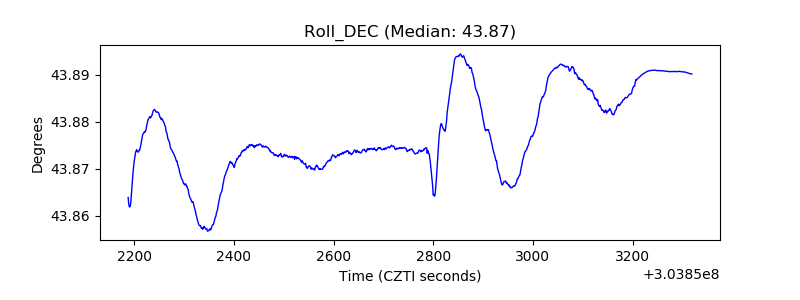 |
| _Roll_RA | 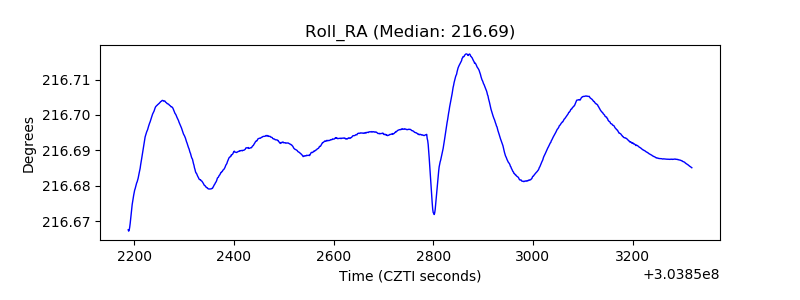 |
| Veto Counter |  |