| Param | Original file | Final file |
|---|---|---|
| Filename | modeM0/AS1A05_117T01_9000003166_21461cztM0_level2.evt | modeM0/AS1A05_117T01_9000003166_21461cztM0_level2_quad_clean.evt |
| Size (bytes) | 65,301,120 | 14,457,600 |
| Size | 62.3 MB | 13.8 MB |
| Events in quadrant A | 364,893 | 96,710 |
| Events in quadrant B | 380,112 | 98,805 |
| Events in quadrant C | 367,488 | 96,177 |
| Events in quadrant D | 814,528 | 89,163 |
| Mode SS | |||
|---|---|---|---|
| Quadrant | BADHDUFLAG | Total packets | Discarded packets |
| A | 0 | 16 | 0 |
| B | 0 | 16 | 0 |
| C | 0 | 16 | 0 |
| D | 0 | 16 | 0 |
| Mode M9 | |||
|---|---|---|---|
| Quadrant | BADHDUFLAG | Total packets | Discarded packets |
| A | 0 | 9 | 0 |
| B | 0 | 9 | 0 |
| C | 0 | 9 | 0 |
| D | 0 | 9 | 0 |
| Mode M0 | |||
|---|---|---|---|
| Quadrant | BADHDUFLAG | Total packets | Discarded packets |
| A | 0 | 1476 | 1 |
| B | 0 | 1535 | 1 |
| C | 0 | 1497 | 1 |
| D | 0 | 2897 | 1 |
| Quadrant | Total seconds | Saturated seconds | Saturation percentage |
|---|---|---|---|
| A | 697 | 10 | 1.434720% |
| B | 697 | 21 | 3.012912% |
| C | 698 | 25 | 3.581662% |
| D | 698 | 94 | 13.467049% |
Noise dominated data is calculated using 1-second bins in cleaned event files. If a bin has >2000 counts, and if more than 50% of those come from <1% of pixels, then it is considered to be noise-dominated and hence unusable.
| Quadrant | # 1 sec bins | Bins with >0 counts | Bins with >2000 counts | High rate bins dominated by noise | Noise dominated (total time) | Noise dominated (detector-on time) | Marked lightcurve |
|---|---|---|---|---|---|---|---|
| A | 1617 | 698 | 0 | 0 | 0.00% | 0.00% | 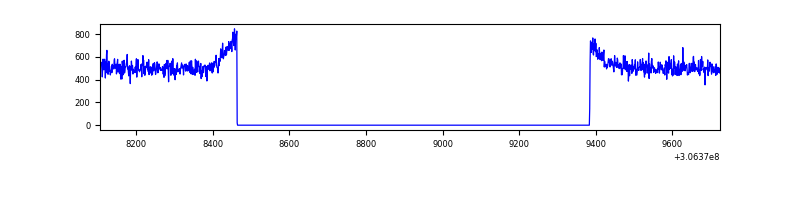 |
| B | 1617 | 697 | 0 | 0 | 0.00% | 0.00% | 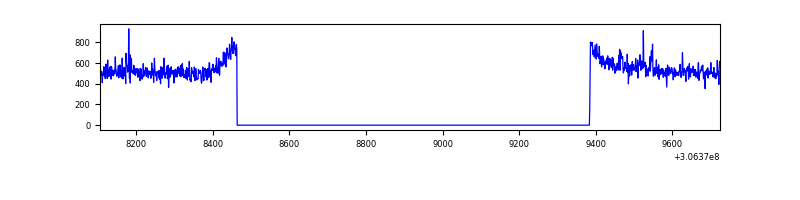 |
| C | 1618 | 698 | 0 | 0 | 0.00% | 0.00% | 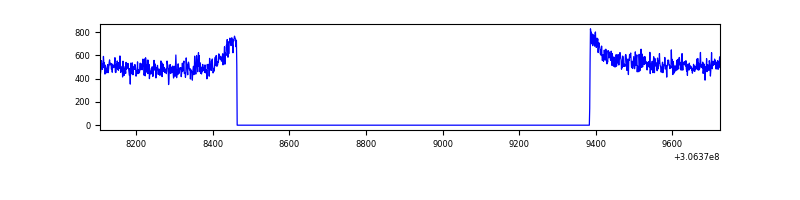 |
| D | 1618 | 698 | 72 | 72 | 4.45% | 10.32% | 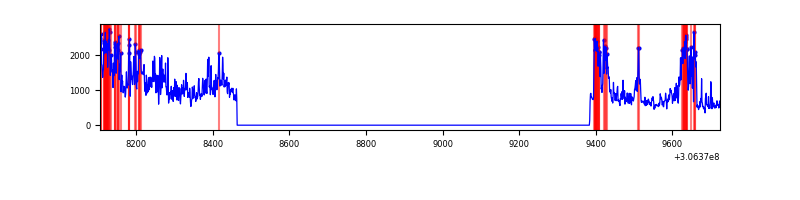 |
Top three noisy pixels from each quadrant. If the there are fewer than three noisy pixels in the level2.evt file, extra rows are filled as -1
| Pixel properties | Quadrant properties | ||||||
|---|---|---|---|---|---|---|---|
| Quadrant | DetID | PixID | Counts | Sigma | Mean | Median | Sigma |
| A | 13 | 254 | 938 | 40.34 | 94 | 92 | 21.0 |
| A | 3 | 137 | 865 | 36.86 | 94 | 92 | 21.0 |
| A | 0 | 226 | 781 | 32.86 | 94 | 92 | 21.0 |
| B | 0 | 230 | 4851 | 224.78 | 94 | 92 | 21.2 |
| B | 0 | 197 | 3352 | 153.98 | 94 | 92 | 21.2 |
| B | 0 | 229 | 2427 | 110.29 | 94 | 92 | 21.2 |
| C | 14 | 238 | 14246 | 618.24 | 90 | 90 | 22.9 |
| C | 13 | 61 | 646 | 24.28 | 90 | 90 | 22.9 |
| C | 3 | 233 | 480 | 17.03 | 90 | 90 | 22.9 |
| D | 12 | 235 | 412003 | 17583.1 | 89 | 87 | 23.4 |
| D | 1 | 20 | 21560 | 916.6 | 89 | 87 | 23.4 |
| D | 14 | 35 | 16581 | 704.07 | 89 | 87 | 23.4 |
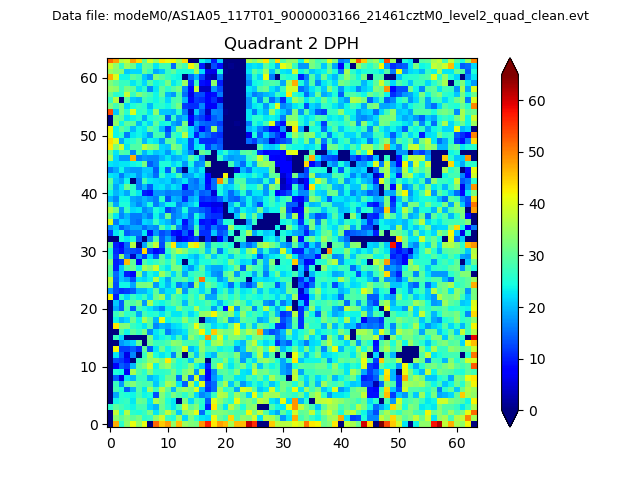
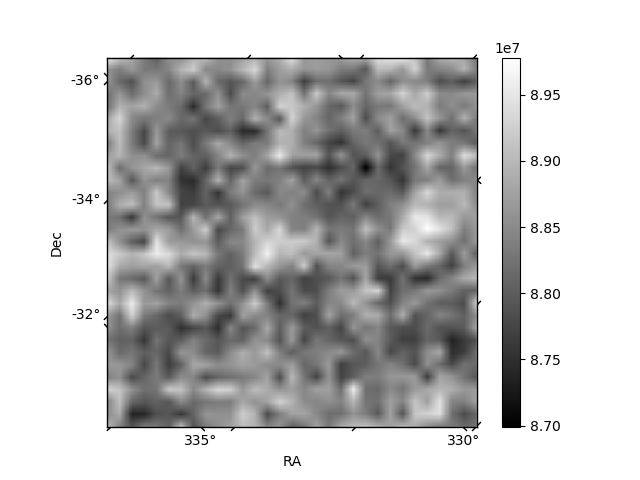
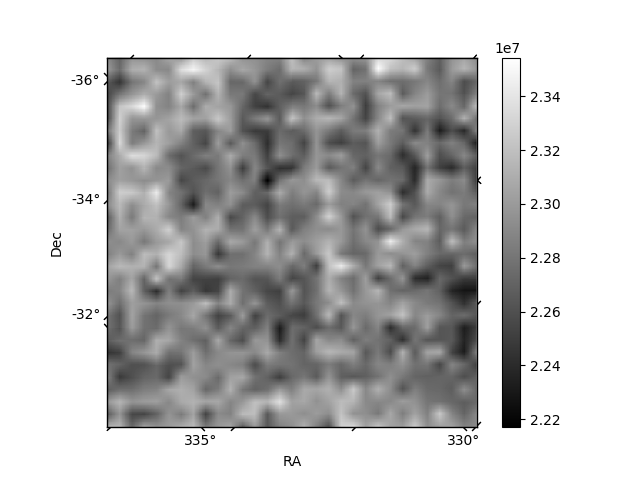
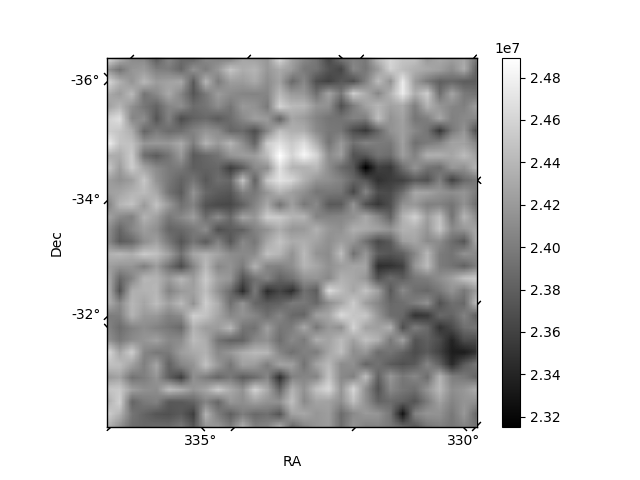
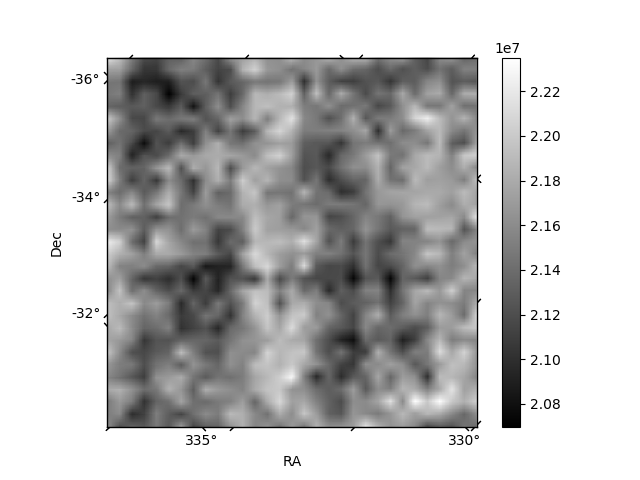
Histogram calculated using DETX and DETY for each event in the final _common_clean file
| Quadrant A | 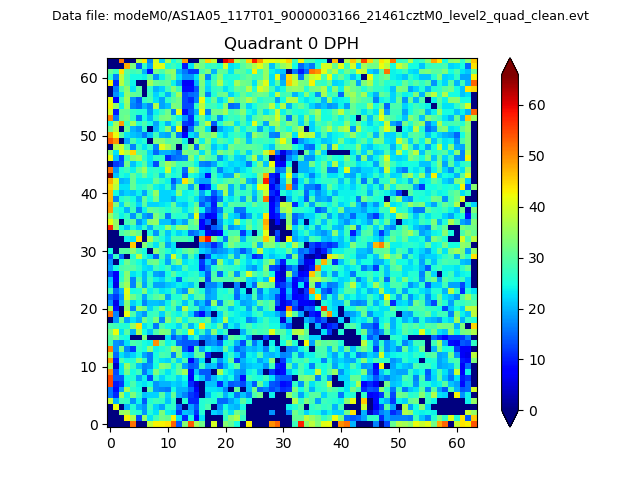 |
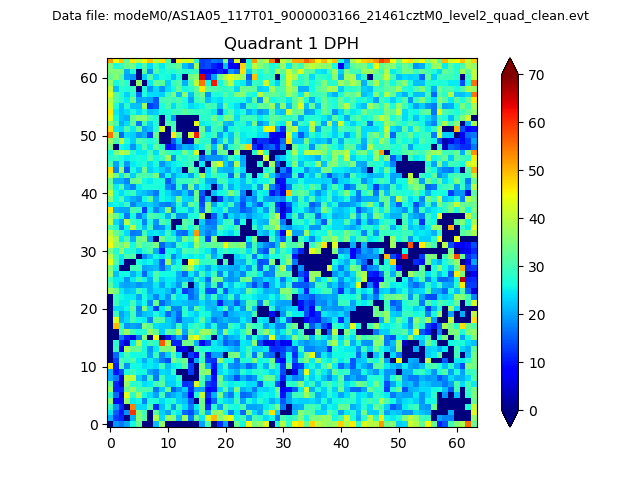 |
Quadrant B |
|---|---|---|---|
| Quadrant D | 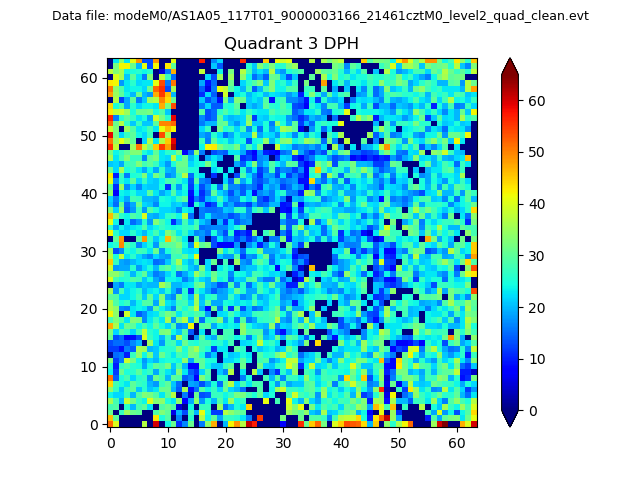 |
 |
Quadrant C |
| Plot type | Count rate plots | Images |
|---|---|---|
| Comparison with Poisson distribution Blue bars denote a histogram of data divided into 1 sec bins. Red curve is a Poisson curve with rate = median count rate of data. |
 |
 |
| Quadrant-wise count rates Data is divided into 100 sec bins |
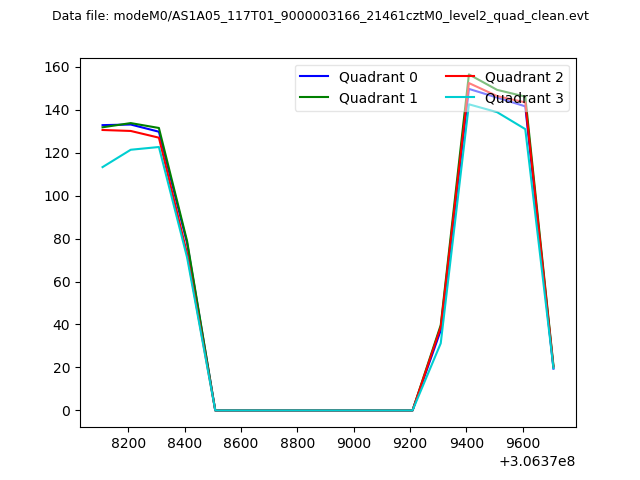 |
|
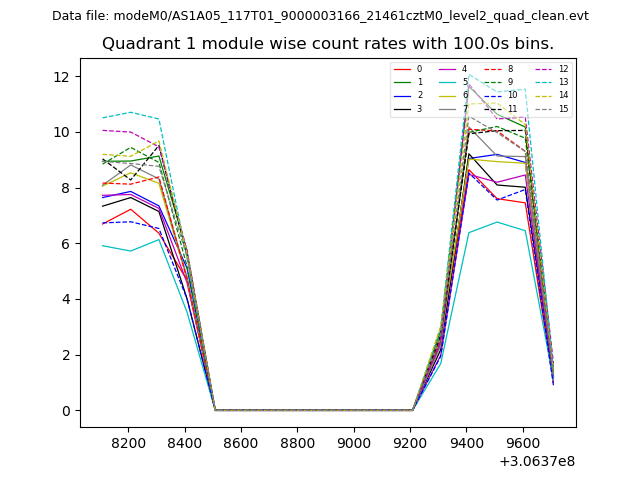
| Module-wise count rates for Quadrant A Data is divided into 100 sec bins |
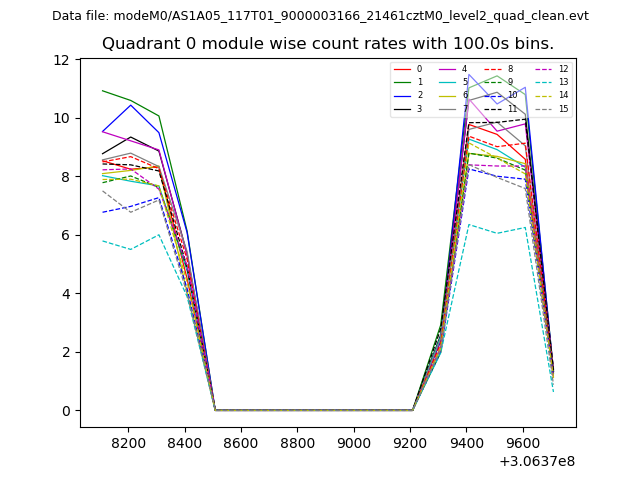 |
 |
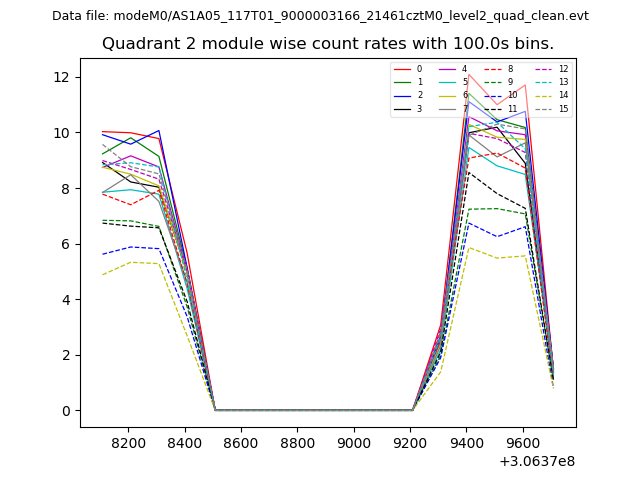
| Module-wise count rates for Quadrant B Data is divided into 100 sec bins |
 |
 |
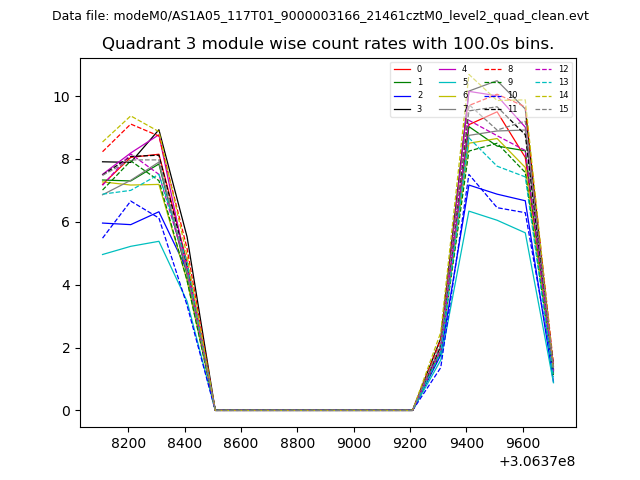
| Module-wise count rates for Quadrant C Data is divided into 100 sec bins |
 |
 |
| Module-wise count rates for Quadrant D Data is divided into 100 sec bins |
 |
 |
| Parameter | Plot |
|---|---|
| CZT HV Monitor | 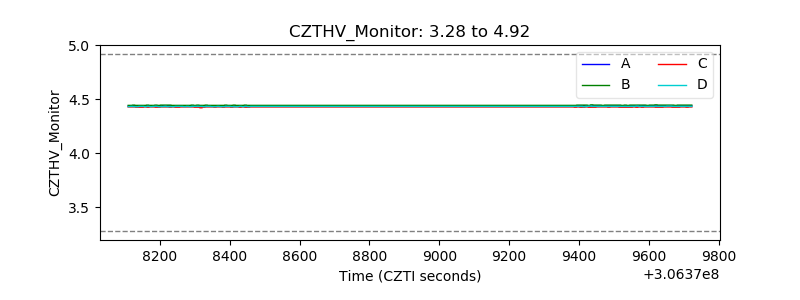 |
| D_VDD | 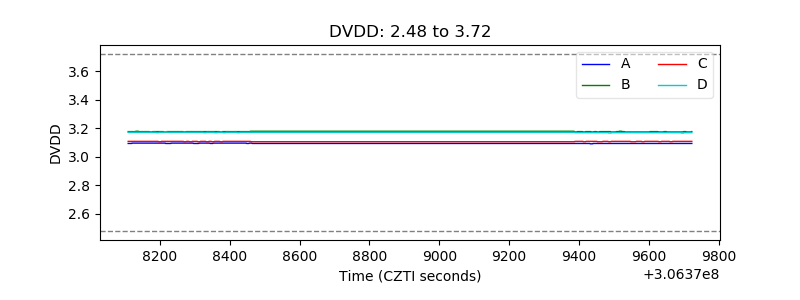 |
| Temperature 1 | 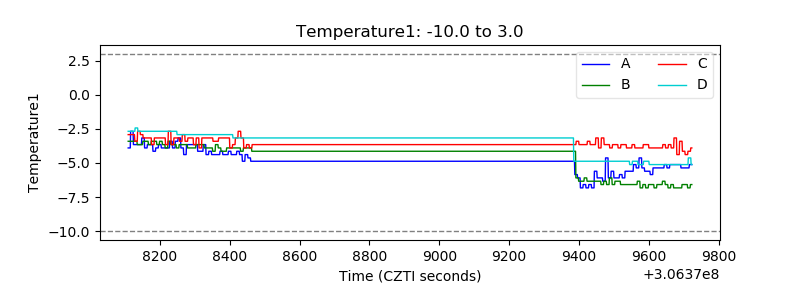 |
| Veto HV Monitor | 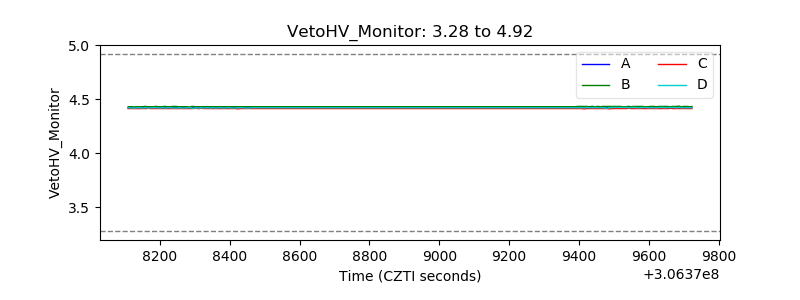 |
| Veto LLD | 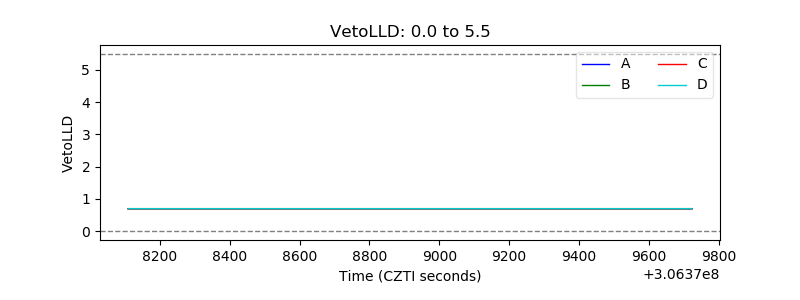 |
| Alpha Counter | 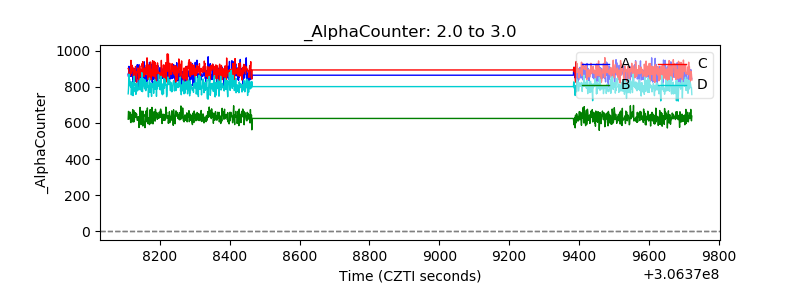 |
| _CPM_Rate | 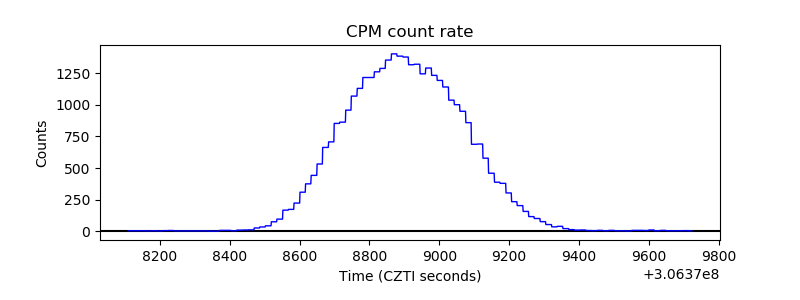 |
| CZT Counter | 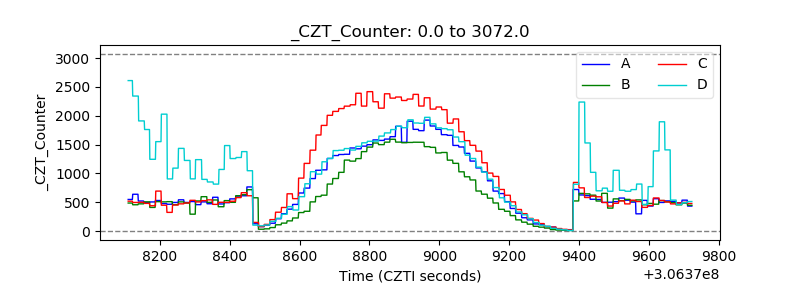 |
| +2.5 Volts monitor |  |
| +5 Volts monitor |  |
| _ROLL_ROT | 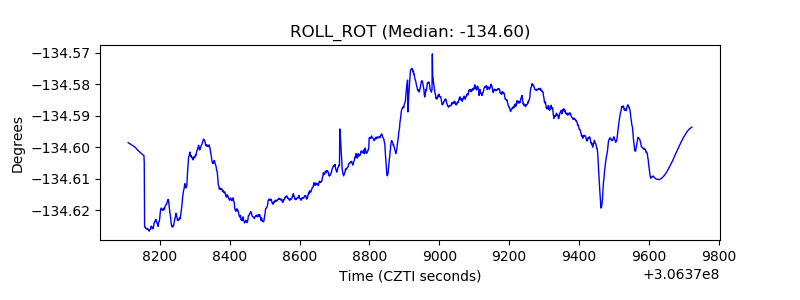 |
| _Roll_DEC | 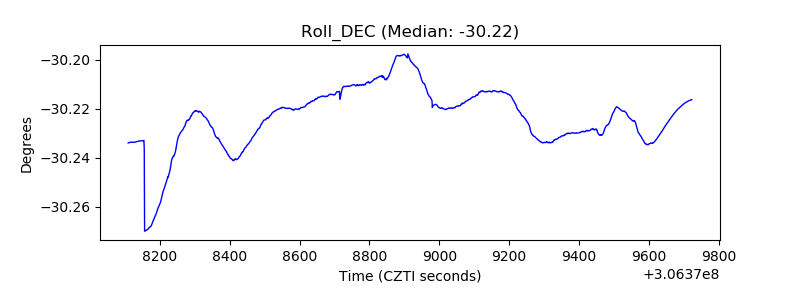 |
| _Roll_RA | 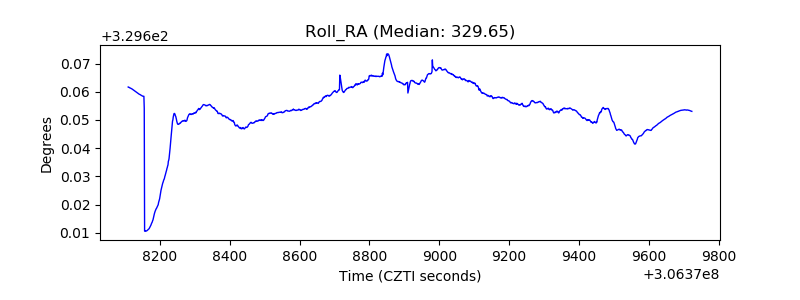 |
| Veto Counter | 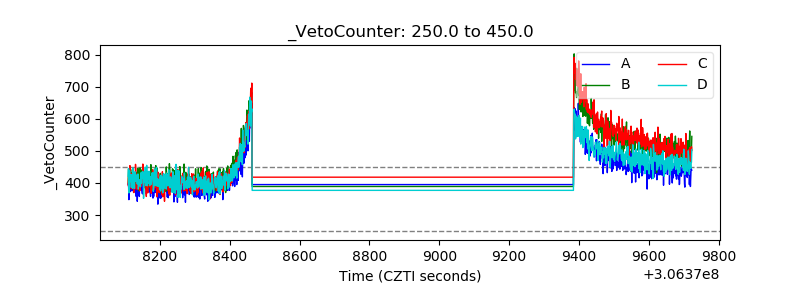 |