| Param | Original file | Final file |
|---|---|---|
| Filename | modeM0/AS1T03_141T01_9000003174_21485cztM0_level2.evt | modeM0/AS1T03_141T01_9000003174_21485cztM0_level2_quad_clean.evt |
| Size (bytes) | 533,206,080 | 110,413,440 |
| Size | 508.5 MB | 105.3 MB |
| Events in quadrant A | 3,612,060 | 711,667 |
| Events in quadrant B | 3,786,956 | 724,499 |
| Events in quadrant C | 3,664,626 | 702,784 |
| Events in quadrant D | 4,569,741 | 677,512 |
| Mode M9 | |||
|---|---|---|---|
| Quadrant | BADHDUFLAG | Total packets | Discarded packets |
| A | 0 | 2 | 0 |
| B | 0 | 3 | 0 |
| C | 0 | 3 | 0 |
| D | 0 | 3 | 0 |
| Mode M0 | |||
|---|---|---|---|
| Quadrant | BADHDUFLAG | Total packets | Discarded packets |
| A | 0 | 15732 | 0 |
| B | 0 | 16122 | 0 |
| C | 0 | 15887 | 0 |
| D | 0 | 18657 | 0 |
| Mode SS | |||
|---|---|---|---|
| Quadrant | BADHDUFLAG | Total packets | Discarded packets |
| A | 0 | 146 | 2 |
| B | 0 | 146 | 0 |
| C | 0 | 146 | 2 |
| D | 0 | 146 | 0 |
| Quadrant | Total seconds | Saturated seconds | Saturation percentage |
|---|---|---|---|
| A | 7583 | 64 | 0.843993% |
| B | 7582 | 118 | 1.556318% |
| C | 7582 | 112 | 1.477183% |
| D | 7582 | 117 | 1.543128% |
Noise dominated data is calculated using 1-second bins in cleaned event files. If a bin has >2000 counts, and if more than 50% of those come from <1% of pixels, then it is considered to be noise-dominated and hence unusable.
| Quadrant | # 1 sec bins | Bins with >0 counts | Bins with >2000 counts | High rate bins dominated by noise | Noise dominated (total time) | Noise dominated (detector-on time) | Marked lightcurve |
|---|---|---|---|---|---|---|---|
| A | 7813 | 7584 | 0 | 0 | 0.00% | 0.00% | 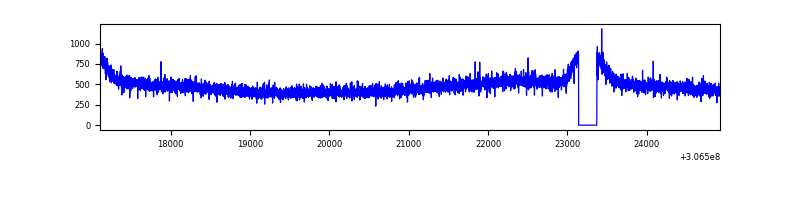 |
| B | 7812 | 7583 | 0 | 0 | 0.00% | 0.00% | 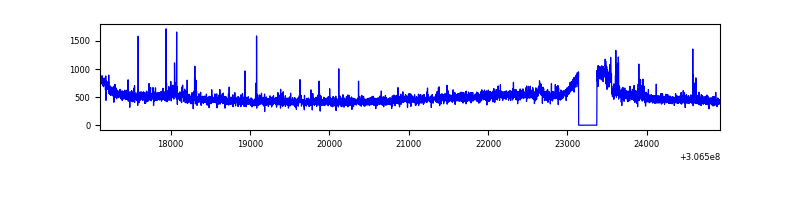 |
| C | 7812 | 7582 | 0 | 0 | 0.00% | 0.00% | 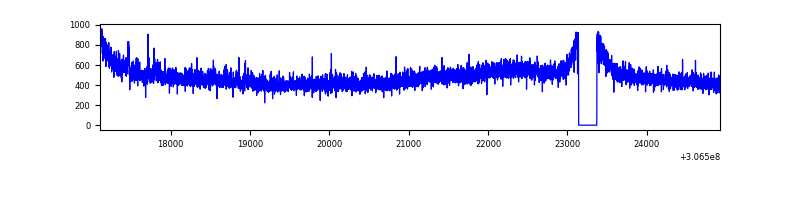 |
| D | 7812 | 7583 | 134 | 134 | 1.72% | 1.77% | 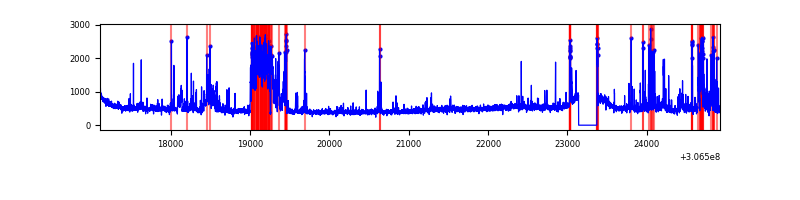 |
Top three noisy pixels from each quadrant. If the there are fewer than three noisy pixels in the level2.evt file, extra rows are filled as -1
| Pixel properties | Quadrant properties | ||||||
|---|---|---|---|---|---|---|---|
| Quadrant | DetID | PixID | Counts | Sigma | Mean | Median | Sigma |
| A | 13 | 254 | 12297 | 60.16 | 935 | 913 | 189.2 |
| A | 3 | 137 | 7907 | 36.96 | 935 | 913 | 189.2 |
| A | 0 | 226 | 7907 | 36.96 | 935 | 913 | 189.2 |
| B | 0 | 190 | 41701 | 227.2 | 931 | 906 | 179.6 |
| B | 0 | 229 | 37756 | 205.22 | 931 | 906 | 179.6 |
| B | 0 | 230 | 35618 | 193.32 | 931 | 906 | 179.6 |
| C | 14 | 238 | 140674 | 669.93 | 890 | 894 | 208.6 |
| C | 0 | 239 | 49535 | 233.13 | 890 | 894 | 208.6 |
| C | 13 | 61 | 6317 | 25.99 | 890 | 894 | 208.6 |
| D | 5 | 32 | 455740 | 2078.5 | 903 | 876 | 218.8 |
| D | 7 | 38 | 338661 | 1543.51 | 903 | 876 | 218.8 |
| D | 1 | 52 | 109888 | 498.13 | 903 | 876 | 218.8 |
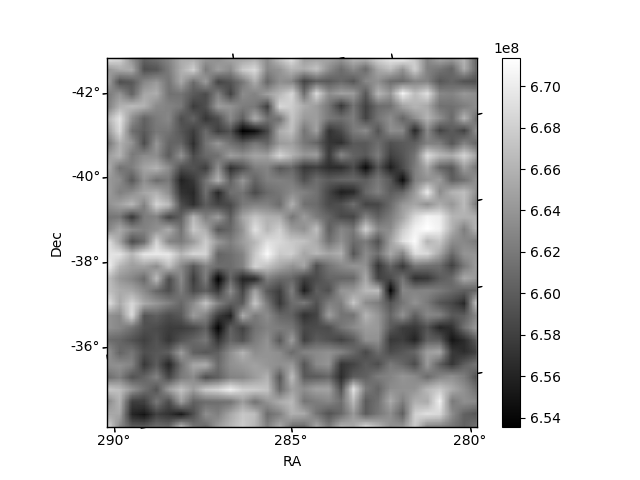
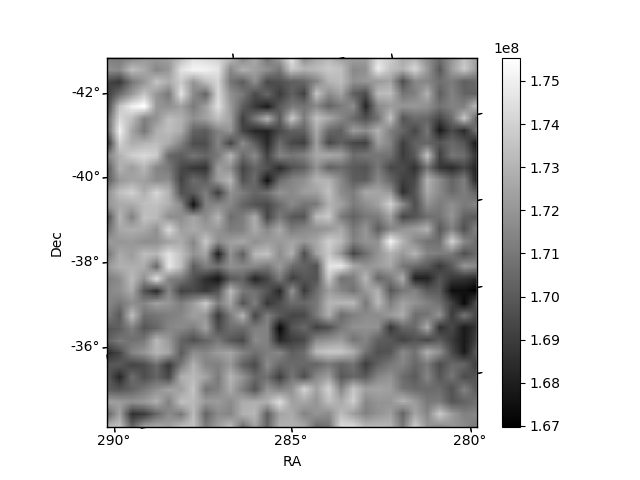
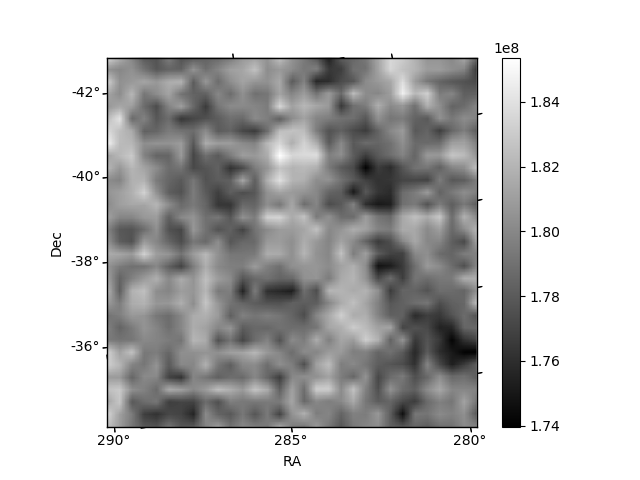
Histogram calculated using DETX and DETY for each event in the final _common_clean file
| Quadrant A | 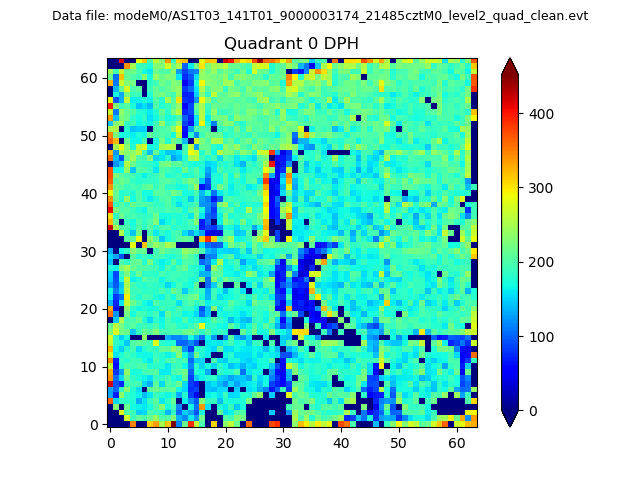 |
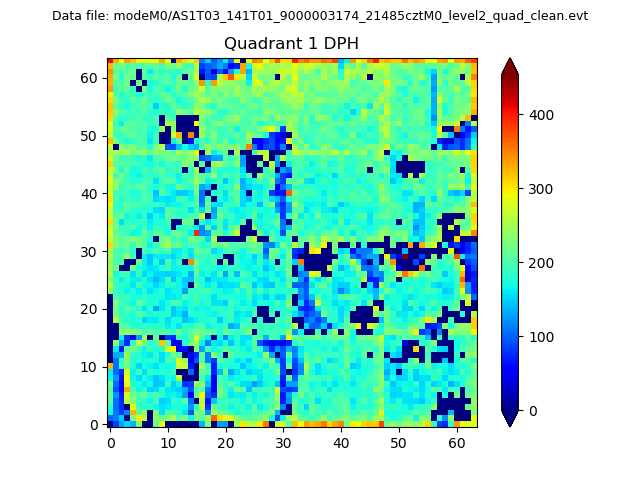 |
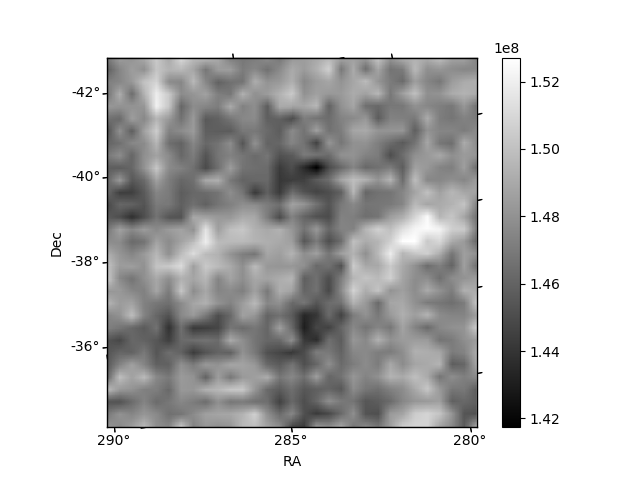
Quadrant B |
|---|---|---|---|
| Quadrant D |  |
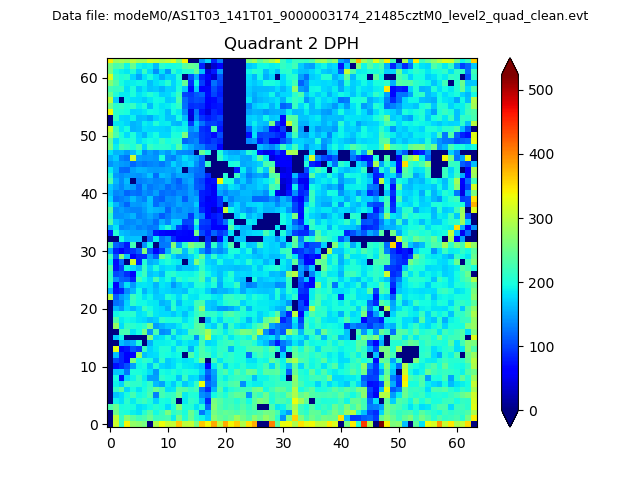 |
Quadrant C |
| Plot type | Count rate plots | Images |
|---|---|---|
| Comparison with Poisson distribution Blue bars denote a histogram of data divided into 1 sec bins. Red curve is a Poisson curve with rate = median count rate of data. |
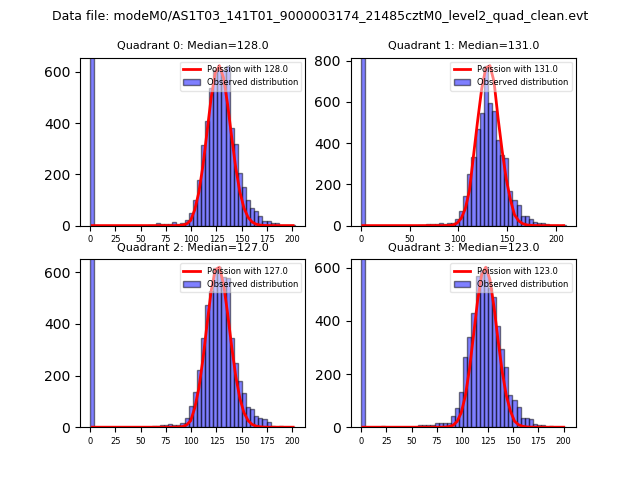 |
 |
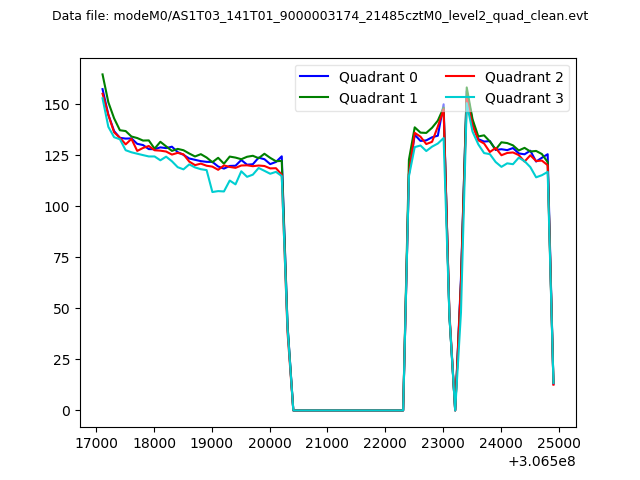
| Quadrant-wise count rates Data is divided into 100 sec bins |
 |
|
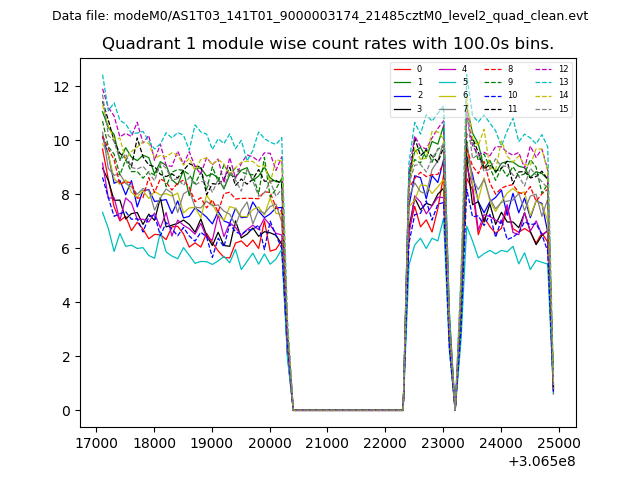
| Module-wise count rates for Quadrant A Data is divided into 100 sec bins |
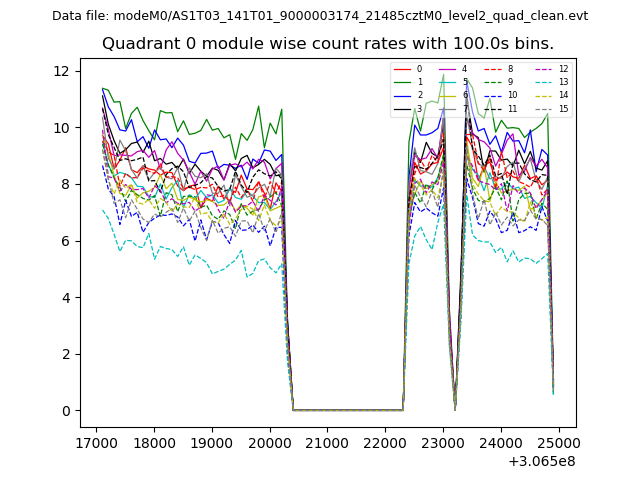 |
 |
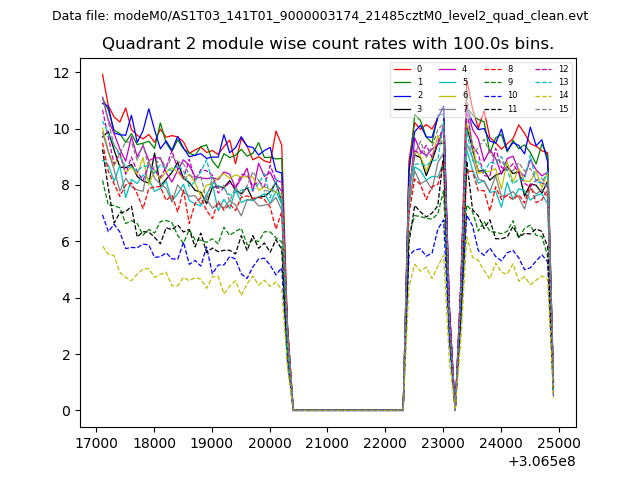
| Module-wise count rates for Quadrant B Data is divided into 100 sec bins |
 |
 |
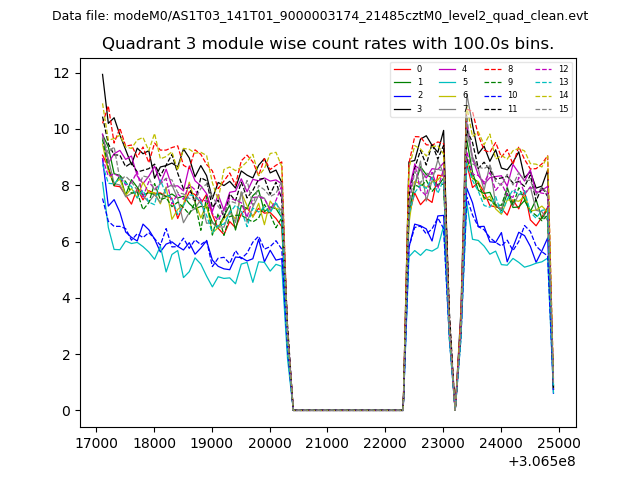
| Module-wise count rates for Quadrant C Data is divided into 100 sec bins |
 |
 |
| Module-wise count rates for Quadrant D Data is divided into 100 sec bins |
 |
 |
| Parameter | Plot |
|---|---|
| CZT HV Monitor | 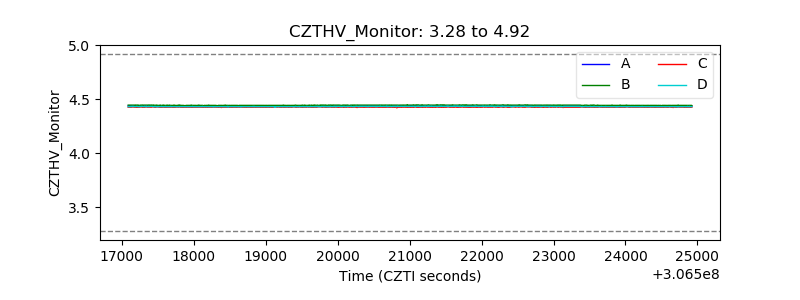 |
| D_VDD | 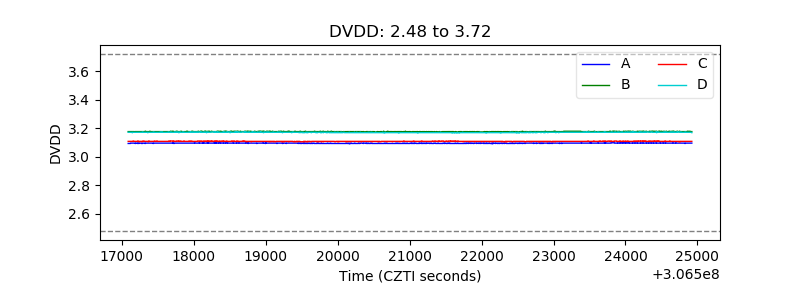 |
| Temperature 1 | 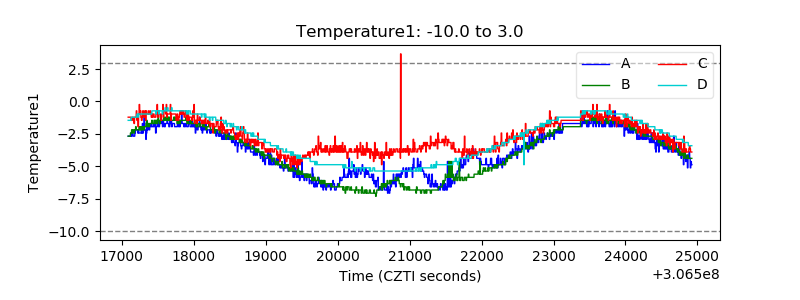 |
| Veto HV Monitor | 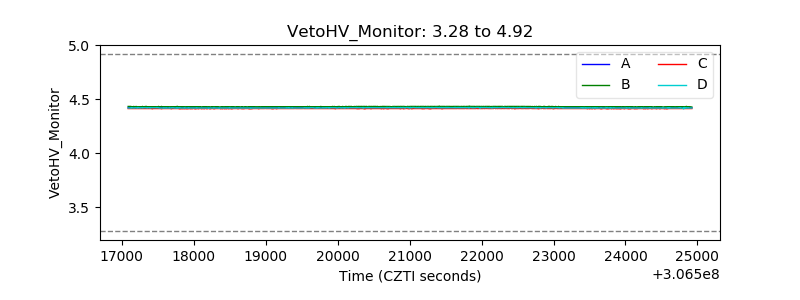 |
| Veto LLD | 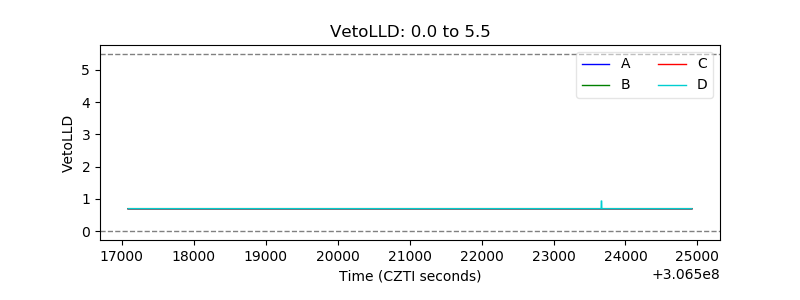 |
| Alpha Counter | 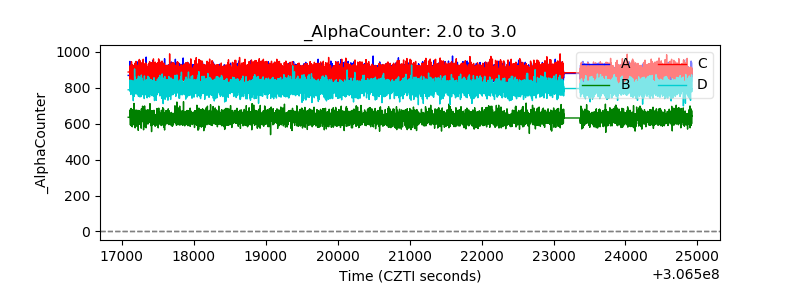 |
| _CPM_Rate | 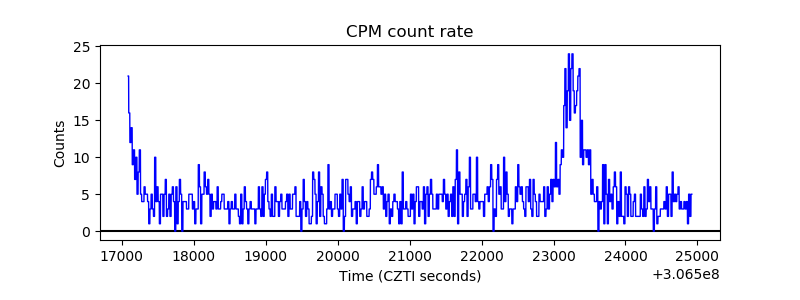 |
| CZT Counter | 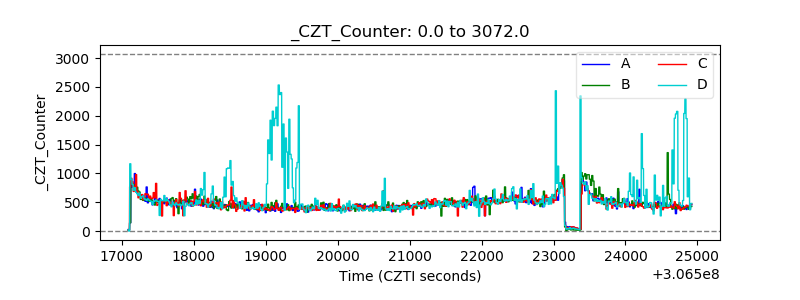 |
| +2.5 Volts monitor |  |
| +5 Volts monitor | 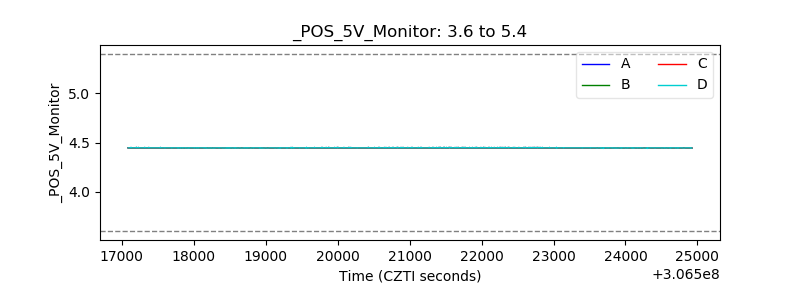 |
| _ROLL_ROT | 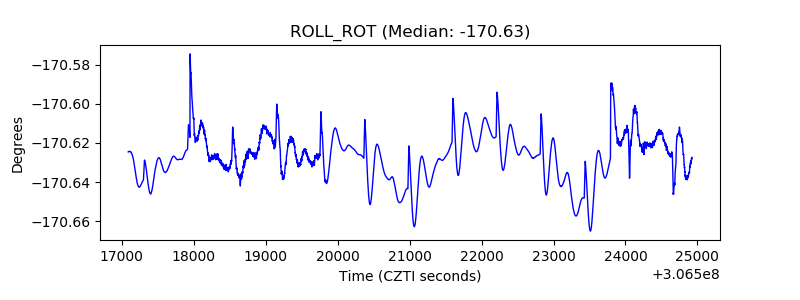 |
| _Roll_DEC | 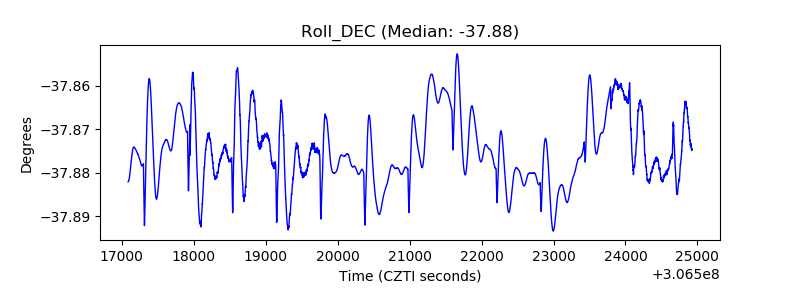 |
| _Roll_RA | 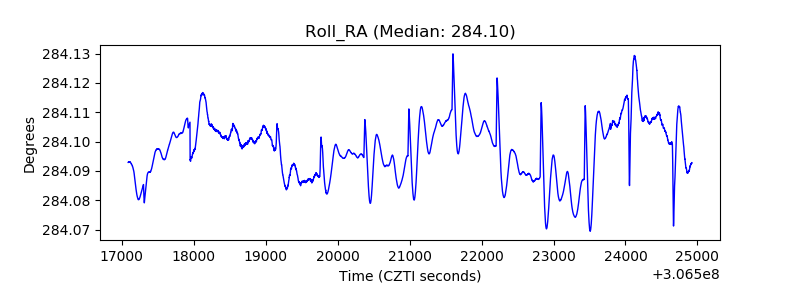 |
| Veto Counter | 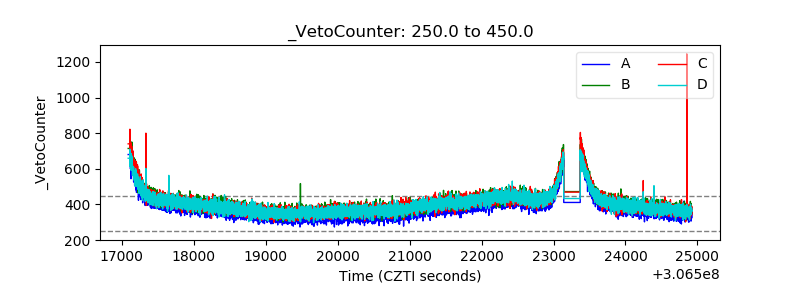 |