| Param | Original file | Final file |
|---|---|---|
| Filename | modeM0/AS1A07_134T01_9000003256_22043cztM0_level2.evt | modeM0/AS1A07_134T01_9000003256_22043cztM0_level2_quad_clean.evt |
| Size (bytes) | 277,079,040 | 46,393,920 |
| Size | 264.2 MB | 44.2 MB |
| Events in quadrant A | 1,864,481 | 293,001 |
| Events in quadrant B | 1,955,535 | 299,748 |
| Events in quadrant C | 1,875,256 | 286,316 |
| Events in quadrant D | 2,452,076 | 272,603 |
| Mode M9 | |||
|---|---|---|---|
| Quadrant | BADHDUFLAG | Total packets | Discarded packets |
| A | 0 | 4 | 0 |
| B | 0 | 5 | 0 |
| C | 0 | 5 | 0 |
| D | 0 | 5 | 0 |
| Mode SS | |||
|---|---|---|---|
| Quadrant | BADHDUFLAG | Total packets | Discarded packets |
| A | 0 | 72 | 0 |
| B | 0 | 72 | 0 |
| C | 0 | 72 | 0 |
| D | 0 | 72 | 0 |
| Mode M0 | |||
|---|---|---|---|
| Quadrant | BADHDUFLAG | Total packets | Discarded packets |
| A | 0 | 7668 | 1 |
| B | 0 | 8000 | 1 |
| C | 0 | 7848 | 1 |
| D | 0 | 9548 | 1 |
| Quadrant | Total seconds | Saturated seconds | Saturation percentage |
|---|---|---|---|
| A | 3568 | 11 | 0.308296% |
| B | 3568 | 14 | 0.392377% |
| C | 3568 | 34 | 0.952915% |
| D | 3568 | 157 | 4.400224% |
Noise dominated data is calculated using 1-second bins in cleaned event files. If a bin has >2000 counts, and if more than 50% of those come from <1% of pixels, then it is considered to be noise-dominated and hence unusable.
| Quadrant | # 1 sec bins | Bins with >0 counts | Bins with >2000 counts | High rate bins dominated by noise | Noise dominated (total time) | Noise dominated (detector-on time) | Marked lightcurve |
|---|---|---|---|---|---|---|---|
| A | 3568 | 3568 | 0 | 0 | 0.00% | 0.00% | 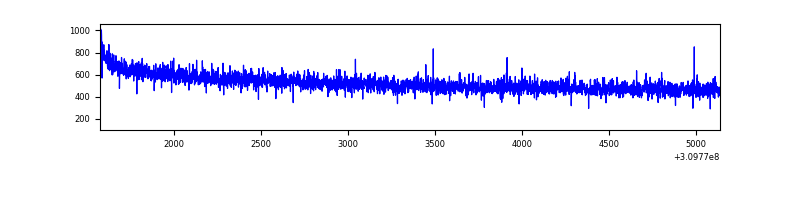 |
| B | 3568 | 3568 | 0 | 0 | 0.00% | 0.00% | 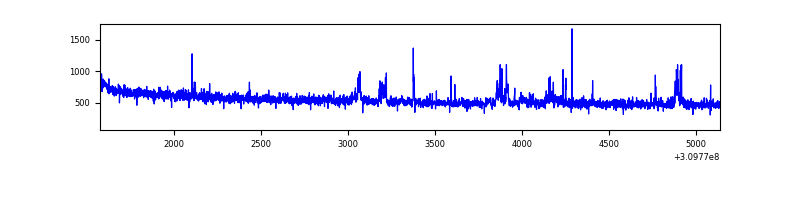 |
| C | 3568 | 3568 | 0 | 0 | 0.00% | 0.00% | 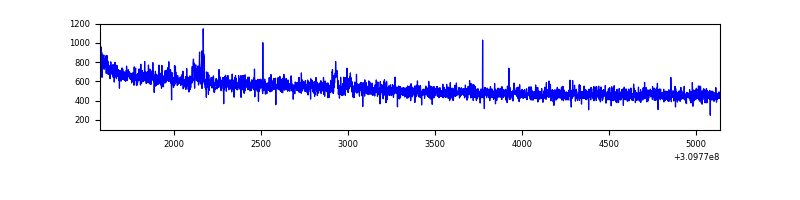 |
| D | 3568 | 3568 | 144 | 144 | 4.04% | 4.04% | 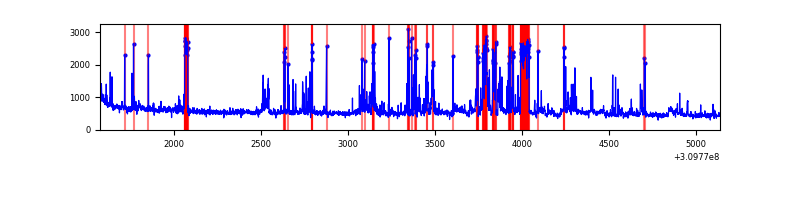 |
Top three noisy pixels from each quadrant. If the there are fewer than three noisy pixels in the level2.evt file, extra rows are filled as -1
| Pixel properties | Quadrant properties | ||||||
|---|---|---|---|---|---|---|---|
| Quadrant | DetID | PixID | Counts | Sigma | Mean | Median | Sigma |
| A | 13 | 254 | 5145 | 48.13 | 484 | 476 | 97.0 |
| A | 0 | 226 | 4241 | 38.81 | 484 | 476 | 97.0 |
| A | 3 | 137 | 3854 | 34.82 | 484 | 476 | 97.0 |
| B | 3 | 64 | 22257 | 240.32 | 480 | 470 | 90.7 |
| B | 0 | 197 | 19554 | 210.51 | 480 | 470 | 90.7 |
| B | 0 | 230 | 17030 | 182.67 | 480 | 470 | 90.7 |
| C | 14 | 238 | 74360 | 698.43 | 458 | 462 | 105.8 |
| C | 10 | 22 | 13706 | 125.17 | 458 | 462 | 105.8 |
| C | 13 | 61 | 3085 | 24.79 | 458 | 462 | 105.8 |
| D | 11 | 176 | 543001 | 4912.49 | 458 | 445 | 110.4 |
| D | 1 | 52 | 106954 | 964.37 | 458 | 445 | 110.4 |
| D | 2 | 136 | 54733 | 491.54 | 458 | 445 | 110.4 |
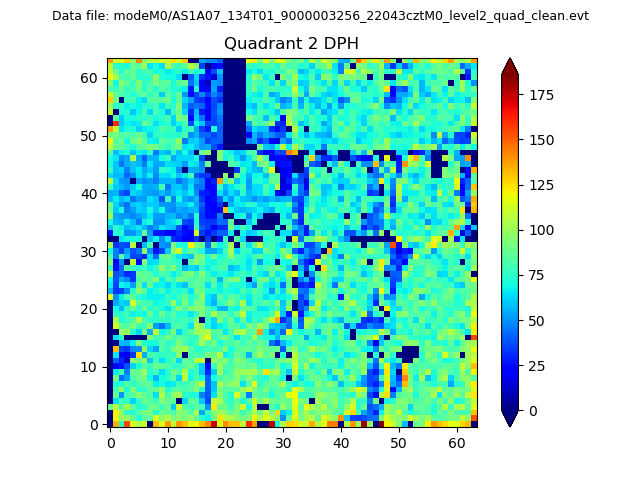
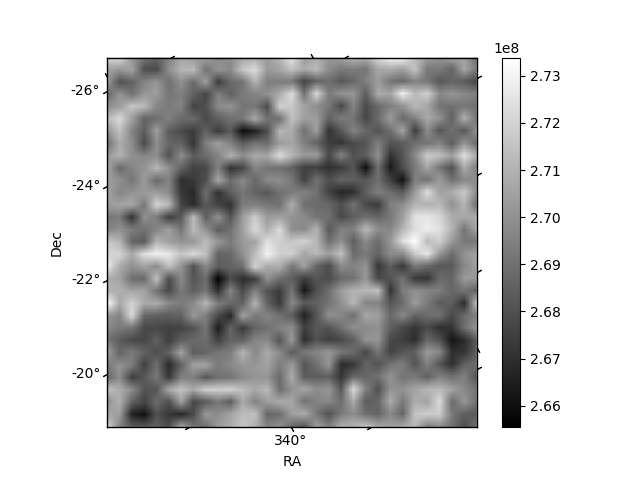
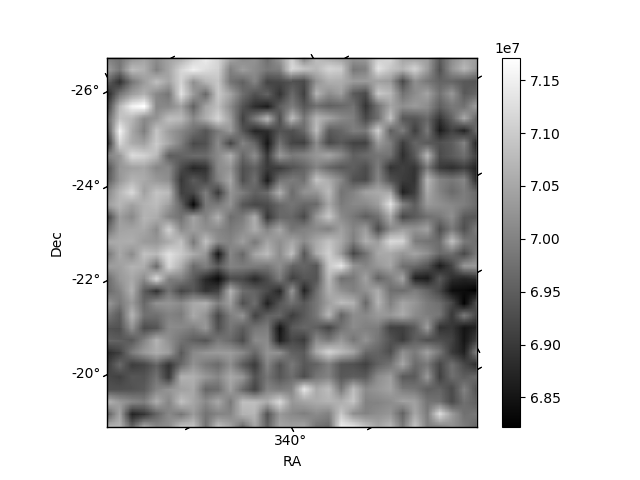
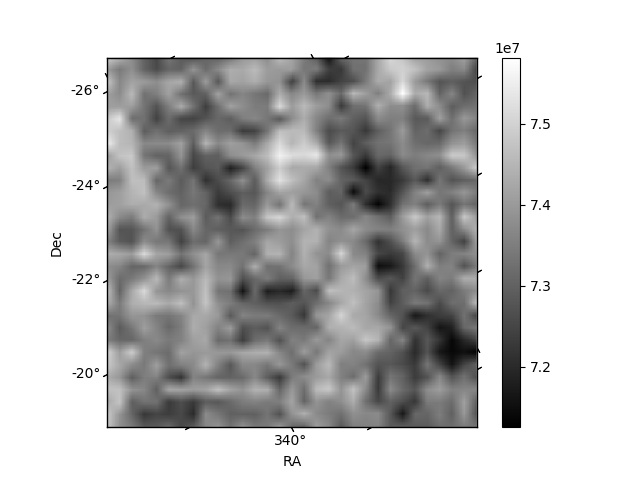
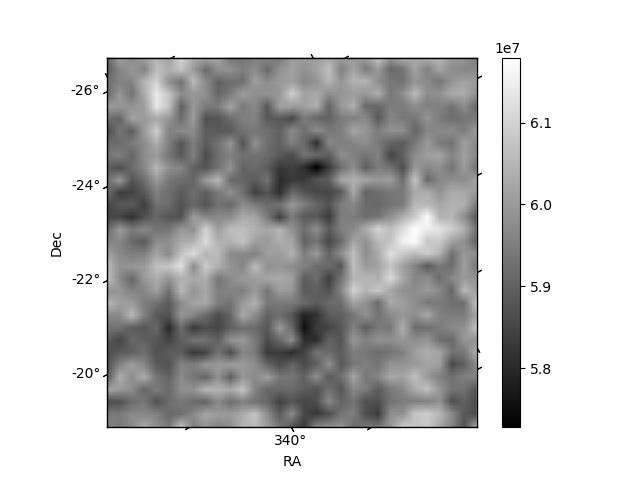
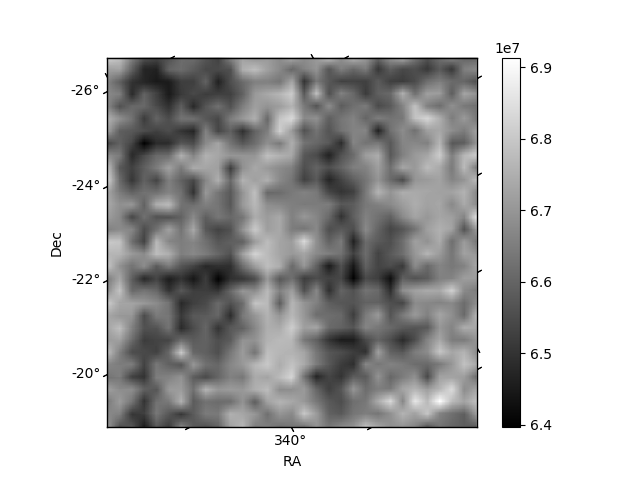
Histogram calculated using DETX and DETY for each event in the final _common_clean file
| Quadrant A | 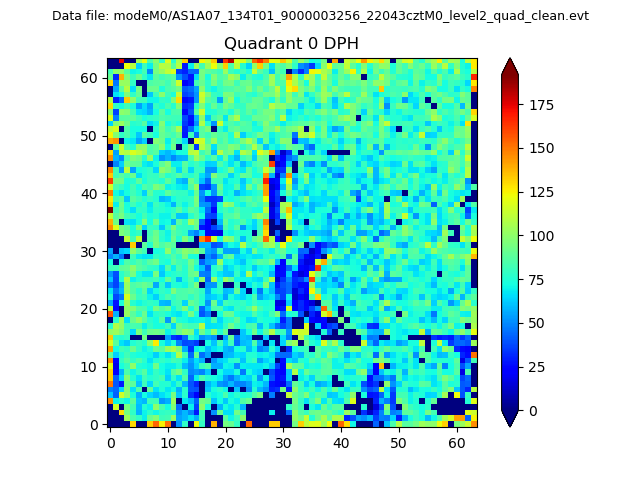 |
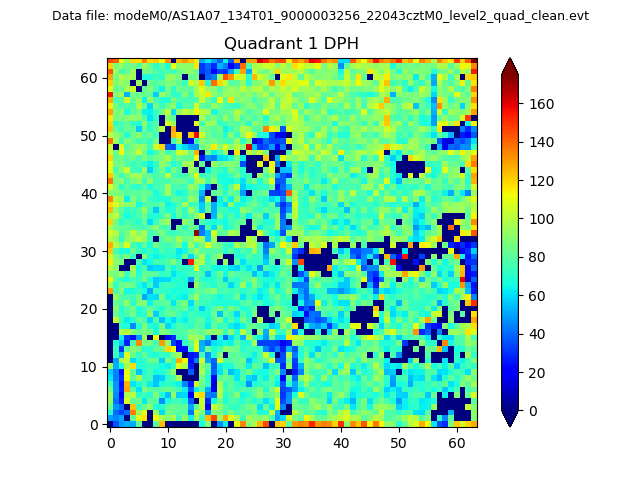 |
Quadrant B |
|---|---|---|---|
| Quadrant D | 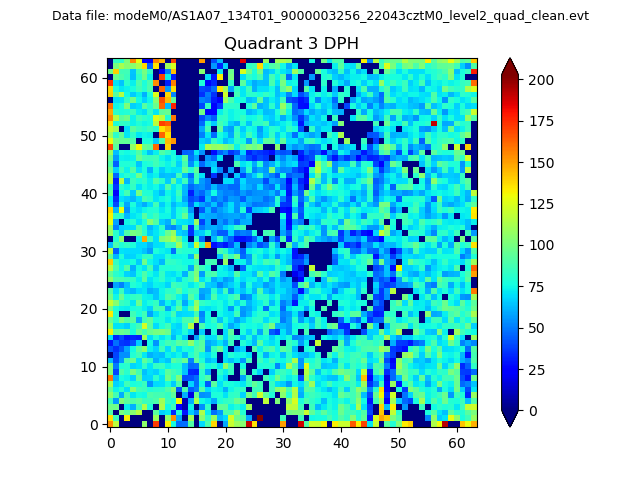 |
 |
Quadrant C |
| Plot type | Count rate plots | Images |
|---|---|---|
| Comparison with Poisson distribution Blue bars denote a histogram of data divided into 1 sec bins. Red curve is a Poisson curve with rate = median count rate of data. |
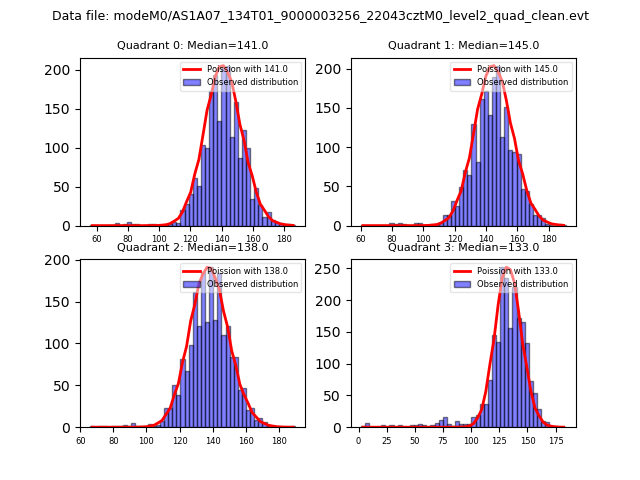 |
 |
| Quadrant-wise count rates Data is divided into 100 sec bins |
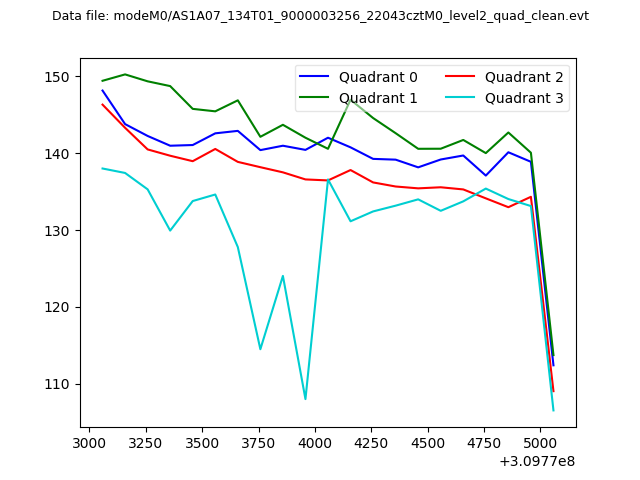 |
|
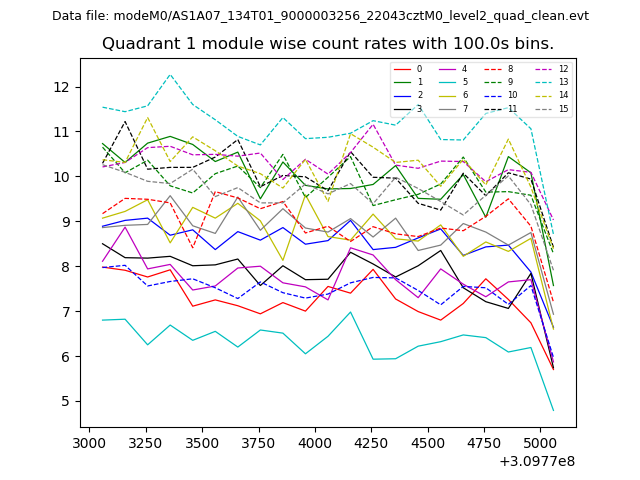
| Module-wise count rates for Quadrant A Data is divided into 100 sec bins |
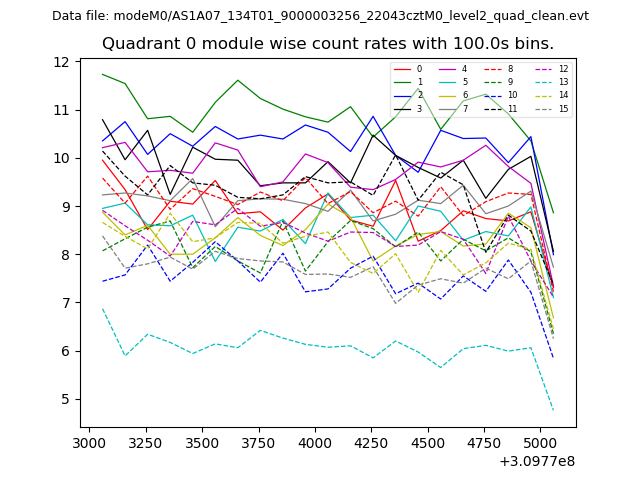 |
 |
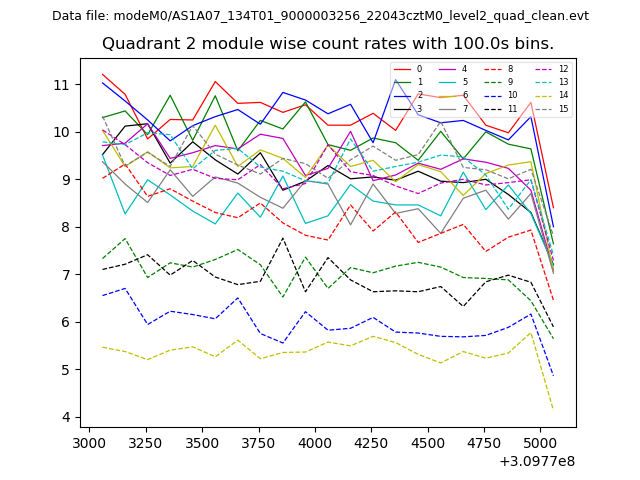
| Module-wise count rates for Quadrant B Data is divided into 100 sec bins |
 |
 |
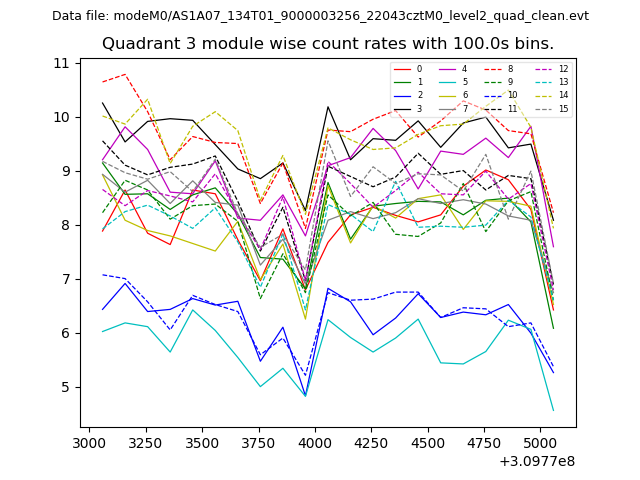
| Module-wise count rates for Quadrant C Data is divided into 100 sec bins |
 |
 |
| Module-wise count rates for Quadrant D Data is divided into 100 sec bins |
 |
 |
| Parameter | Plot |
|---|---|
| CZT HV Monitor | 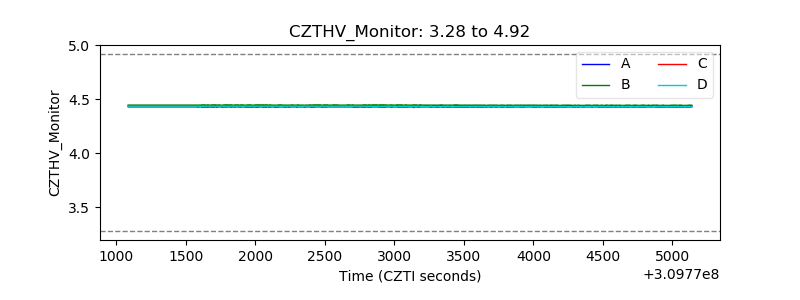 |
| D_VDD | 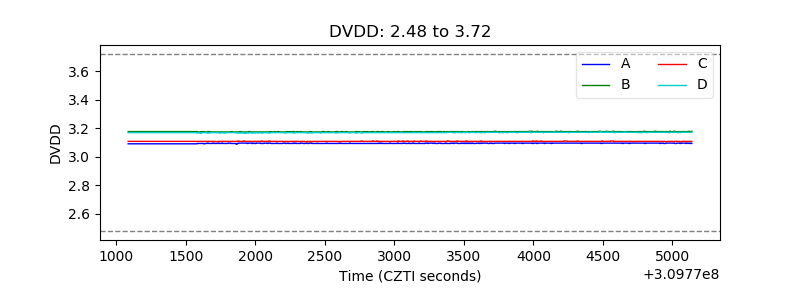 |
| Temperature 1 | 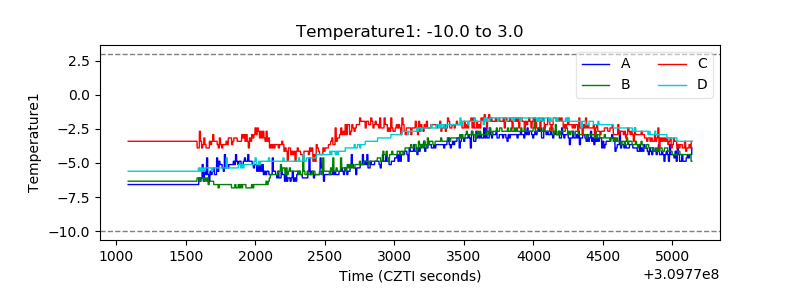 |
| Veto HV Monitor | 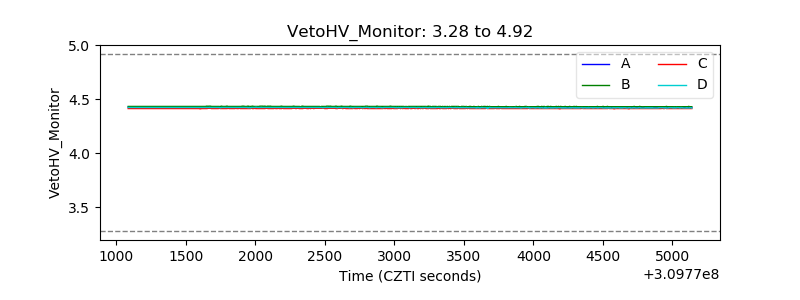 |
| Veto LLD | 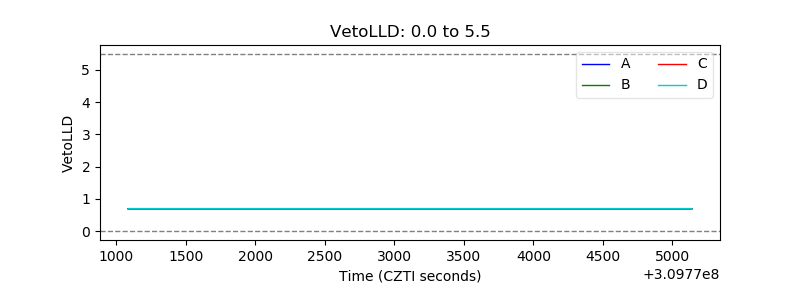 |
| Alpha Counter | 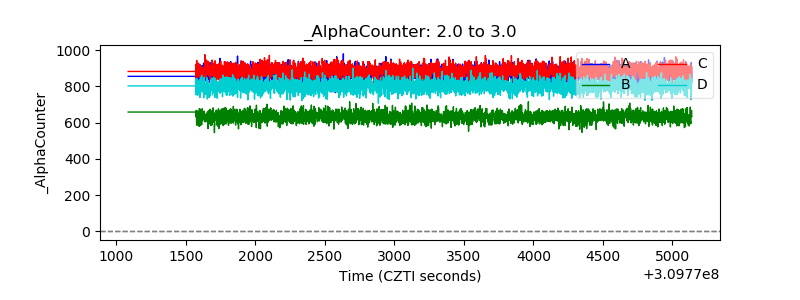 |
| _CPM_Rate | 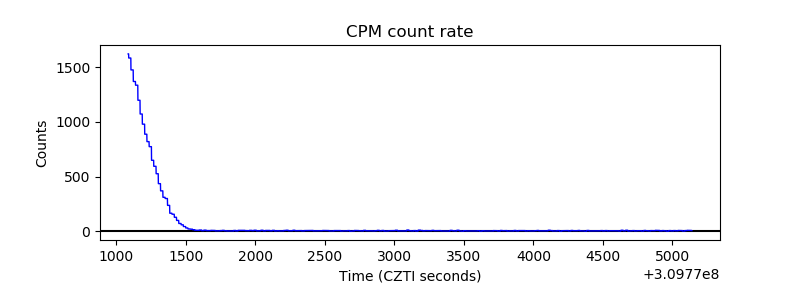 |
| CZT Counter | 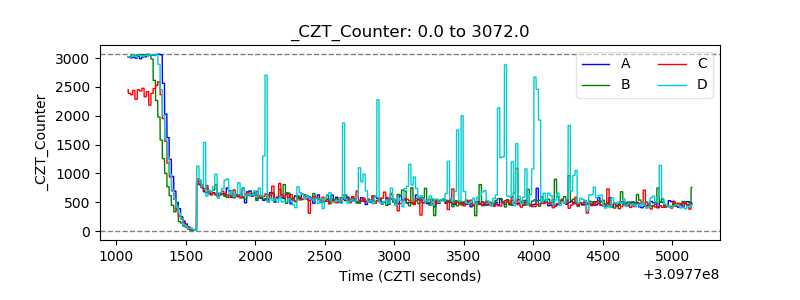 |
| +2.5 Volts monitor |  |
| +5 Volts monitor |  |
| _ROLL_ROT | 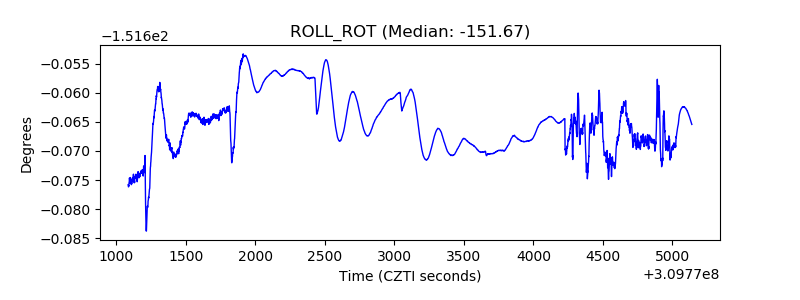 |
| _Roll_DEC | 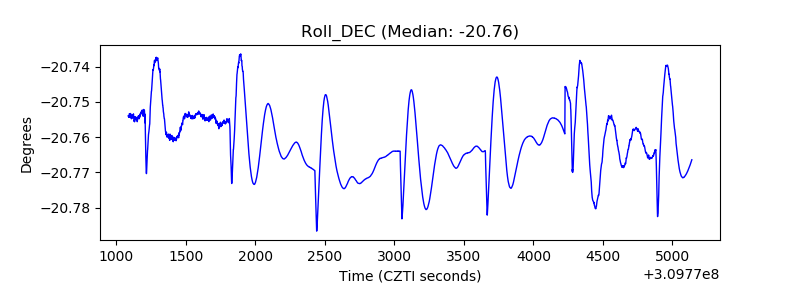 |
| _Roll_RA | 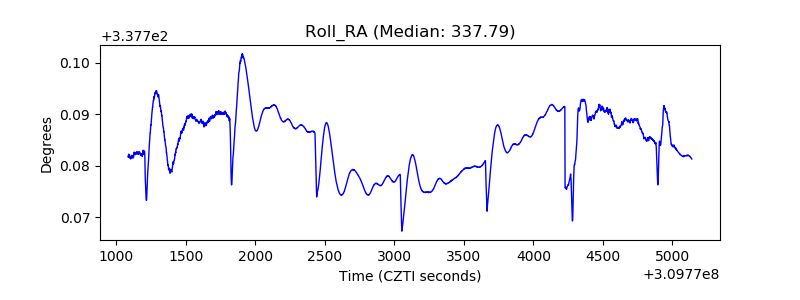 |
| Veto Counter | 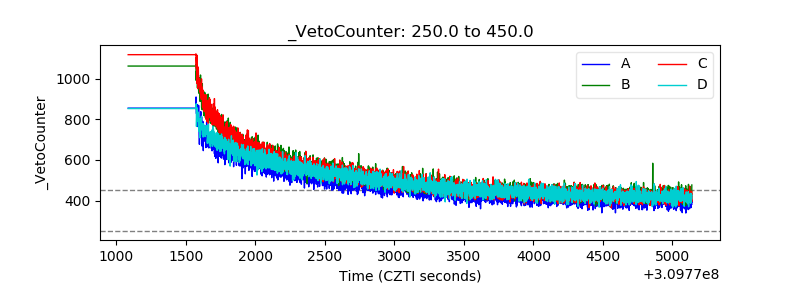 |