| Param | Original file | Final file |
|---|---|---|
| Filename | modeM0/AS1A07_007T05_9000003274_22098cztM0_level2.evt | modeM0/AS1A07_007T05_9000003274_22098cztM0_level2_quad_clean.evt |
| Size (bytes) | 462,139,200 | 82,376,640 |
| Size | 440.7 MB | 78.6 MB |
| Events in quadrant A | 3,108,538 | 520,262 |
| Events in quadrant B | 3,214,172 | 532,133 |
| Events in quadrant C | 3,141,823 | 504,122 |
| Events in quadrant D | 4,084,550 | 479,376 |
| Mode SS | |||
|---|---|---|---|
| Quadrant | BADHDUFLAG | Total packets | Discarded packets |
| A | 0 | 132 | 0 |
| B | 0 | 132 | 0 |
| C | 0 | 132 | 0 |
| D | 0 | 132 | 0 |
| Mode M9 | |||
|---|---|---|---|
| Quadrant | BADHDUFLAG | Total packets | Discarded packets |
| A | 0 | 15 | 0 |
| B | 0 | 16 | 0 |
| C | 0 | 16 | 0 |
| D | 0 | 16 | 0 |
| Mode M0 | |||
|---|---|---|---|
| Quadrant | BADHDUFLAG | Total packets | Discarded packets |
| A | 0 | 13394 | 2 |
| B | 0 | 13631 | 2 |
| C | 0 | 13456 | 2 |
| D | 0 | 16688 | 2 |
| Quadrant | Total seconds | Saturated seconds | Saturation percentage |
|---|---|---|---|
| A | 6580 | 6 | 0.091185% |
| B | 6580 | 21 | 0.319149% |
| C | 6579 | 50 | 0.759994% |
| D | 6579 | 239 | 3.632771% |
Noise dominated data is calculated using 1-second bins in cleaned event files. If a bin has >2000 counts, and if more than 50% of those come from <1% of pixels, then it is considered to be noise-dominated and hence unusable.
| Quadrant | # 1 sec bins | Bins with >0 counts | Bins with >2000 counts | High rate bins dominated by noise | Noise dominated (total time) | Noise dominated (detector-on time) | Marked lightcurve |
|---|---|---|---|---|---|---|---|
| A | 7650 | 6581 | 0 | 0 | 0.00% | 0.00% | 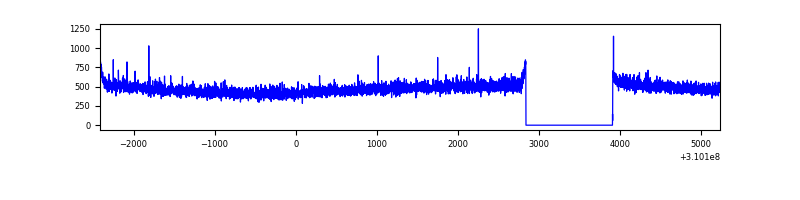 |
| B | 7650 | 6581 | 0 | 0 | 0.00% | 0.00% | 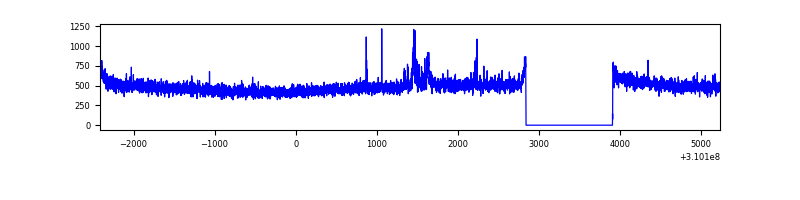 |
| C | 7649 | 6580 | 0 | 0 | 0.00% | 0.00% | 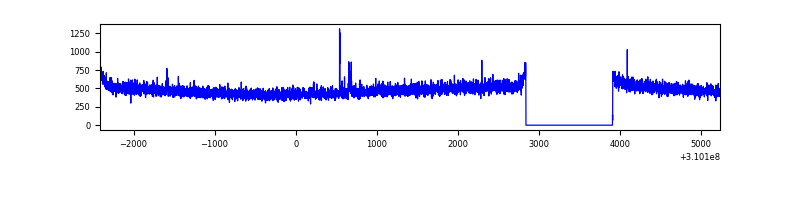 |
| D | 7649 | 6580 | 222 | 222 | 2.90% | 3.37% | 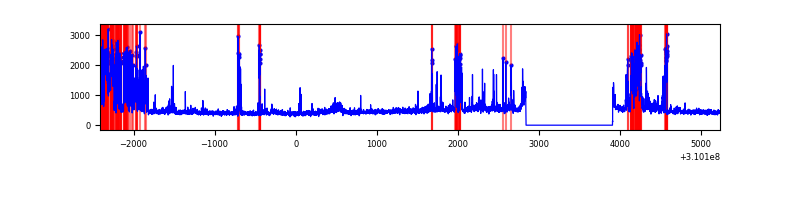 |
Top three noisy pixels from each quadrant. If the there are fewer than three noisy pixels in the level2.evt file, extra rows are filled as -1
| Pixel properties | Quadrant properties | ||||||
|---|---|---|---|---|---|---|---|
| Quadrant | DetID | PixID | Counts | Sigma | Mean | Median | Sigma |
| A | 5 | 16 | 11028 | 63.57 | 802 | 784 | 161.1 |
| A | 13 | 254 | 10499 | 60.29 | 802 | 784 | 161.1 |
| A | 0 | 226 | 6933 | 38.16 | 802 | 784 | 161.1 |
| B | 0 | 197 | 47587 | 307.22 | 803 | 782 | 152.3 |
| B | 12 | 111 | 18756 | 117.98 | 803 | 782 | 152.3 |
| B | 11 | 111 | 16582 | 103.71 | 803 | 782 | 152.3 |
| C | 14 | 238 | 120949 | 666.43 | 770 | 778 | 180.3 |
| C | 10 | 22 | 14635 | 76.85 | 770 | 778 | 180.3 |
| C | 13 | 61 | 5380 | 25.52 | 770 | 778 | 180.3 |
| D | 1 | 52 | 580029 | 3119.77 | 766 | 744 | 185.7 |
| D | 2 | 136 | 226123 | 1213.79 | 766 | 744 | 185.7 |
| D | 13 | 172 | 208785 | 1120.42 | 766 | 744 | 185.7 |
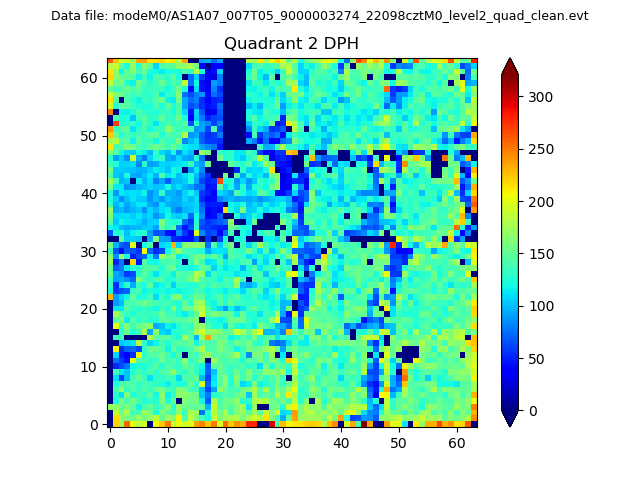
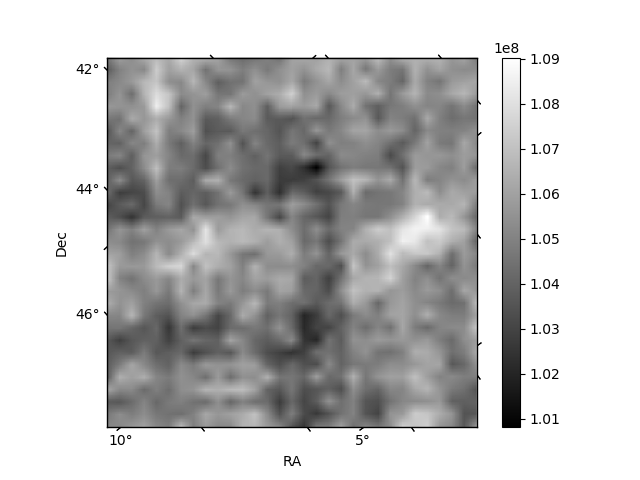
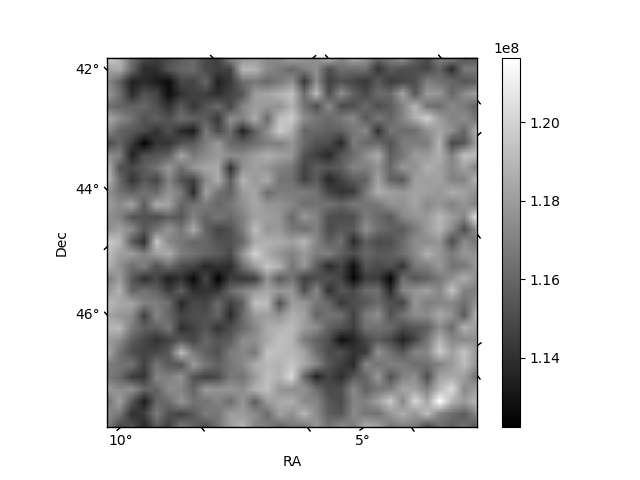
Histogram calculated using DETX and DETY for each event in the final _common_clean file
| Quadrant A | 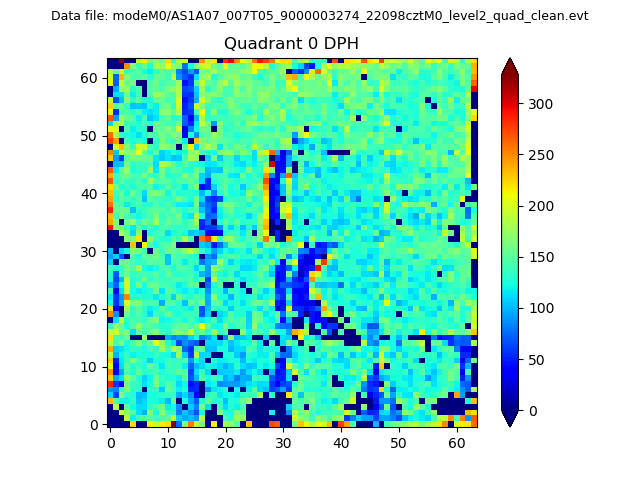 |
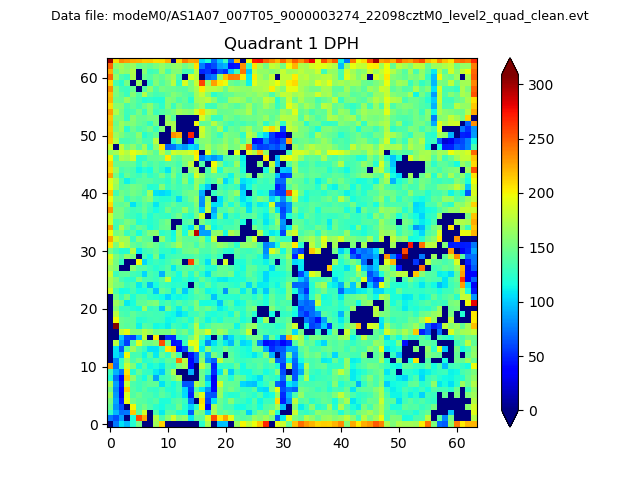 |
Quadrant B |
|---|---|---|---|
| Quadrant D | 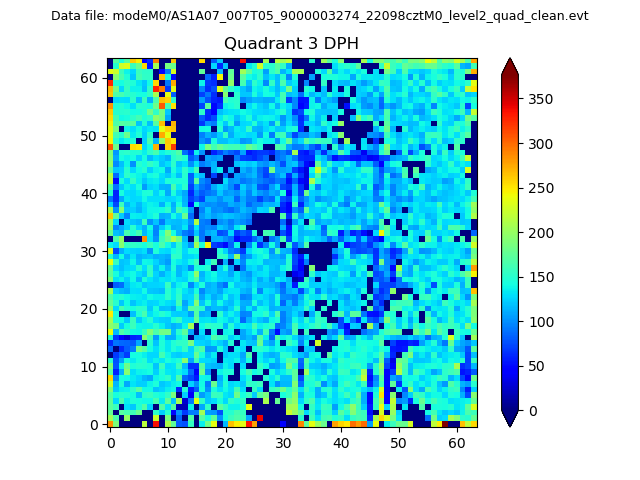 |
 |
Quadrant C |
| Plot type | Count rate plots | Images |
|---|---|---|
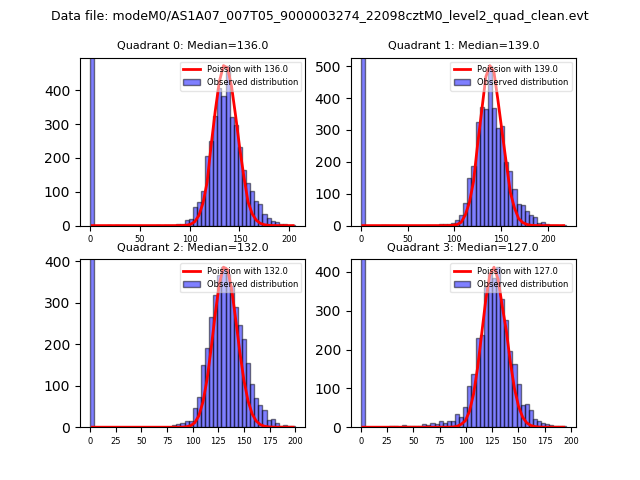
| Comparison with Poisson distribution Blue bars denote a histogram of data divided into 1 sec bins. Red curve is a Poisson curve with rate = median count rate of data. |
 |
 |
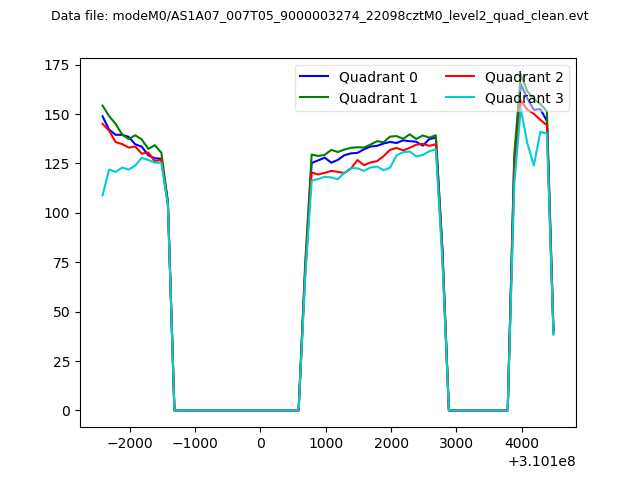
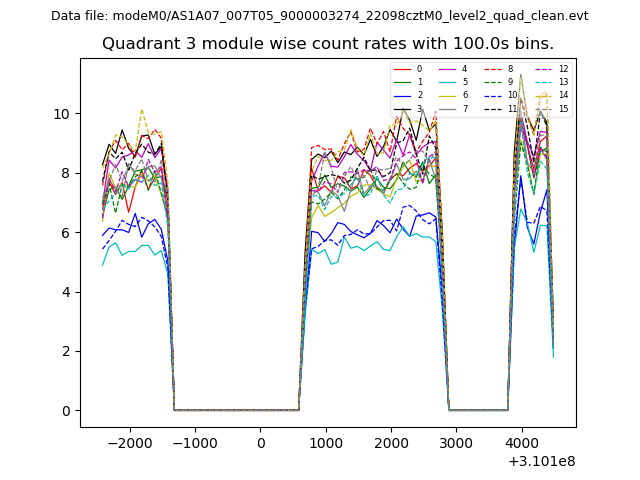
| Quadrant-wise count rates Data is divided into 100 sec bins |
 |
|
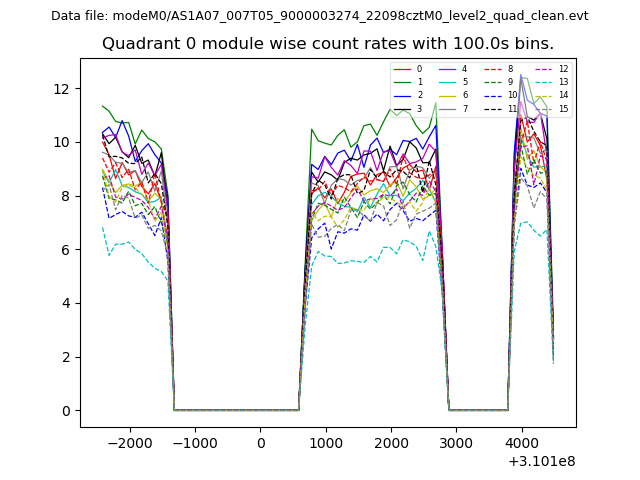
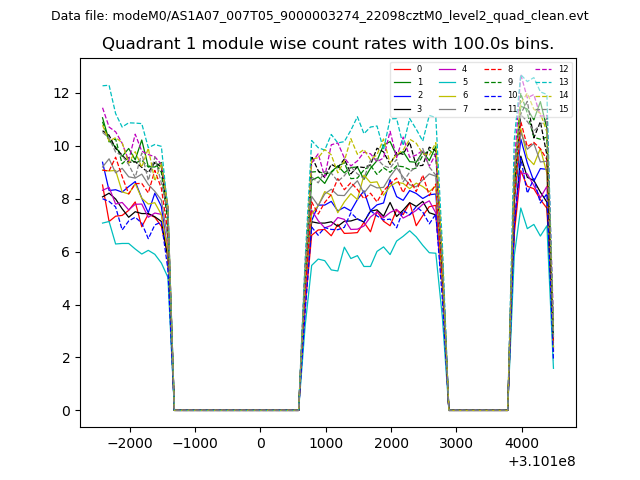
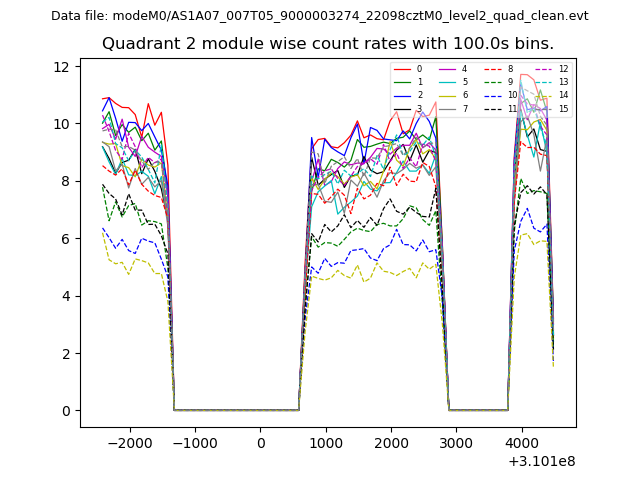
| Module-wise count rates for Quadrant A Data is divided into 100 sec bins |
 |
 |
| Module-wise count rates for Quadrant B Data is divided into 100 sec bins |
 |
 |
| Module-wise count rates for Quadrant C Data is divided into 100 sec bins |
 |
 |
| Module-wise count rates for Quadrant D Data is divided into 100 sec bins |
 |
 |
| Parameter | Plot |
|---|---|
| CZT HV Monitor | 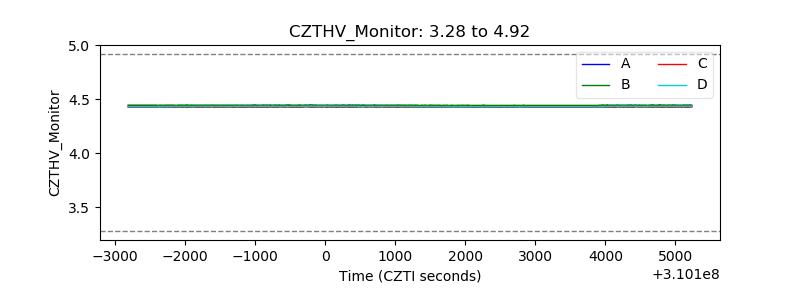 |
| D_VDD | 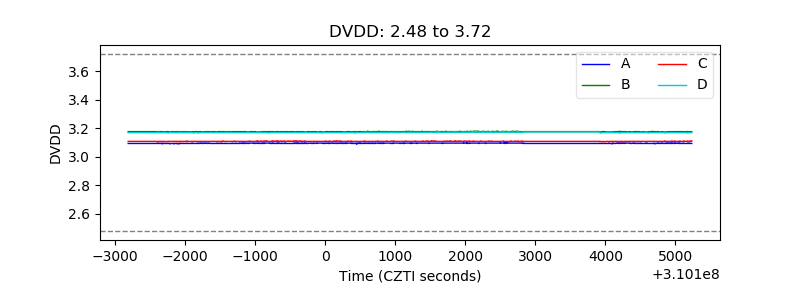 |
| Temperature 1 | 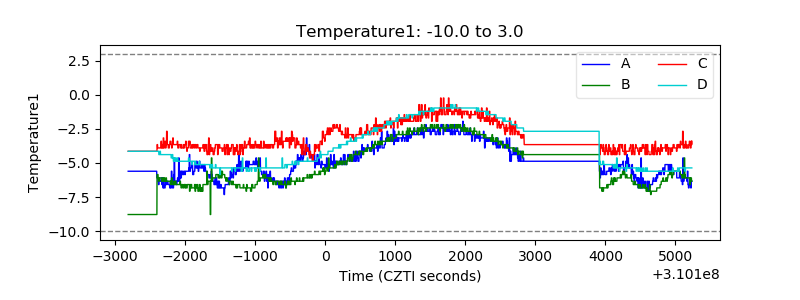 |
| Veto HV Monitor |  |
| Veto LLD | 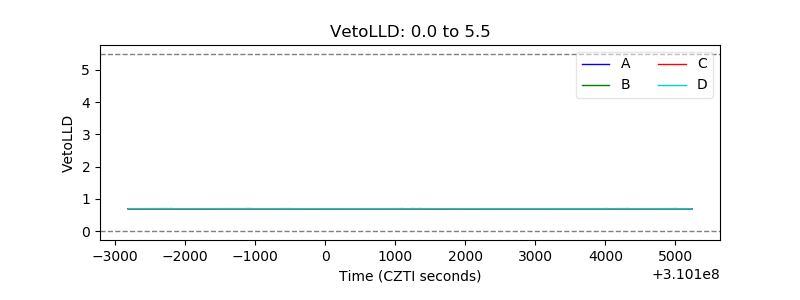 |
| Alpha Counter | 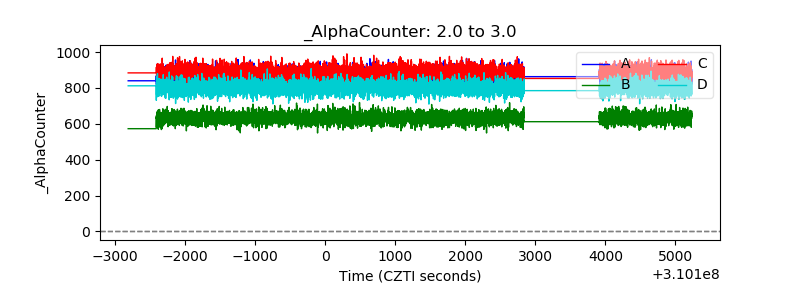 |
| _CPM_Rate | 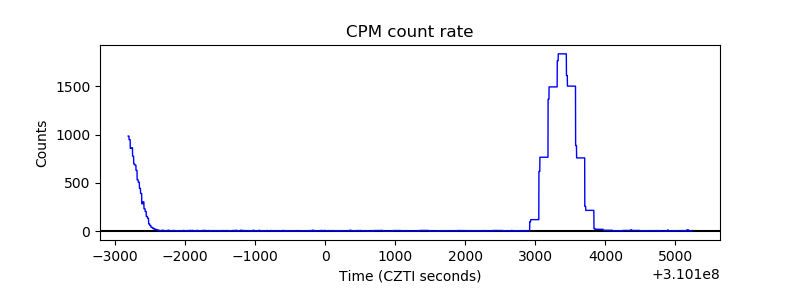 |
| CZT Counter | 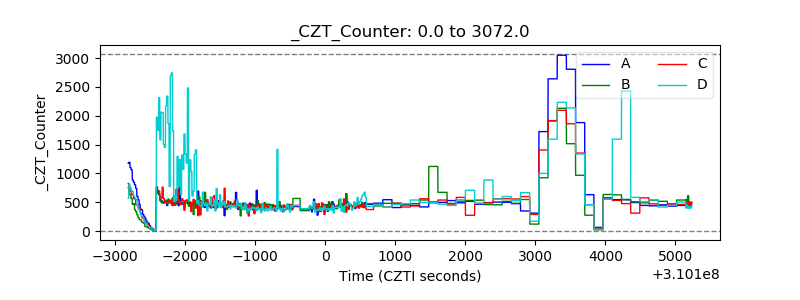 |
| +2.5 Volts monitor |  |
| +5 Volts monitor |  |
| _ROLL_ROT | 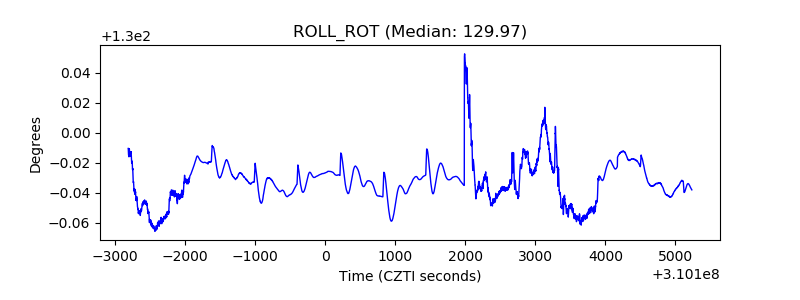 |
| _Roll_DEC |  |
| _Roll_RA | 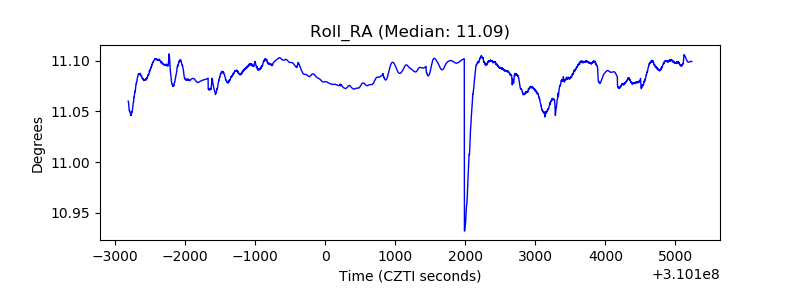 |
| Veto Counter | 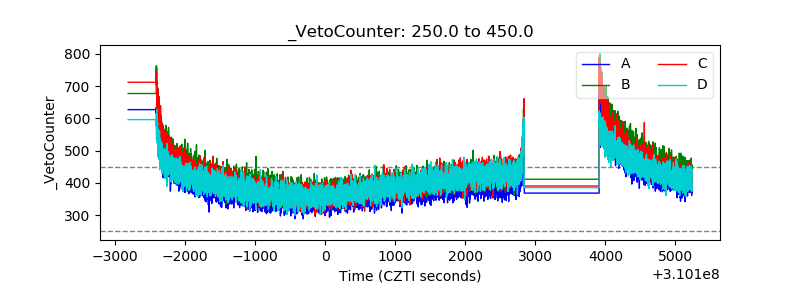 |