| Param | Original file | Final file |
|---|---|---|
| Filename | modeM0/AS1A07_054T01_9000003286_22217cztM0_level2.evt | modeM0/AS1A07_054T01_9000003286_22217cztM0_level2_quad_clean.evt |
| Size (bytes) | 407,880,000 | 129,764,160 |
| Size | 389.0 MB | 123.8 MB |
| Events in quadrant A | 2,963,942 | 894,870 |
| Events in quadrant B | 3,013,799 | 910,915 |
| Events in quadrant C | 2,964,370 | 858,465 |
| Events in quadrant D | 2,992,119 | 836,791 |
| Mode M0 | |||
|---|---|---|---|
| Quadrant | BADHDUFLAG | Total packets | Discarded packets |
| A | 0 | 12689 | 1 |
| B | 0 | 12803 | 1 |
| C | 0 | 12745 | 1 |
| D | 0 | 12915 | 1 |
| Mode M9 | |||
|---|---|---|---|
| Quadrant | BADHDUFLAG | Total packets | Discarded packets |
| A | 0 | 14 | 0 |
| B | 0 | 14 | 0 |
| C | 0 | 14 | 0 |
| D | 0 | 14 | 0 |
| Mode SS | |||
|---|---|---|---|
| Quadrant | BADHDUFLAG | Total packets | Discarded packets |
| A | 0 | 122 | 0 |
| B | 0 | 122 | 0 |
| C | 0 | 122 | 0 |
| D | 0 | 122 | 0 |
| Quadrant | Total seconds | Saturated seconds | Saturation percentage |
|---|---|---|---|
| A | 6162 | 4 | 0.064914% |
| B | 6162 | 16 | 0.259656% |
| C | 6162 | 37 | 0.600454% |
| D | 6163 | 11 | 0.178485% |
Noise dominated data is calculated using 1-second bins in cleaned event files. If a bin has >2000 counts, and if more than 50% of those come from <1% of pixels, then it is considered to be noise-dominated and hence unusable.
| Quadrant | # 1 sec bins | Bins with >0 counts | Bins with >2000 counts | High rate bins dominated by noise | Noise dominated (total time) | Noise dominated (detector-on time) | Marked lightcurve |
|---|---|---|---|---|---|---|---|
| A | 7477 | 6163 | 0 | 0 | 0.00% | 0.00% | 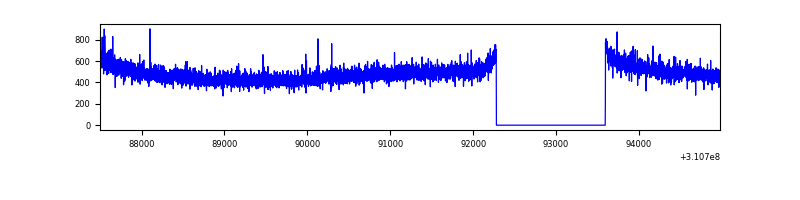 |
| B | 7477 | 6163 | 0 | 0 | 0.00% | 0.00% | 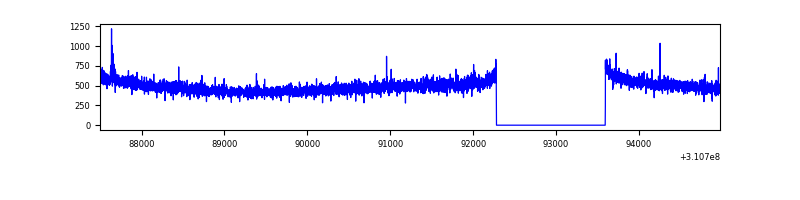 |
| C | 7477 | 6163 | 0 | 0 | 0.00% | 0.00% | 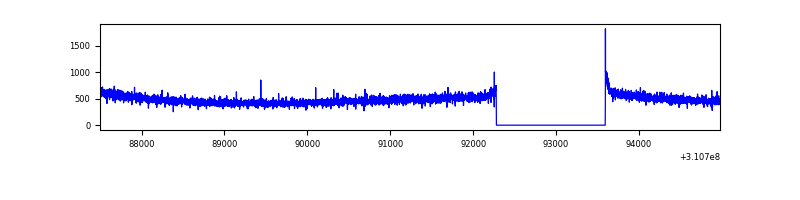 |
| D | 7478 | 6164 | 5 | 5 | 0.07% | 0.08% | 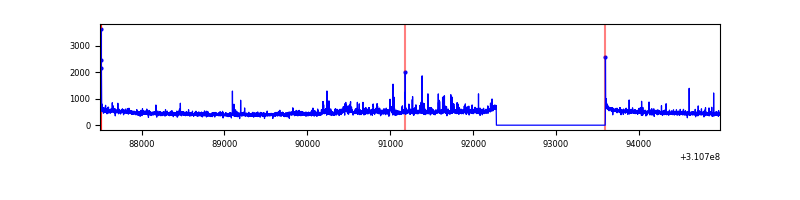 |
Top three noisy pixels from each quadrant. If the there are fewer than three noisy pixels in the level2.evt file, extra rows are filled as -1
| Pixel properties | Quadrant properties | ||||||
|---|---|---|---|---|---|---|---|
| Quadrant | DetID | PixID | Counts | Sigma | Mean | Median | Sigma |
| A | 13 | 254 | 9559 | 58.16 | 768 | 755 | 151.4 |
| A | 0 | 226 | 6756 | 39.64 | 768 | 755 | 151.4 |
| A | 2 | 79 | 6389 | 37.22 | 768 | 755 | 151.4 |
| B | 12 | 111 | 16864 | 114.87 | 765 | 750 | 140.3 |
| B | 11 | 111 | 14617 | 98.85 | 765 | 750 | 140.3 |
| B | 14 | 111 | 13087 | 87.95 | 765 | 750 | 140.3 |
| C | 14 | 238 | 118761 | 706.06 | 728 | 734 | 167.2 |
| C | 0 | 10 | 8761 | 48.02 | 728 | 734 | 167.2 |
| C | 13 | 61 | 5083 | 26.02 | 728 | 734 | 167.2 |
| D | 1 | 52 | 156028 | 901.09 | 731 | 710 | 172.4 |
| D | 2 | 136 | 24048 | 135.4 | 731 | 710 | 172.4 |
| D | 2 | 234 | 22999 | 129.31 | 731 | 710 | 172.4 |
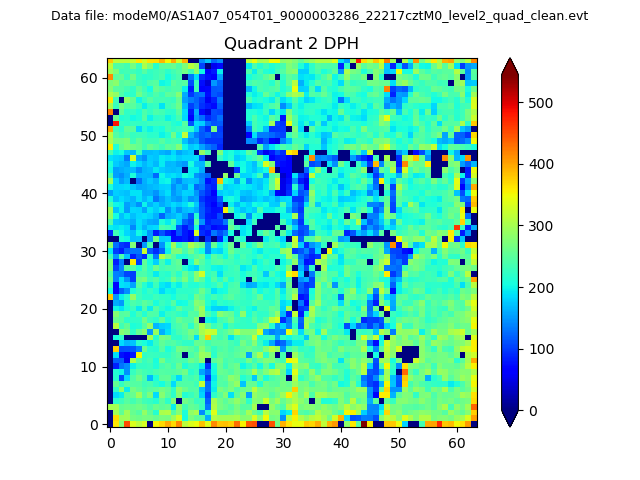
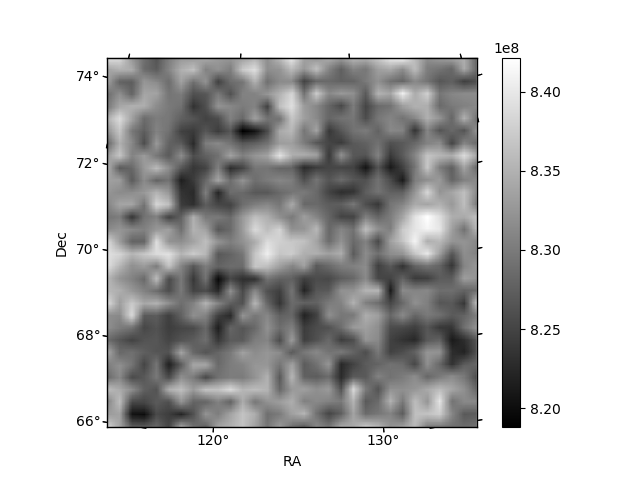
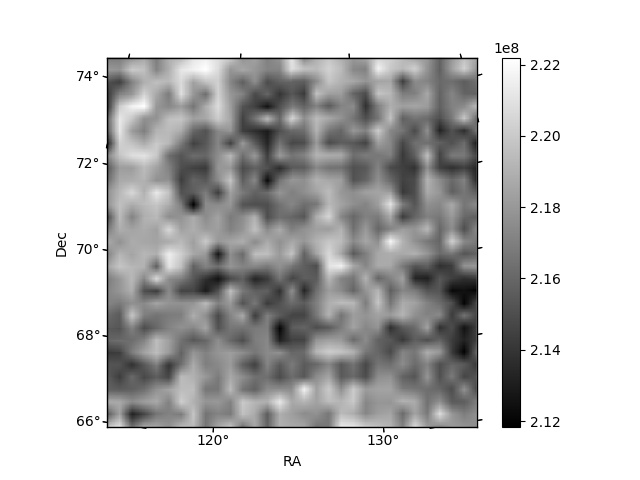
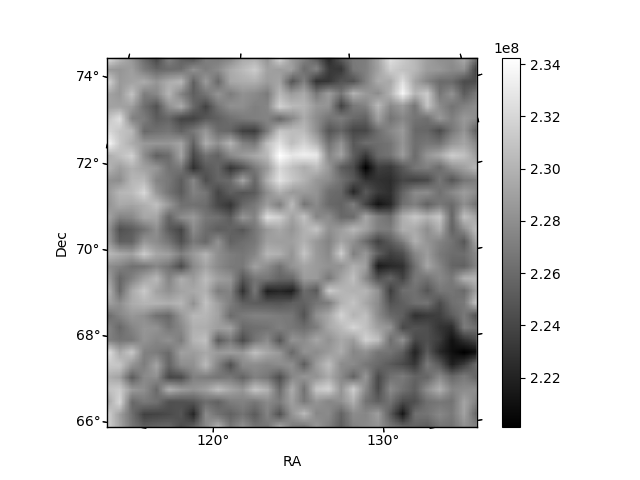
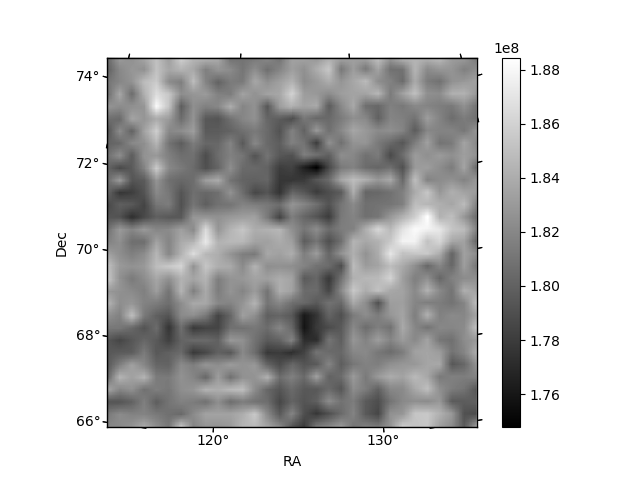
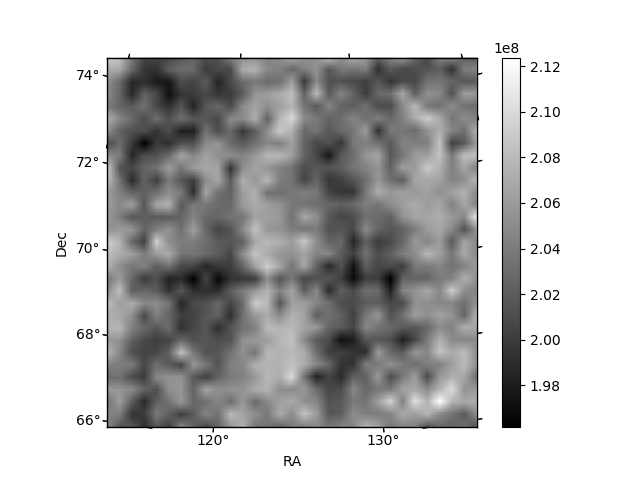
Histogram calculated using DETX and DETY for each event in the final _common_clean file
| Quadrant A | 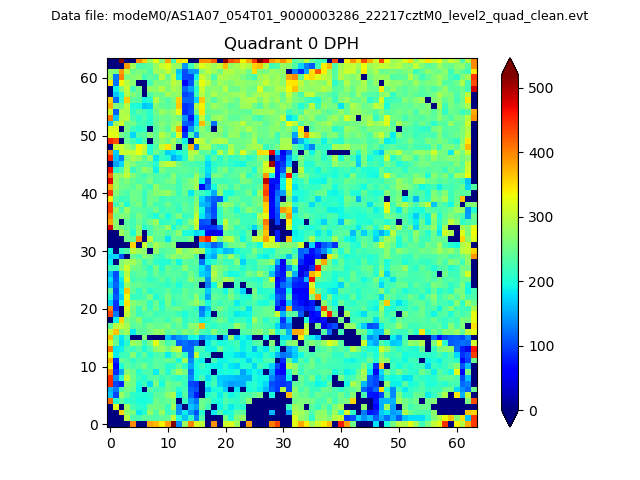 |
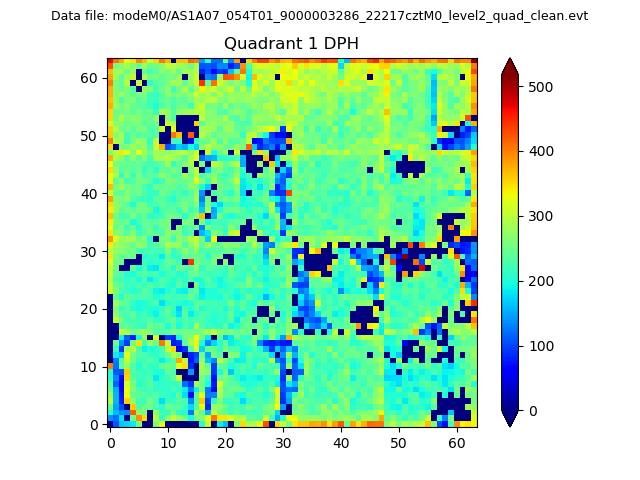 |
Quadrant B |
|---|---|---|---|
| Quadrant D | 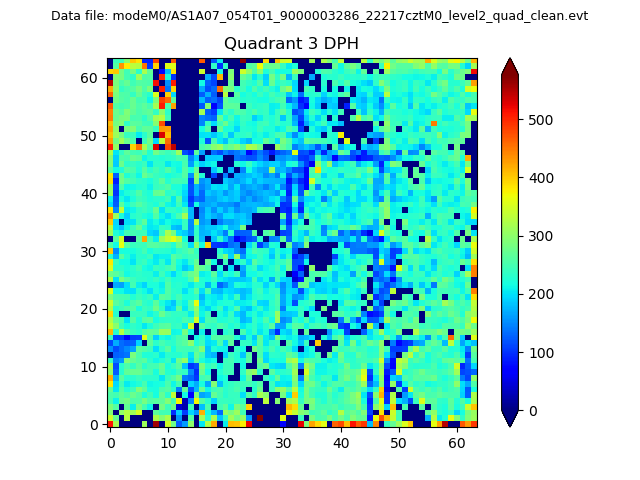 |
 |
Quadrant C |
| Plot type | Count rate plots | Images |
|---|---|---|
| Comparison with Poisson distribution Blue bars denote a histogram of data divided into 1 sec bins. Red curve is a Poisson curve with rate = median count rate of data. |
 |
 |
| Quadrant-wise count rates Data is divided into 100 sec bins |
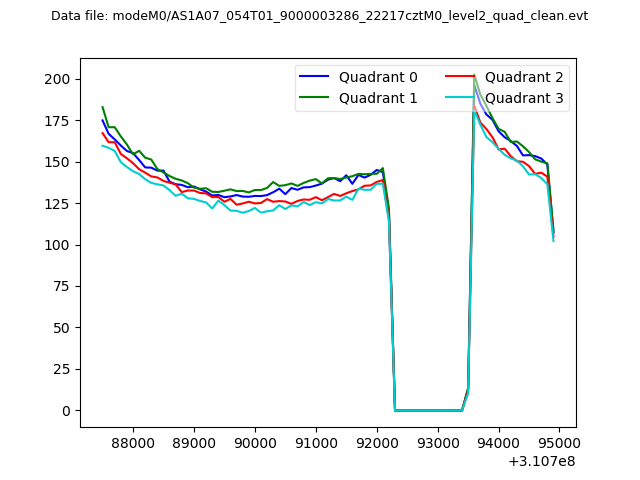 |
|
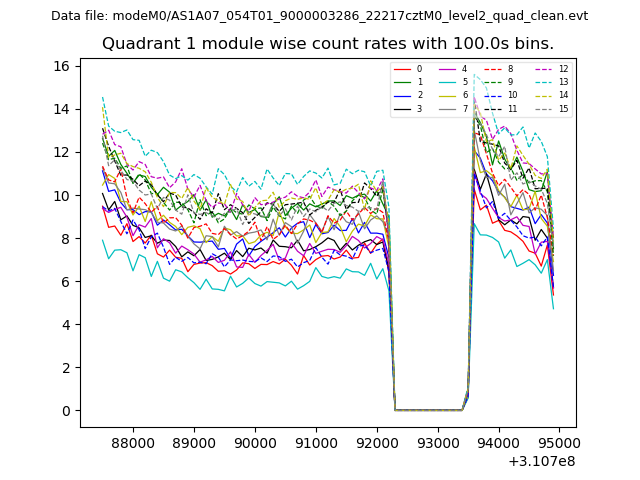
| Module-wise count rates for Quadrant A Data is divided into 100 sec bins |
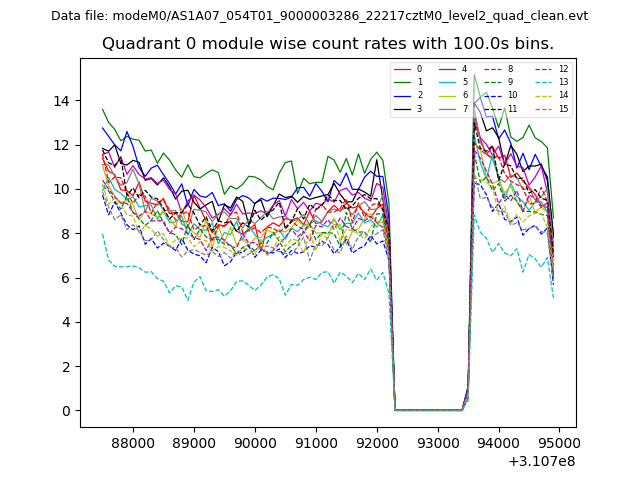 |
 |
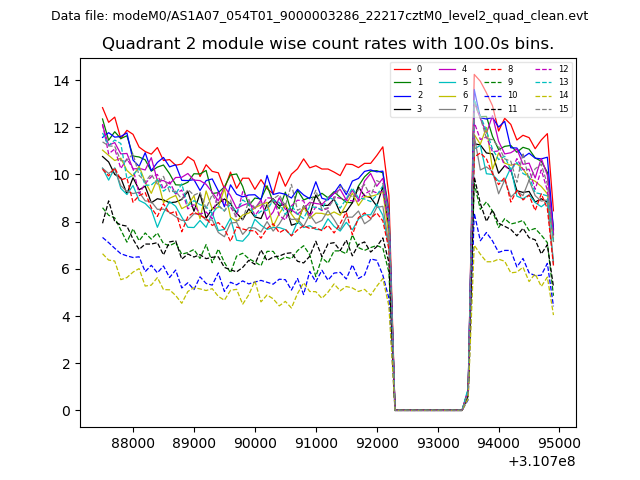
| Module-wise count rates for Quadrant B Data is divided into 100 sec bins |
 |
 |
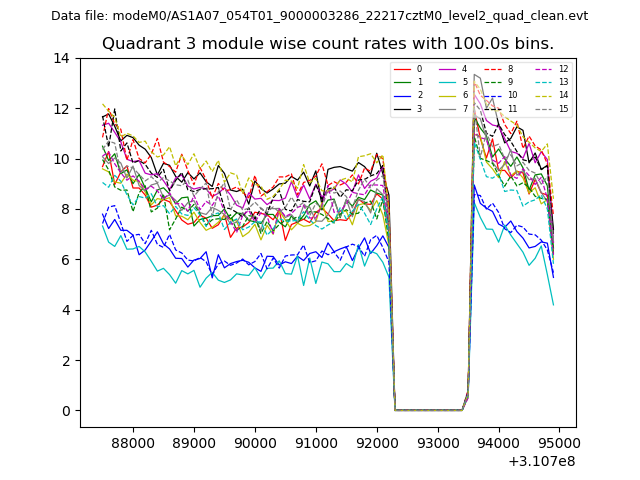
| Module-wise count rates for Quadrant C Data is divided into 100 sec bins |
 |
 |
| Module-wise count rates for Quadrant D Data is divided into 100 sec bins |
 |
 |
| Parameter | Plot |
|---|---|
| CZT HV Monitor | 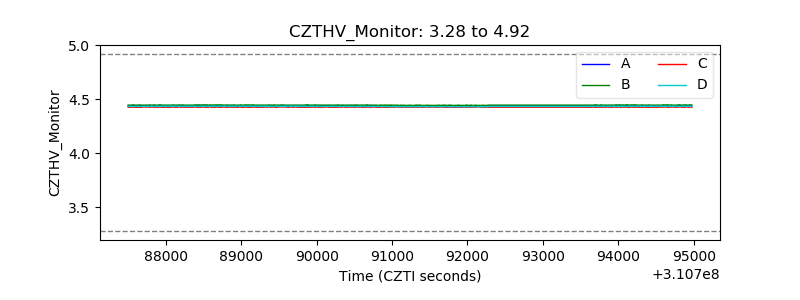 |
| D_VDD | 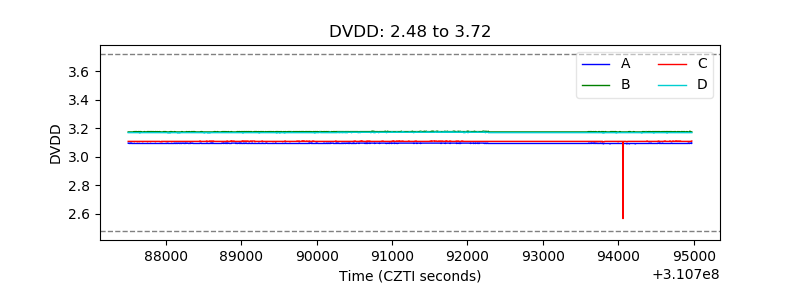 |
| Temperature 1 | 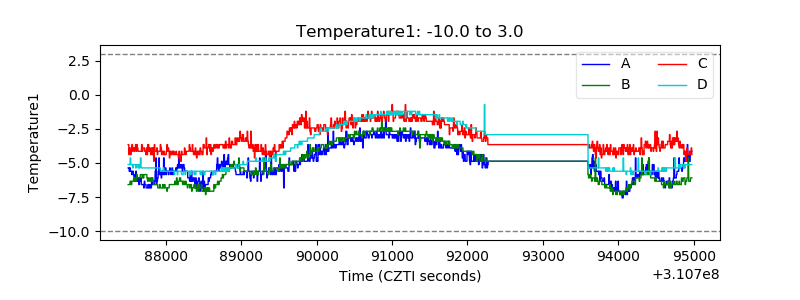 |
| Veto HV Monitor | 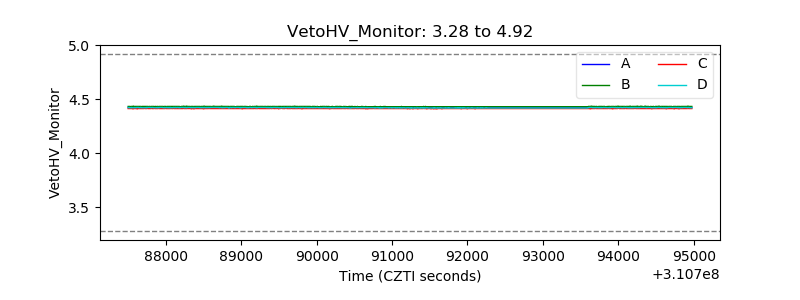 |
| Veto LLD | 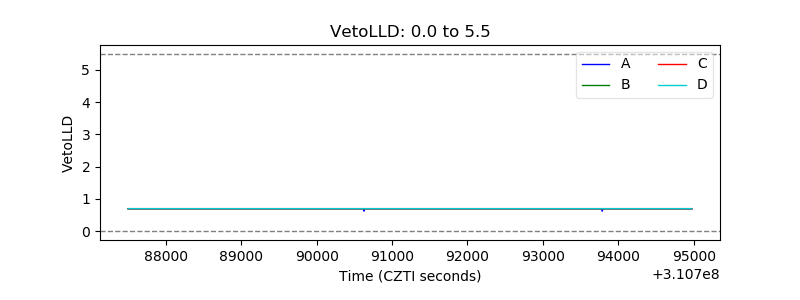 |
| Alpha Counter | 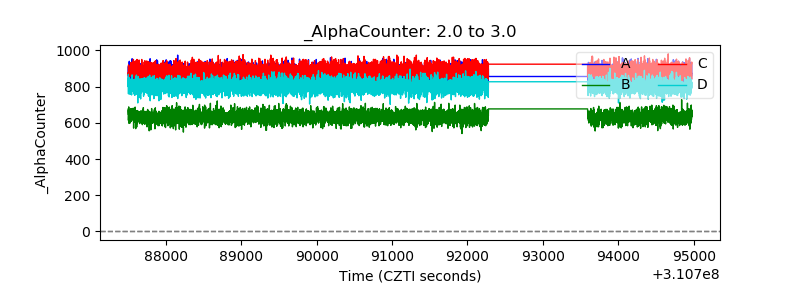 |
| _CPM_Rate | 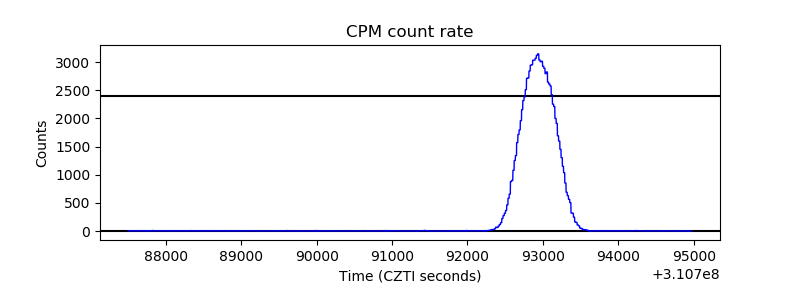 |
| CZT Counter | 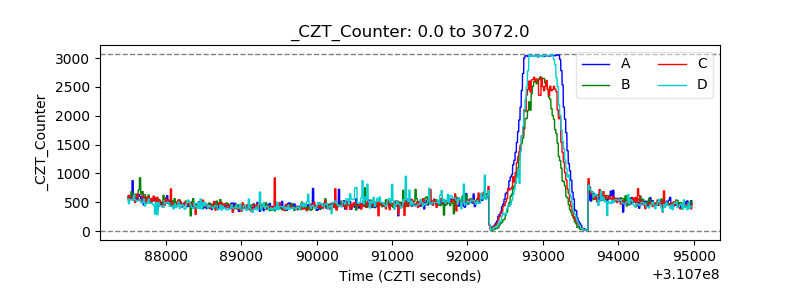 |
| +2.5 Volts monitor |  |
| +5 Volts monitor |  |
| _ROLL_ROT | 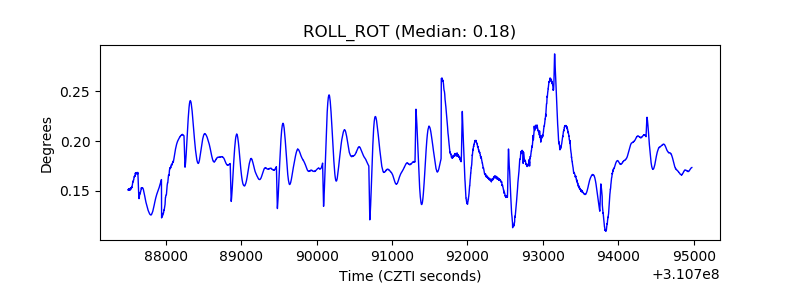 |
| _Roll_DEC | 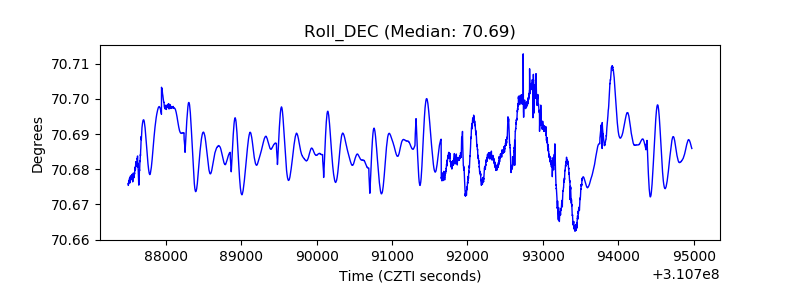 |
| _Roll_RA | 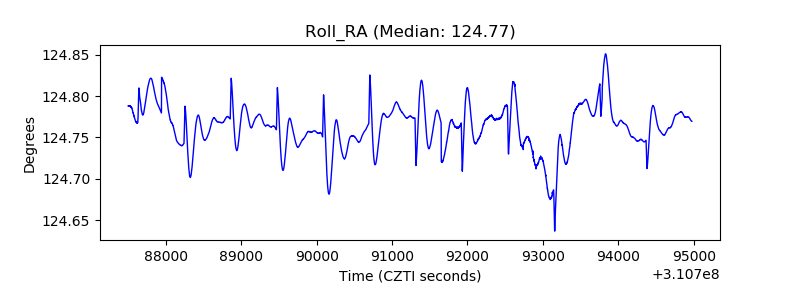 |
| Veto Counter | 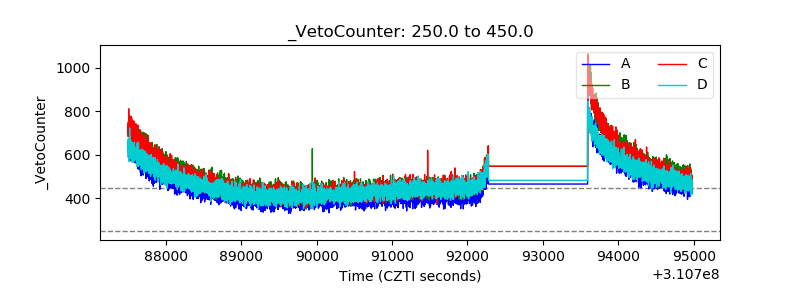 |