| Param | Original file | Final file |
|---|---|---|
| Filename | modeM0/AS1A07_018T08_9000003296_22281cztM0_level2.evt | modeM0/AS1A07_018T08_9000003296_22281cztM0_level2_quad_clean.evt |
| Size (bytes) | 511,845,120 | 95,374,080 |
| Size | 488.1 MB | 91.0 MB |
| Events in quadrant A | 3,379,506 | 615,969 |
| Events in quadrant B | 3,486,810 | 624,893 |
| Events in quadrant C | 3,416,154 | 593,677 |
| Events in quadrant D | 4,743,436 | 566,339 |
| Mode M0 | |||
|---|---|---|---|
| Quadrant | BADHDUFLAG | Total packets | Discarded packets |
| A | 0 | 14631 | 2 |
| B | 0 | 14813 | 2 |
| C | 0 | 14728 | 2 |
| D | 0 | 18645 | 2 |
| Mode SS | |||
|---|---|---|---|
| Quadrant | BADHDUFLAG | Total packets | Discarded packets |
| A | 0 | 140 | 0 |
| B | 0 | 140 | 0 |
| C | 0 | 140 | 0 |
| D | 0 | 140 | 0 |
| Quadrant | Total seconds | Saturated seconds | Saturation percentage |
|---|---|---|---|
| A | 6996 | 170 | 2.429960% |
| B | 6997 | 214 | 3.058454% |
| C | 6997 | 181 | 2.586823% |
| D | 6997 | 492 | 7.031585% |
Noise dominated data is calculated using 1-second bins in cleaned event files. If a bin has >2000 counts, and if more than 50% of those come from <1% of pixels, then it is considered to be noise-dominated and hence unusable.
| Quadrant | # 1 sec bins | Bins with >0 counts | Bins with >2000 counts | High rate bins dominated by noise | Noise dominated (total time) | Noise dominated (detector-on time) | Marked lightcurve |
|---|---|---|---|---|---|---|---|
| A | 7041 | 6998 | 0 | 0 | 0.00% | 0.00% |  |
| B | 7042 | 6999 | 0 | 0 | 0.00% | 0.00% |  |
| C | 7042 | 6999 | 0 | 0 | 0.00% | 0.00% |  |
| D | 7042 | 6997 | 320 | 320 | 4.54% | 4.57% |  |
Top three noisy pixels from each quadrant. If the there are fewer than three noisy pixels in the level2.evt file, extra rows are filled as -1
| Pixel properties | Quadrant properties | ||||||
|---|---|---|---|---|---|---|---|
| Quadrant | DetID | PixID | Counts | Sigma | Mean | Median | Sigma |
| A | 13 | 254 | 10400 | 53.01 | 876 | 854 | 180.1 |
| A | 3 | 137 | 7683 | 37.92 | 876 | 854 | 180.1 |
| A | 0 | 226 | 7549 | 37.18 | 876 | 854 | 180.1 |
| B | 4 | 171 | 33375 | 193.28 | 867 | 843 | 168.3 |
| B | 0 | 190 | 26597 | 153.01 | 867 | 843 | 168.3 |
| B | 12 | 111 | 20762 | 118.34 | 867 | 843 | 168.3 |
| C | 14 | 238 | 131045 | 660.23 | 832 | 838 | 197.2 |
| C | 10 | 22 | 42779 | 212.67 | 832 | 838 | 197.2 |
| C | 13 | 61 | 5965 | 26.0 | 832 | 838 | 197.2 |
| D | 1 | 52 | 1346909 | 6865.59 | 801 | 775 | 196.1 |
| D | 12 | 235 | 146898 | 745.26 | 801 | 775 | 196.1 |
| D | 12 | 227 | 73882 | 372.86 | 801 | 775 | 196.1 |
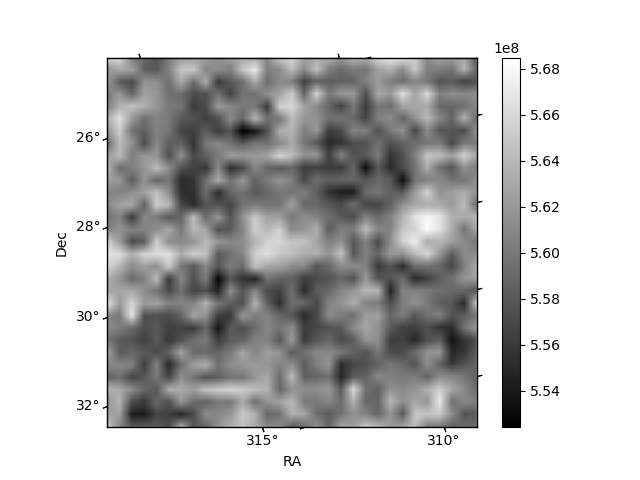
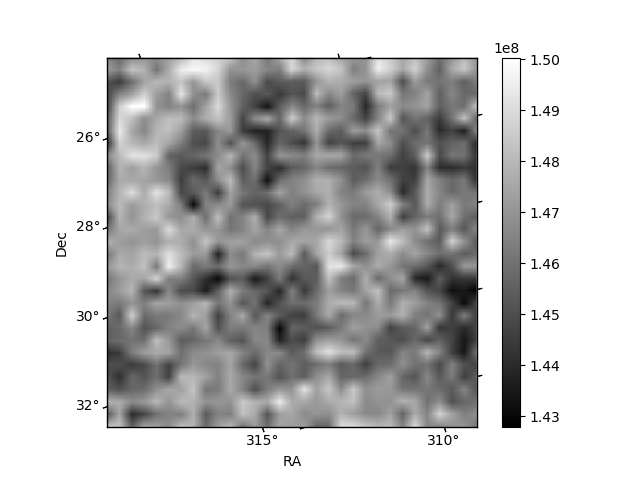
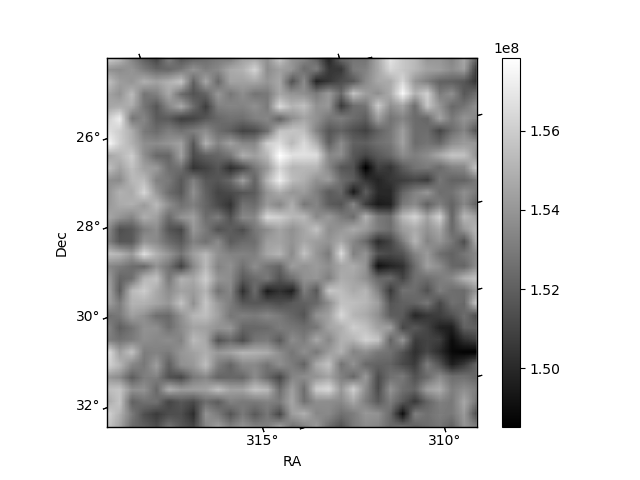
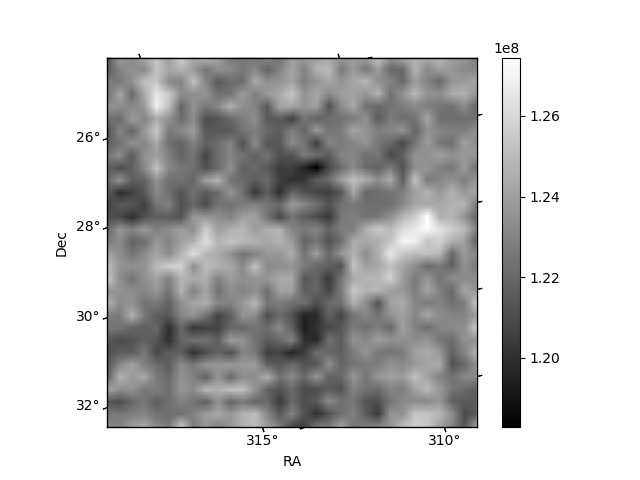
Histogram calculated using DETX and DETY for each event in the final _common_clean file
| Quadrant A | 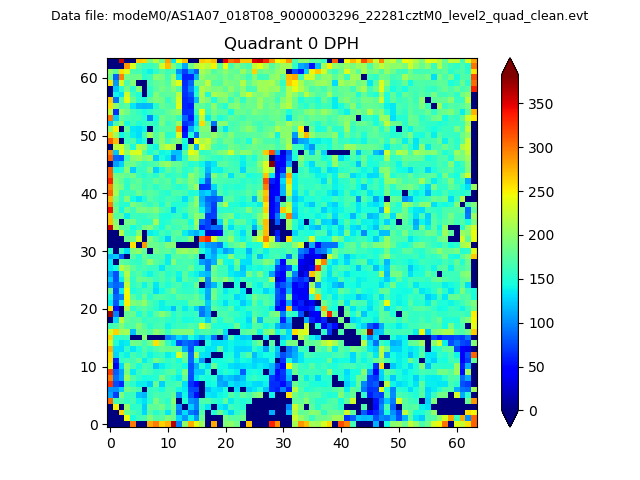 |
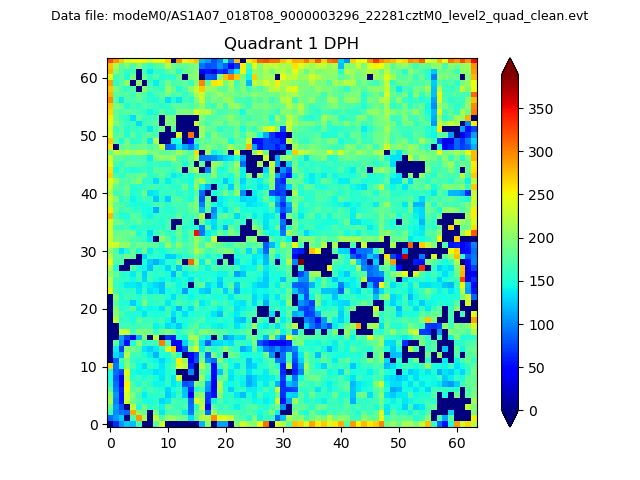 |
Quadrant B |
|---|---|---|---|
| Quadrant D | 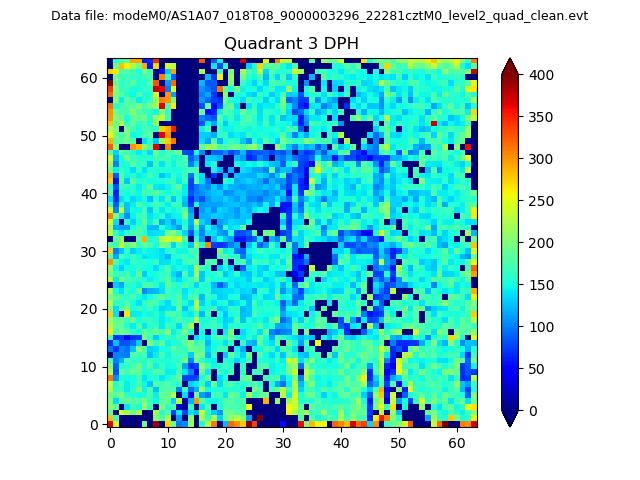 |
 |
Quadrant C |
| Plot type | Count rate plots | Images |
|---|---|---|
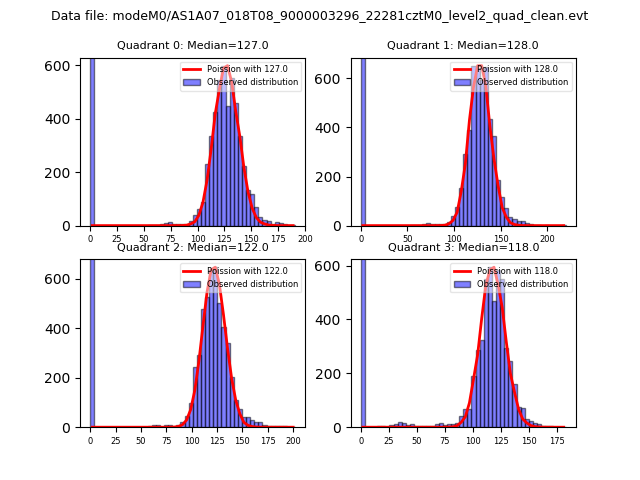
| Comparison with Poisson distribution Blue bars denote a histogram of data divided into 1 sec bins. Red curve is a Poisson curve with rate = median count rate of data. |
 |
 |
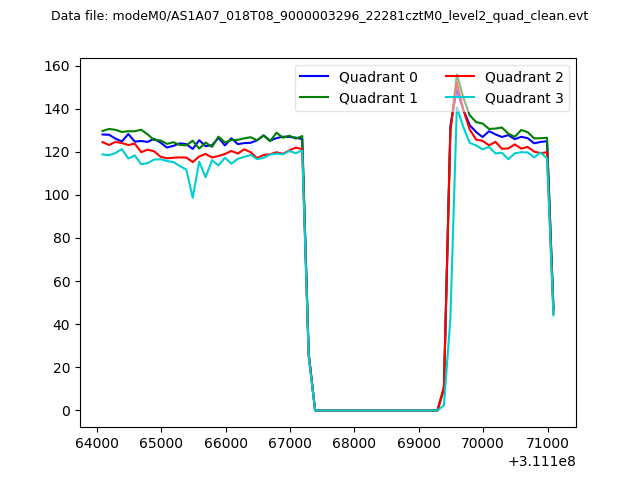
| Quadrant-wise count rates Data is divided into 100 sec bins |
 |
|
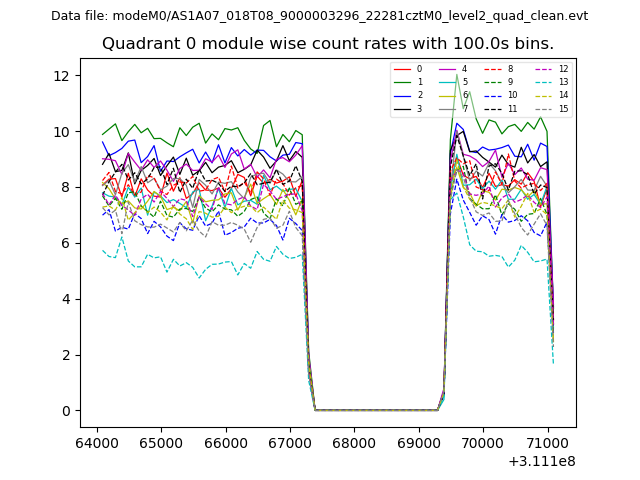
| Module-wise count rates for Quadrant A Data is divided into 100 sec bins |
 |
 |
| Module-wise count rates for Quadrant B Data is divided into 100 sec bins |
 |
 |
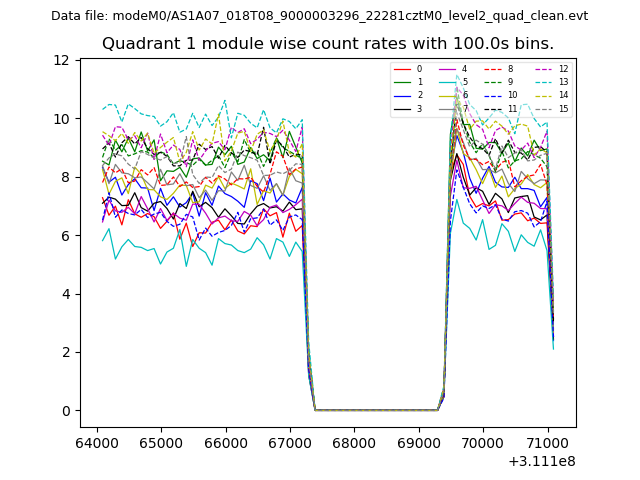
| Module-wise count rates for Quadrant C Data is divided into 100 sec bins |
 |
 |
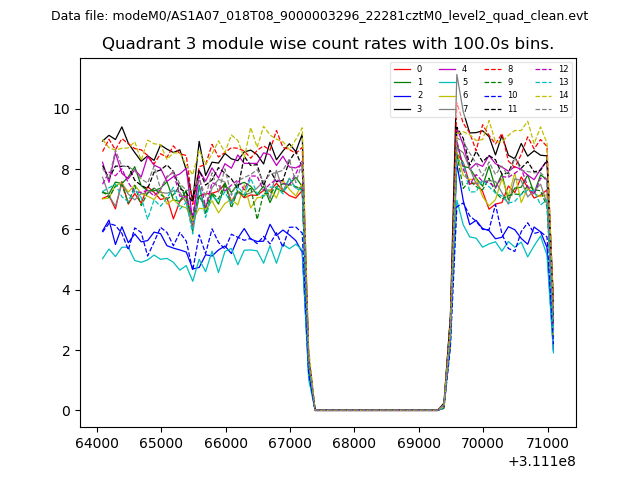
| Module-wise count rates for Quadrant D Data is divided into 100 sec bins |
 |
 |
| Parameter | Plot |
|---|---|
| CZT HV Monitor | 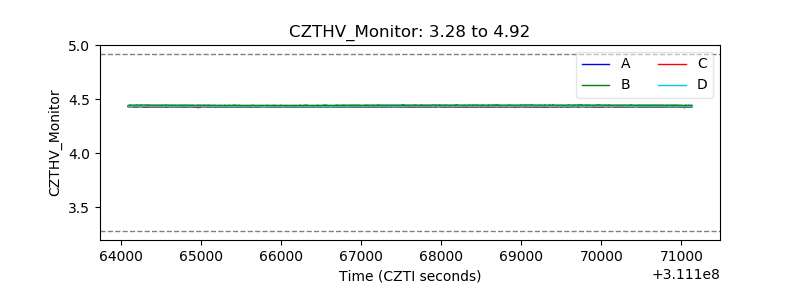 |
| D_VDD | 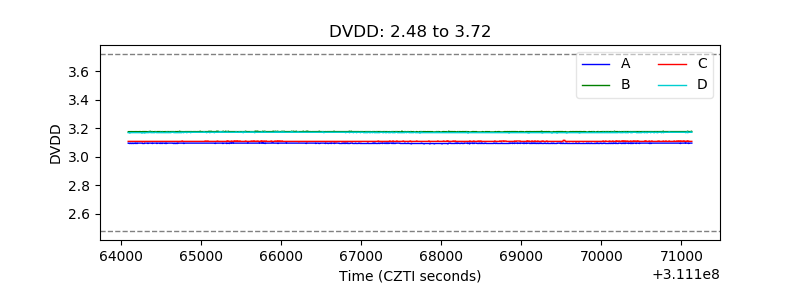 |
| Temperature 1 | 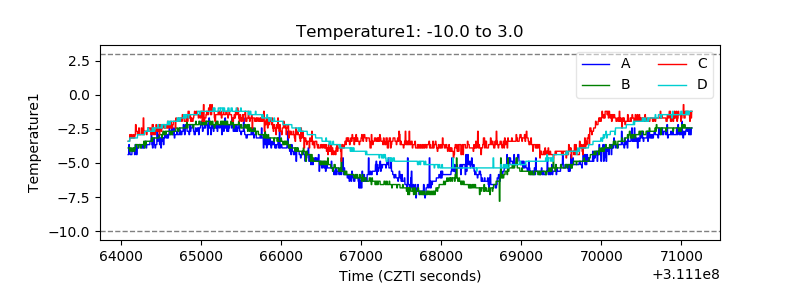 |
| Veto HV Monitor | 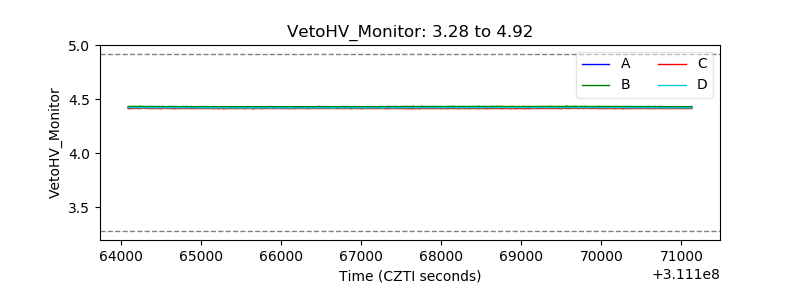 |
| Veto LLD | 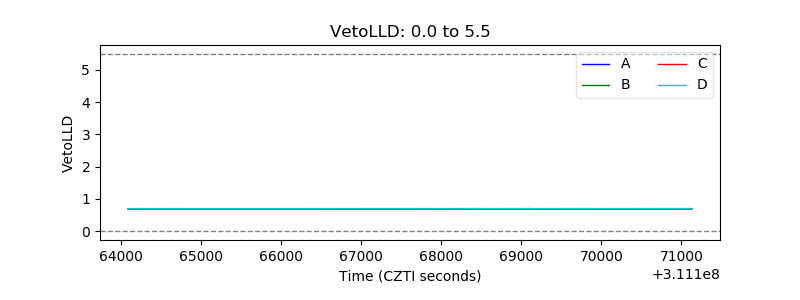 |
| Alpha Counter | 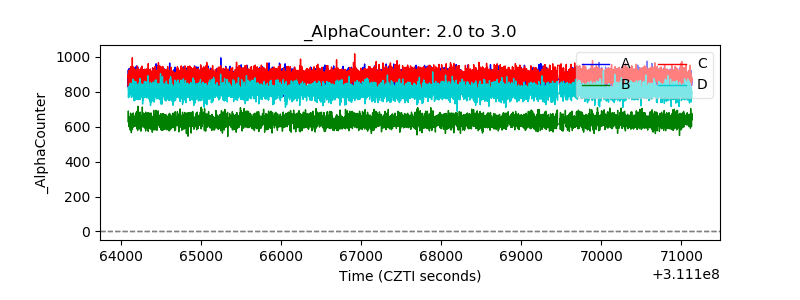 |
| _CPM_Rate | 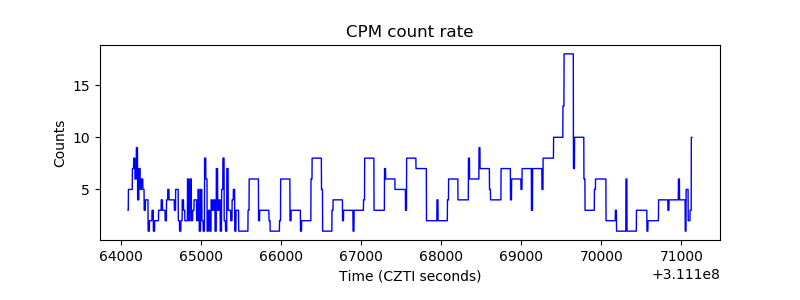 |
| CZT Counter | 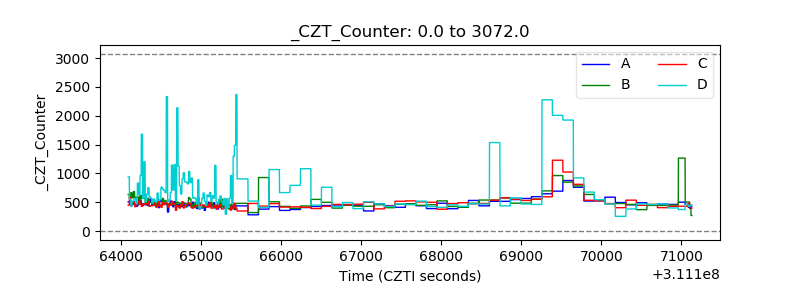 |
| +2.5 Volts monitor |  |
| +5 Volts monitor | 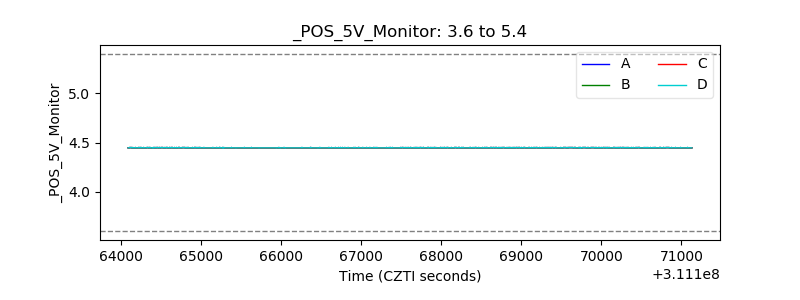 |
| _ROLL_ROT | 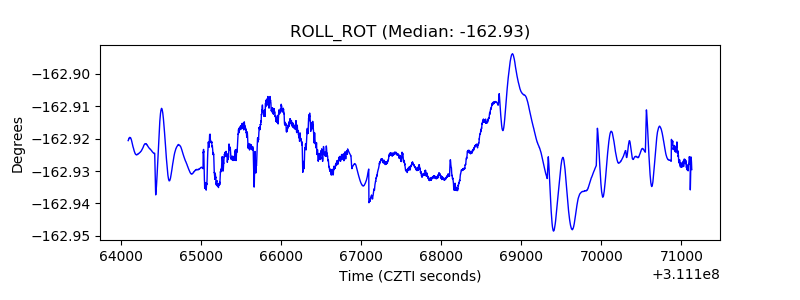 |
| _Roll_DEC | 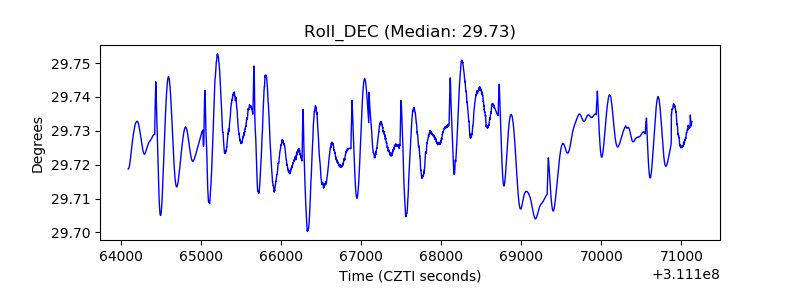 |
| _Roll_RA | 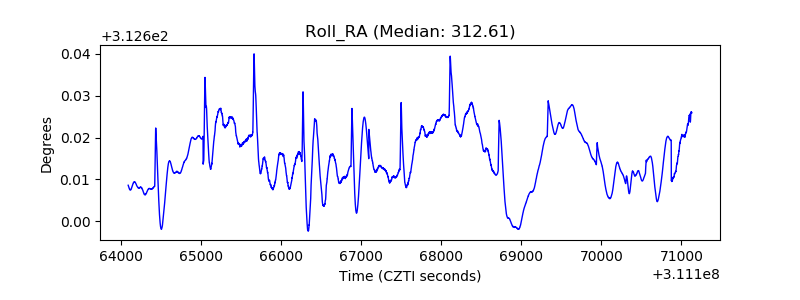 |
| Veto Counter | 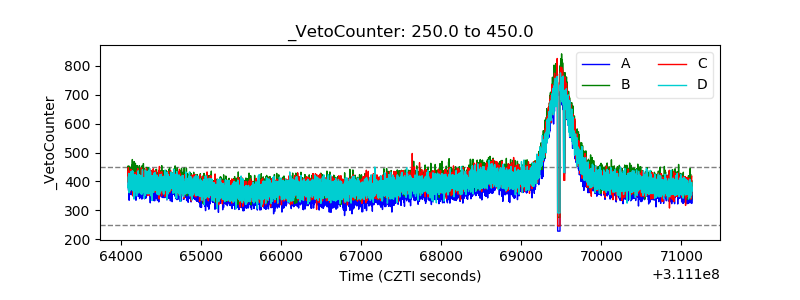 |