| Param | Original file | Final file |
|---|---|---|
| Filename | modeM0/AS1T03_147T01_9000003306_22335cztM0_level2.evt | modeM0/AS1T03_147T01_9000003306_22335cztM0_level2_quad_clean.evt |
| Size (bytes) | 358,272,000 | 70,027,200 |
| Size | 341.7 MB | 66.8 MB |
| Events in quadrant A | 2,491,668 | 445,594 |
| Events in quadrant B | 2,547,909 | 463,612 |
| Events in quadrant C | 2,602,640 | 442,146 |
| Events in quadrant D | 2,872,027 | 422,853 |
| Mode M9 | |||
|---|---|---|---|
| Quadrant | BADHDUFLAG | Total packets | Discarded packets |
| A | 0 | 13 | 0 |
| B | 0 | 13 | 0 |
| C | 0 | 13 | 0 |
| D | 0 | 13 | 0 |
| Mode SS | |||
|---|---|---|---|
| Quadrant | BADHDUFLAG | Total packets | Discarded packets |
| A | 0 | 102 | 0 |
| B | 0 | 102 | 0 |
| C | 0 | 102 | 0 |
| D | 0 | 102 | 0 |
| Mode M0 | |||
|---|---|---|---|
| Quadrant | BADHDUFLAG | Total packets | Discarded packets |
| A | 0 | 10312 | 1 |
| B | 0 | 10451 | 1 |
| C | 0 | 10438 | 1 |
| D | 0 | 11546 | 1 |
| Quadrant | Total seconds | Saturated seconds | Saturation percentage |
|---|---|---|---|
| A | 4931 | 53 | 1.074833% |
| B | 4931 | 69 | 1.399310% |
| C | 4931 | 85 | 1.723788% |
| D | 4931 | 154 | 3.123099% |
Noise dominated data is calculated using 1-second bins in cleaned event files. If a bin has >2000 counts, and if more than 50% of those come from <1% of pixels, then it is considered to be noise-dominated and hence unusable.
| Quadrant | # 1 sec bins | Bins with >0 counts | Bins with >2000 counts | High rate bins dominated by noise | Noise dominated (total time) | Noise dominated (detector-on time) | Marked lightcurve |
|---|---|---|---|---|---|---|---|
| A | 6256 | 4932 | 0 | 0 | 0.00% | 0.00% | 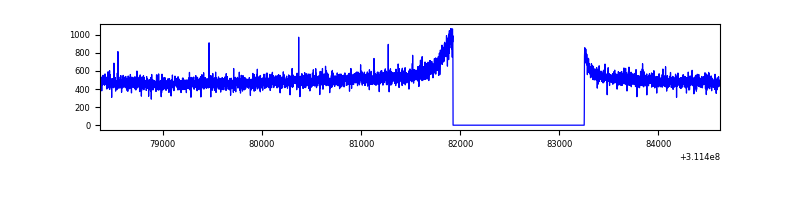 |
| B | 6256 | 4932 | 0 | 0 | 0.00% | 0.00% | 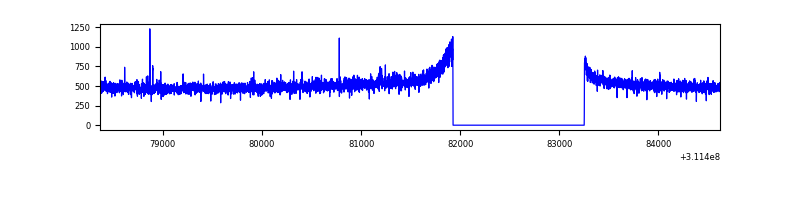 |
| C | 6256 | 4932 | 0 | 0 | 0.00% | 0.00% | 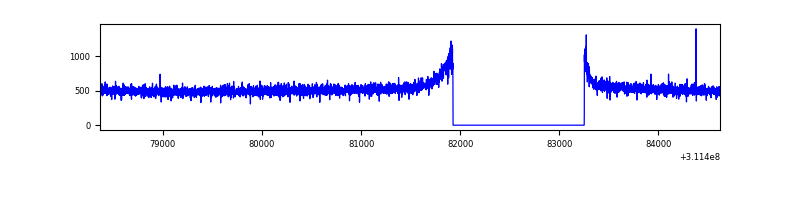 |
| D | 6256 | 4932 | 84 | 84 | 1.34% | 1.70% | 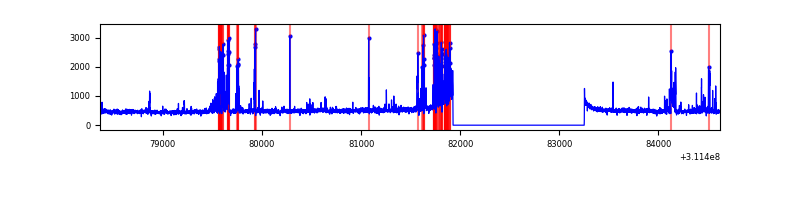 |
Top three noisy pixels from each quadrant. If the there are fewer than three noisy pixels in the level2.evt file, extra rows are filled as -1
| Pixel properties | Quadrant properties | ||||||
|---|---|---|---|---|---|---|---|
| Quadrant | DetID | PixID | Counts | Sigma | Mean | Median | Sigma |
| A | 13 | 254 | 6820 | 47.61 | 646 | 632 | 130.0 |
| A | 0 | 226 | 5379 | 36.52 | 646 | 632 | 130.0 |
| A | 3 | 137 | 5163 | 34.86 | 646 | 632 | 130.0 |
| B | 12 | 111 | 14101 | 112.02 | 650 | 635 | 120.2 |
| B | 11 | 111 | 12691 | 100.29 | 650 | 635 | 120.2 |
| B | 14 | 111 | 11363 | 89.24 | 650 | 635 | 120.2 |
| C | 14 | 238 | 100349 | 665.21 | 639 | 642 | 149.9 |
| C | 0 | 10 | 8638 | 53.35 | 639 | 642 | 149.9 |
| C | 13 | 61 | 4509 | 25.8 | 639 | 642 | 149.9 |
| D | 1 | 52 | 433323 | 2849.7 | 635 | 619 | 151.8 |
| D | 2 | 234 | 18719 | 119.2 | 635 | 619 | 151.8 |
| D | 5 | 32 | 14753 | 93.08 | 635 | 619 | 151.8 |
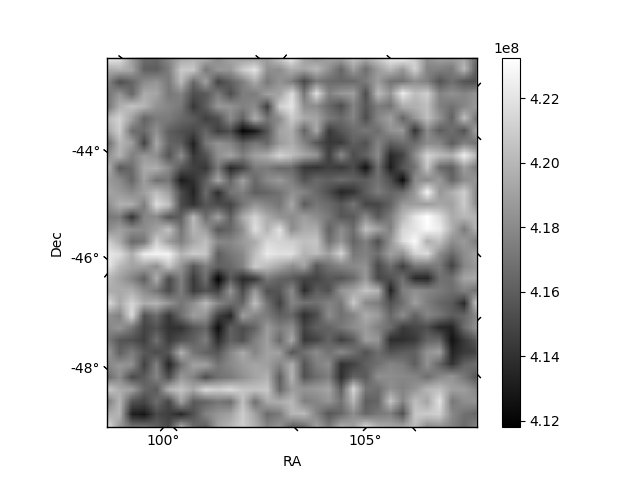
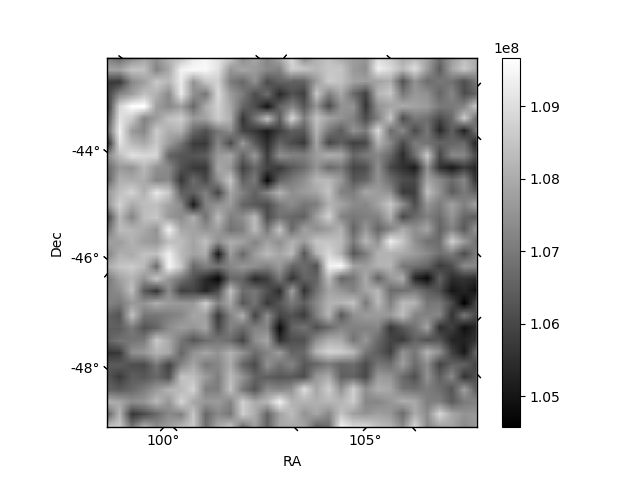
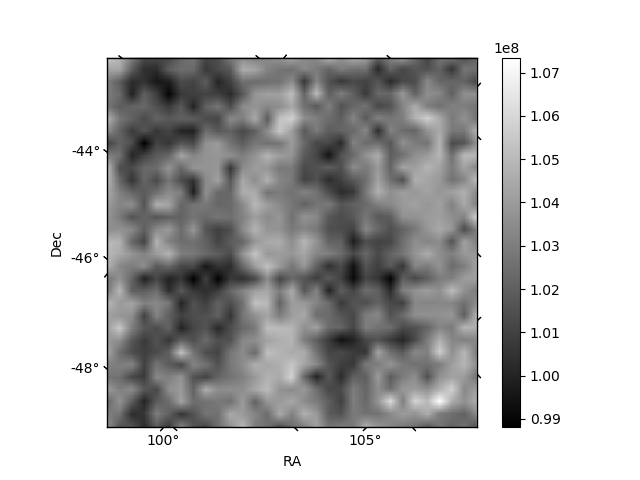
Histogram calculated using DETX and DETY for each event in the final _common_clean file
| Quadrant A | 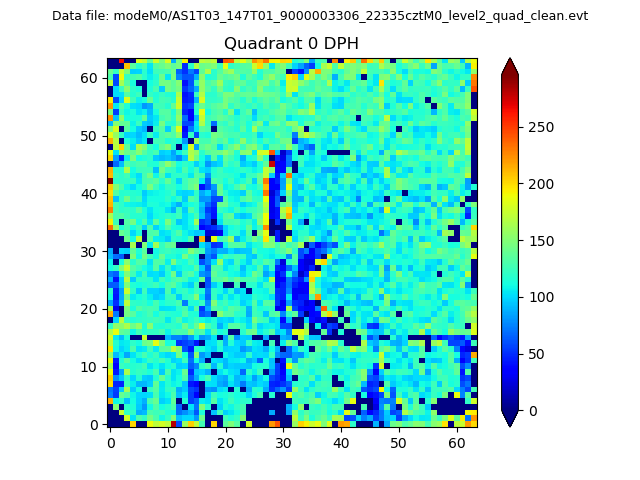 |
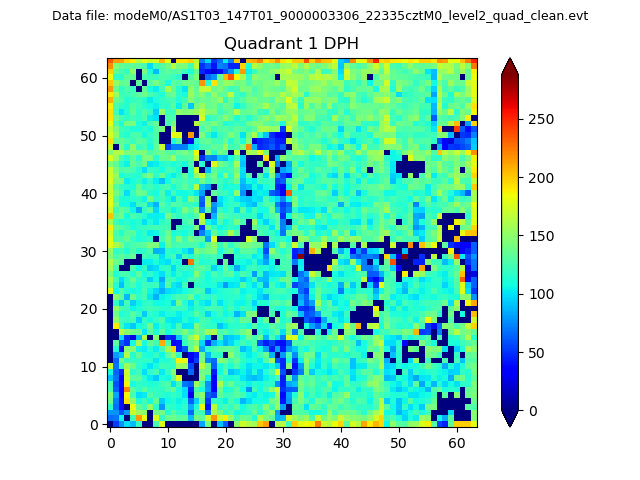 |
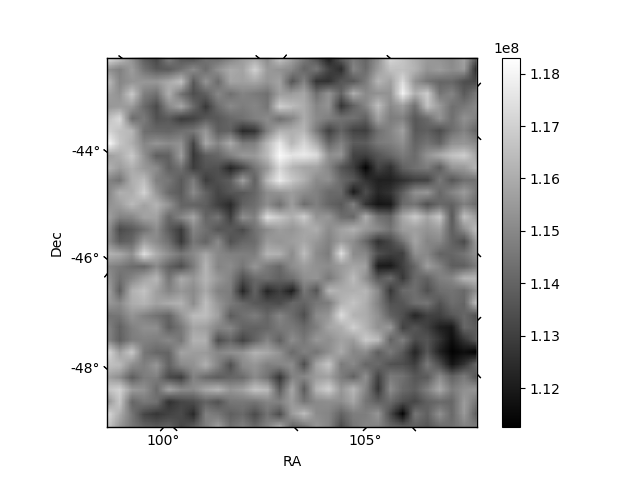
Quadrant B |
|---|---|---|---|
| Quadrant D | 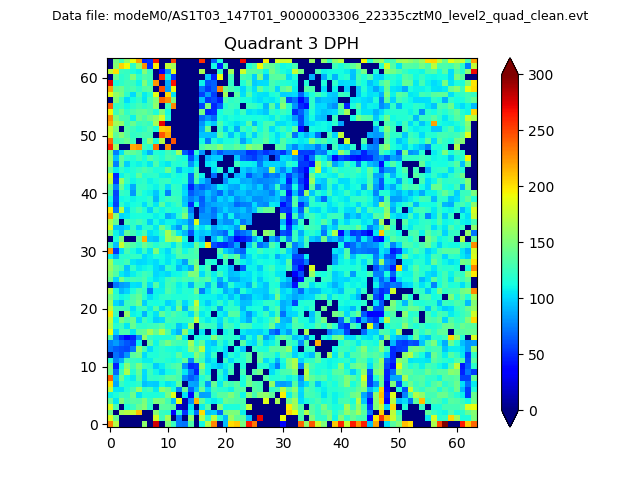 |
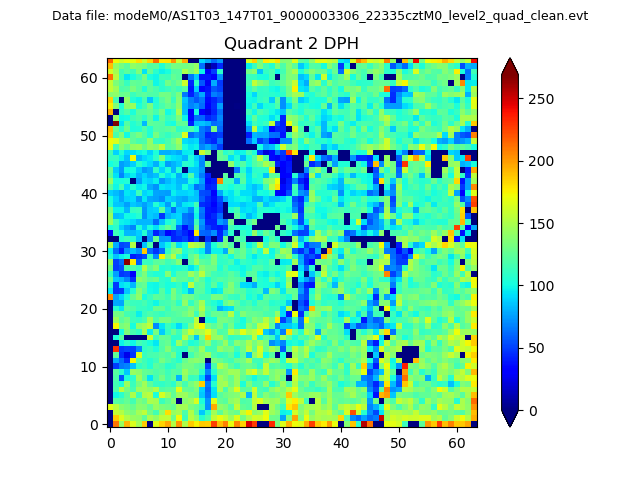 |
Quadrant C |
| Plot type | Count rate plots | Images |
|---|---|---|
| Comparison with Poisson distribution Blue bars denote a histogram of data divided into 1 sec bins. Red curve is a Poisson curve with rate = median count rate of data. |
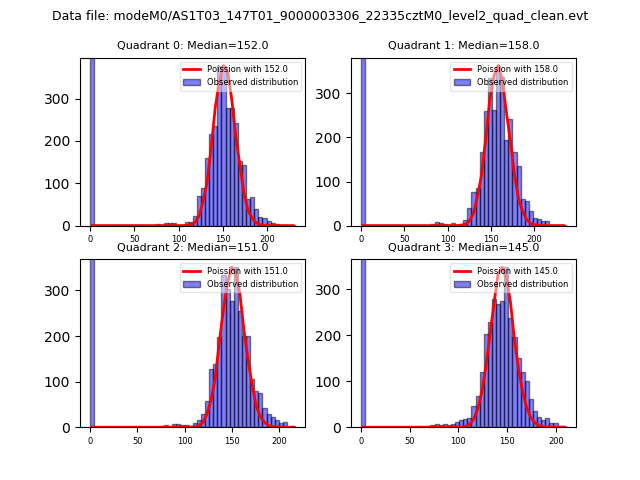 |
 |
| Quadrant-wise count rates Data is divided into 100 sec bins |
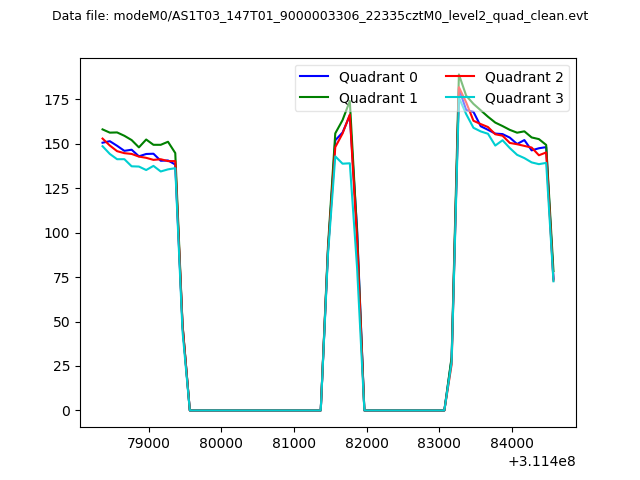 |
|
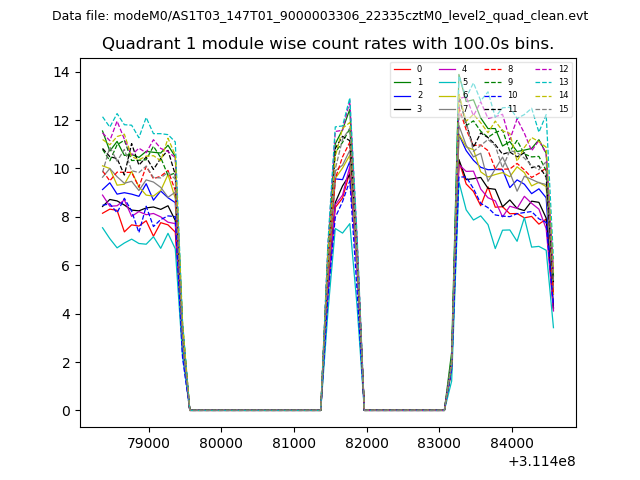
| Module-wise count rates for Quadrant A Data is divided into 100 sec bins |
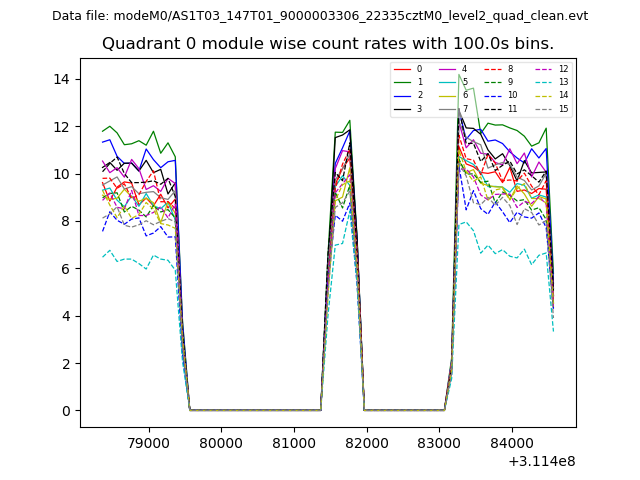 |
 |
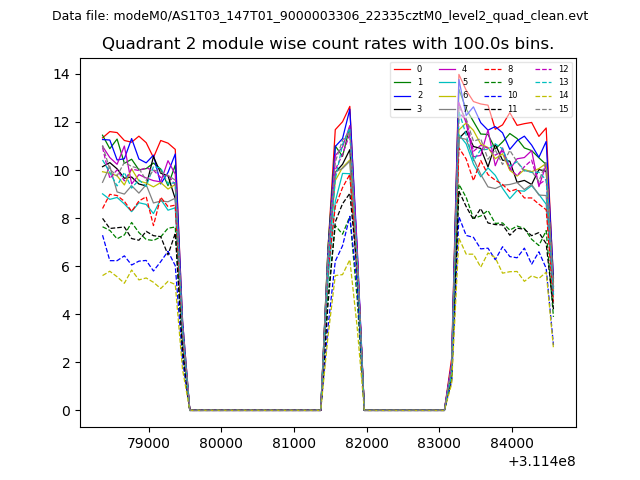
| Module-wise count rates for Quadrant B Data is divided into 100 sec bins |
 |
 |
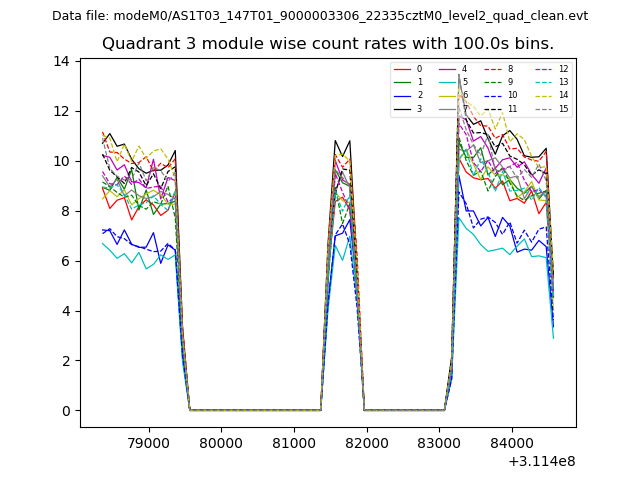
| Module-wise count rates for Quadrant C Data is divided into 100 sec bins |
 |
 |
| Module-wise count rates for Quadrant D Data is divided into 100 sec bins |
 |
 |
| Parameter | Plot |
|---|---|
| CZT HV Monitor | 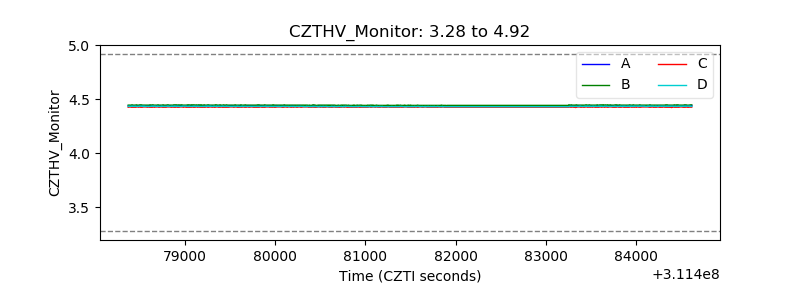 |
| D_VDD | 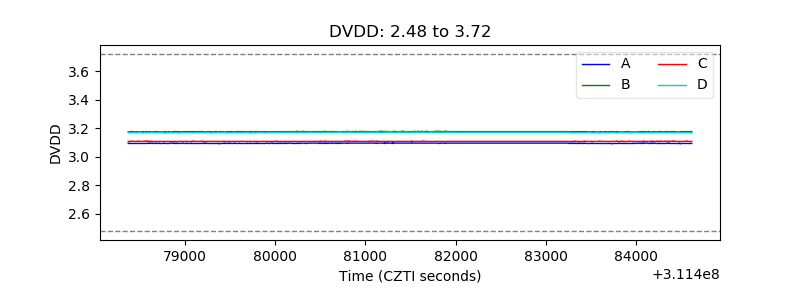 |
| Temperature 1 | 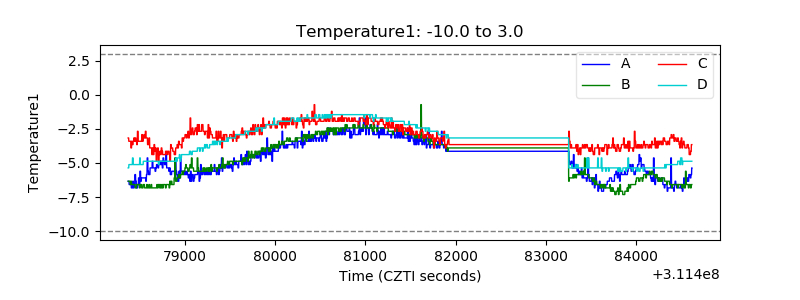 |
| Veto HV Monitor | 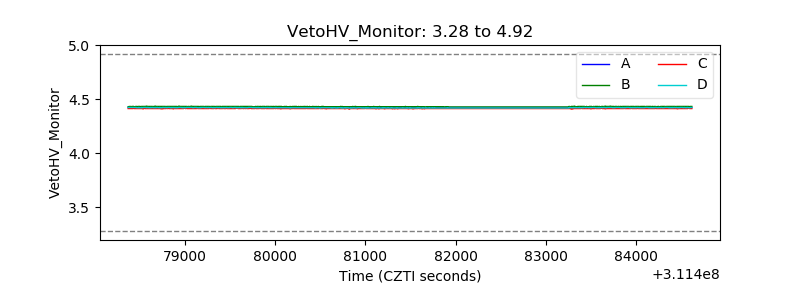 |
| Veto LLD | 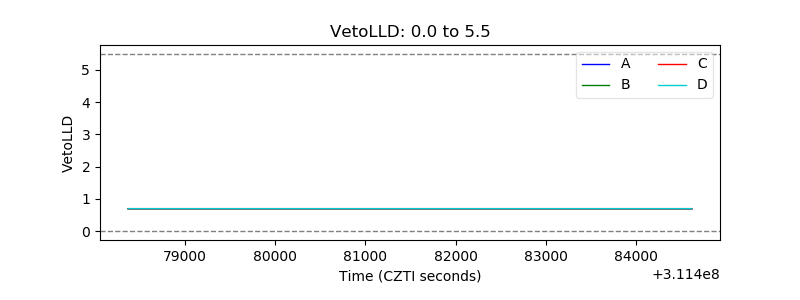 |
| Alpha Counter | 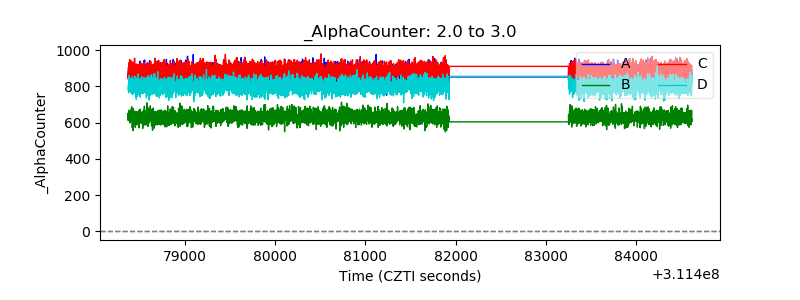 |
| _CPM_Rate | 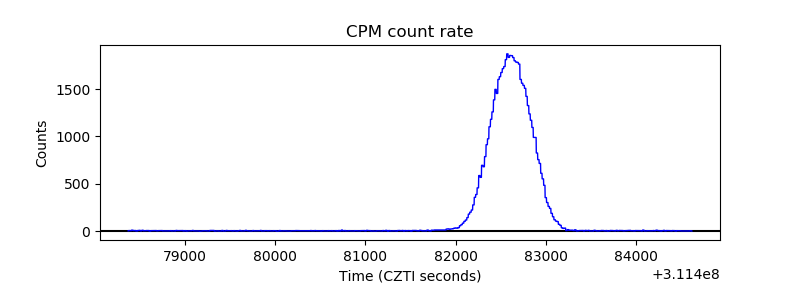 |
| CZT Counter | 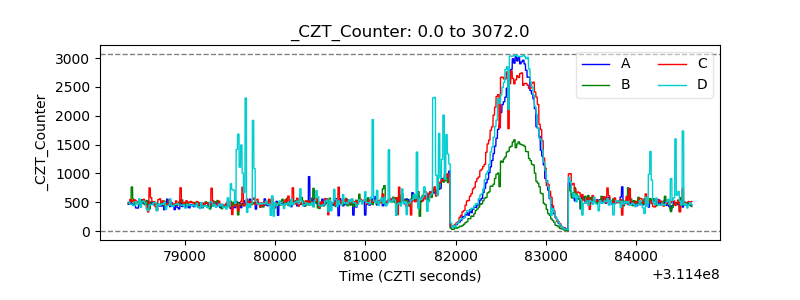 |
| +2.5 Volts monitor |  |
| +5 Volts monitor |  |
| _ROLL_ROT | 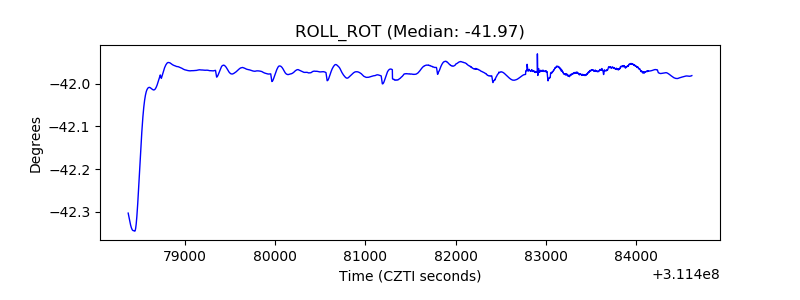 |
| _Roll_DEC | 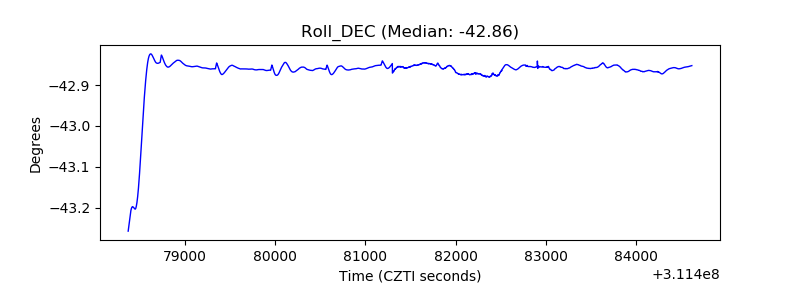 |
| _Roll_RA | 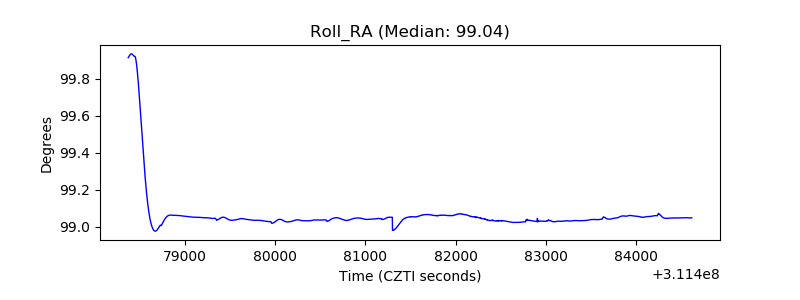 |
| Veto Counter | 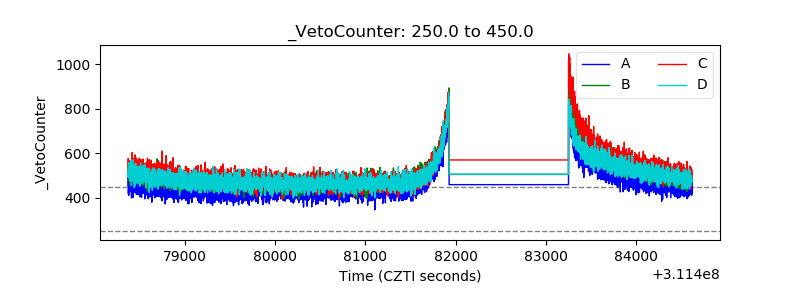 |