| Param | Original file | Final file |
|---|---|---|
| Filename | modeM0/AS1T03_147T01_9000003306_22336cztM0_level2.evt | modeM0/AS1T03_147T01_9000003306_22336cztM0_level2_quad_clean.evt |
| Size (bytes) | 437,837,760 | 98,910,720 |
| Size | 417.6 MB | 94.3 MB |
| Events in quadrant A | 3,133,561 | 638,846 |
| Events in quadrant B | 3,194,051 | 661,359 |
| Events in quadrant C | 3,289,778 | 633,884 |
| Events in quadrant D | 3,209,560 | 616,996 |
| Mode M9 | |||
|---|---|---|---|
| Quadrant | BADHDUFLAG | Total packets | Discarded packets |
| A | 0 | 20 | 0 |
| B | 0 | 21 | 0 |
| C | 0 | 21 | 0 |
| D | 0 | 21 | 0 |
| Mode SS | |||
|---|---|---|---|
| Quadrant | BADHDUFLAG | Total packets | Discarded packets |
| A | 0 | 130 | 0 |
| B | 0 | 130 | 0 |
| C | 0 | 130 | 0 |
| D | 0 | 130 | 0 |
| Mode M0 | |||
|---|---|---|---|
| Quadrant | BADHDUFLAG | Total packets | Discarded packets |
| A | 0 | 13153 | 2 |
| B | 0 | 13268 | 2 |
| C | 0 | 13387 | 2 |
| D | 0 | 13557 | 2 |
| Quadrant | Total seconds | Saturated seconds | Saturation percentage |
|---|---|---|---|
| A | 6366 | 17 | 0.267044% |
| B | 6366 | 38 | 0.596921% |
| C | 6366 | 82 | 1.288093% |
| D | 6366 | 20 | 0.314169% |
Noise dominated data is calculated using 1-second bins in cleaned event files. If a bin has >2000 counts, and if more than 50% of those come from <1% of pixels, then it is considered to be noise-dominated and hence unusable.
| Quadrant | # 1 sec bins | Bins with >0 counts | Bins with >2000 counts | High rate bins dominated by noise | Noise dominated (total time) | Noise dominated (detector-on time) | Marked lightcurve |
|---|---|---|---|---|---|---|---|
| A | 7551 | 6367 | 0 | 0 | 0.00% | 0.00% | 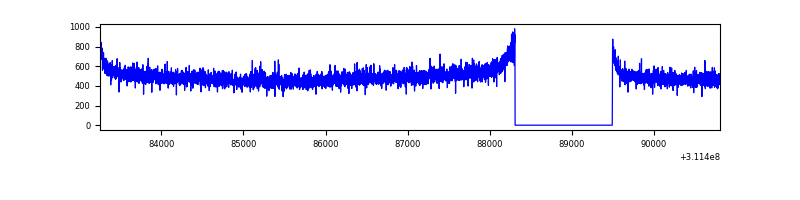 |
| B | 7551 | 6367 | 0 | 0 | 0.00% | 0.00% | 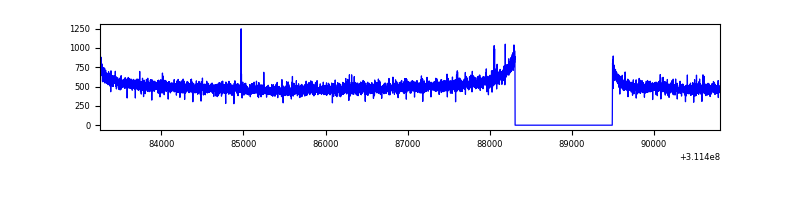 |
| C | 7551 | 6367 | 0 | 0 | 0.00% | 0.00% | 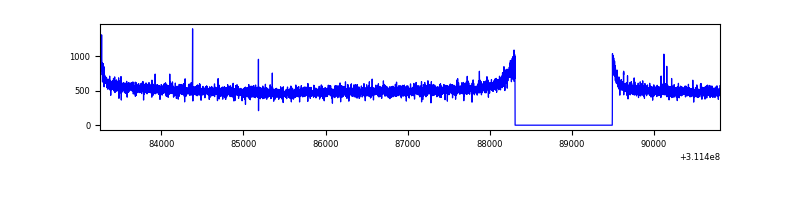 |
| D | 7551 | 6367 | 10 | 10 | 0.13% | 0.16% | 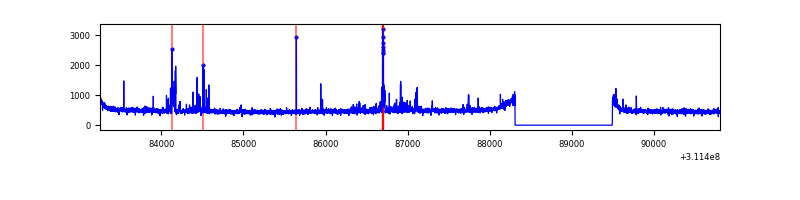 |
Top three noisy pixels from each quadrant. If the there are fewer than three noisy pixels in the level2.evt file, extra rows are filled as -1
| Pixel properties | Quadrant properties | ||||||
|---|---|---|---|---|---|---|---|
| Quadrant | DetID | PixID | Counts | Sigma | Mean | Median | Sigma |
| A | 13 | 254 | 8876 | 49.59 | 813 | 796 | 162.9 |
| A | 0 | 226 | 6855 | 37.19 | 813 | 796 | 162.9 |
| A | 3 | 137 | 6711 | 36.31 | 813 | 796 | 162.9 |
| B | 12 | 111 | 18295 | 115.04 | 817 | 796 | 152.1 |
| B | 11 | 111 | 16158 | 100.99 | 817 | 796 | 152.1 |
| B | 14 | 111 | 14418 | 89.55 | 817 | 796 | 152.1 |
| C | 14 | 238 | 127302 | 670.81 | 806 | 813 | 188.6 |
| C | 0 | 10 | 14682 | 73.55 | 806 | 813 | 188.6 |
| C | 9 | 54 | 7747 | 36.77 | 806 | 813 | 188.6 |
| D | 13 | 174 | 86545 | 441.71 | 804 | 784 | 194.2 |
| D | 1 | 52 | 69140 | 352.07 | 804 | 784 | 194.2 |
| D | 2 | 234 | 23308 | 116.01 | 804 | 784 | 194.2 |
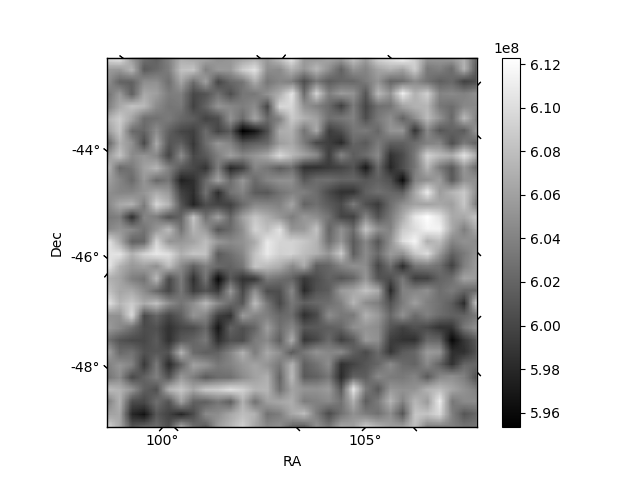
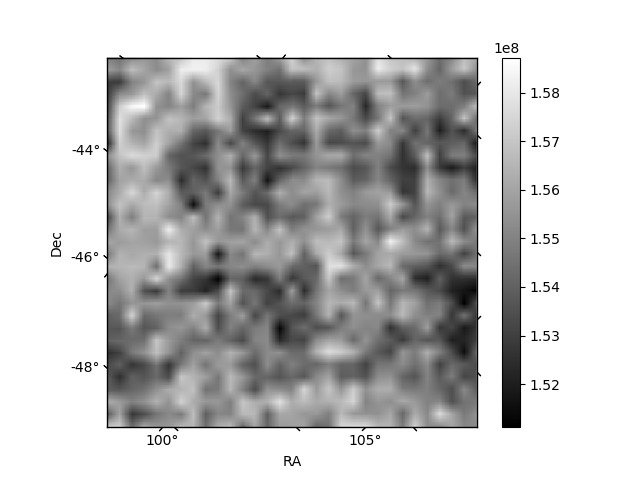
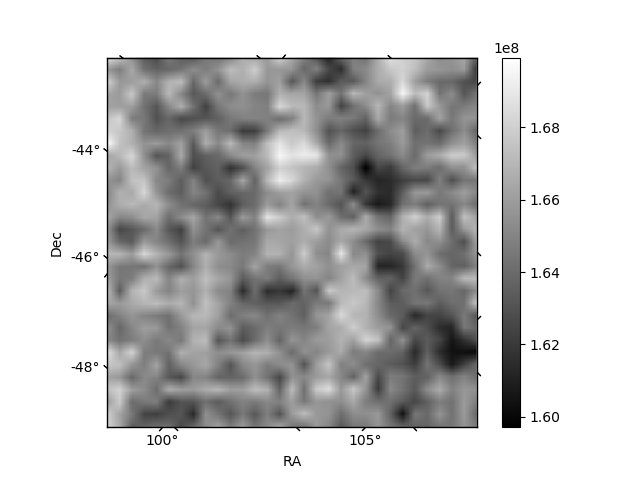
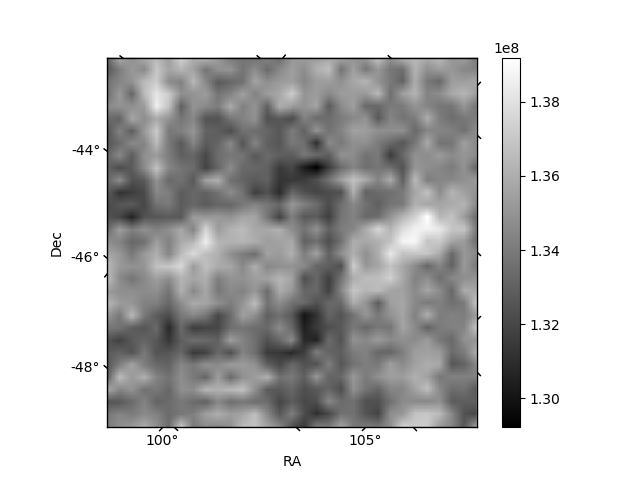
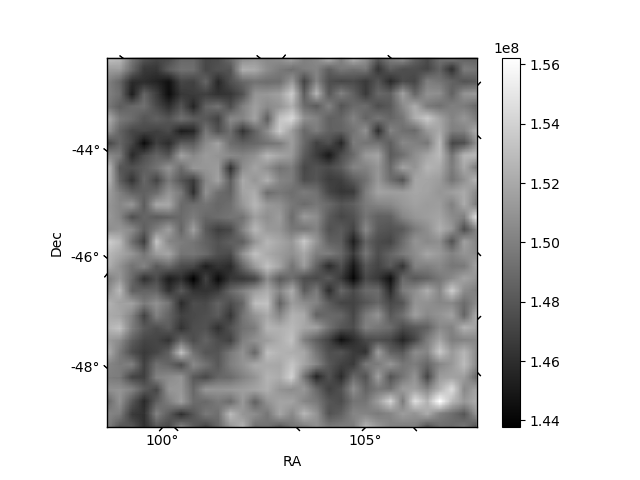
Histogram calculated using DETX and DETY for each event in the final _common_clean file
| Quadrant A | 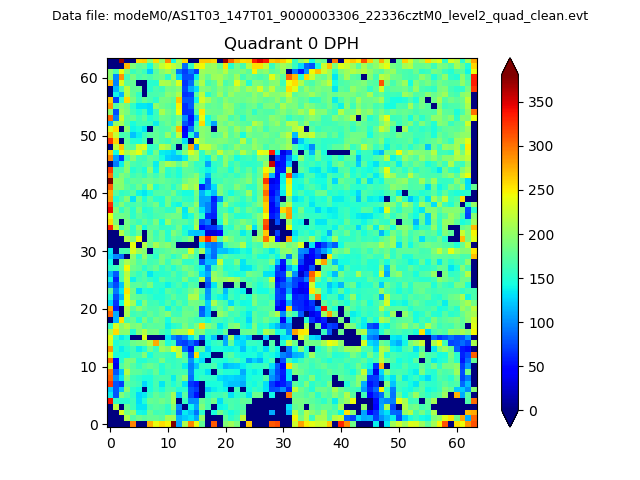 |
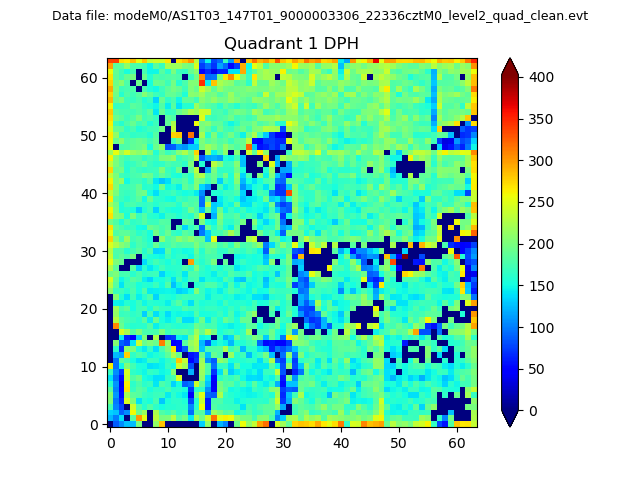 |
Quadrant B |
|---|---|---|---|
| Quadrant D | 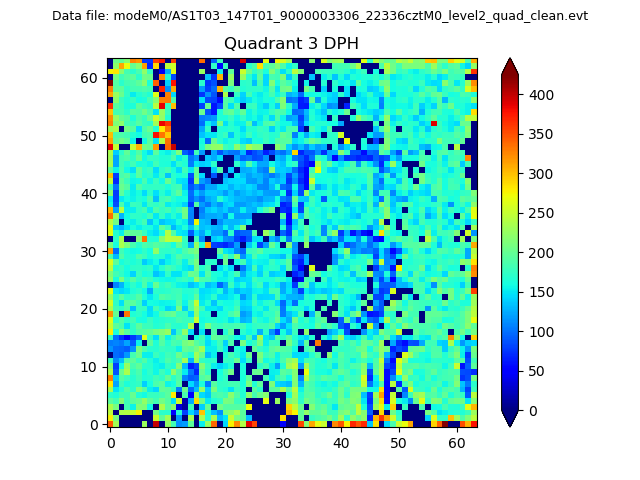 |
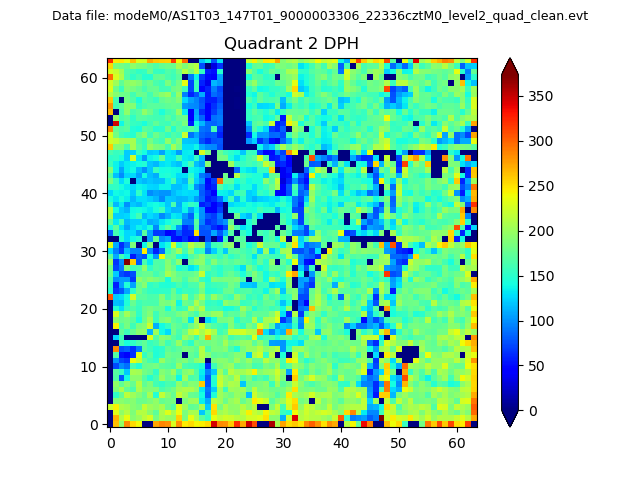 |
Quadrant C |
| Plot type | Count rate plots | Images |
|---|---|---|
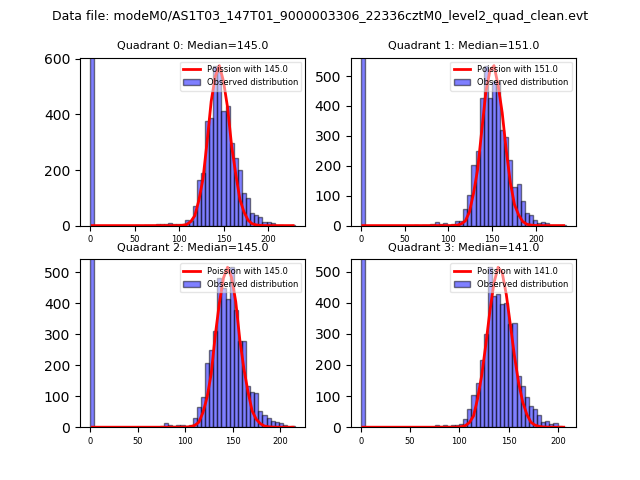
| Comparison with Poisson distribution Blue bars denote a histogram of data divided into 1 sec bins. Red curve is a Poisson curve with rate = median count rate of data. |
 |
 |
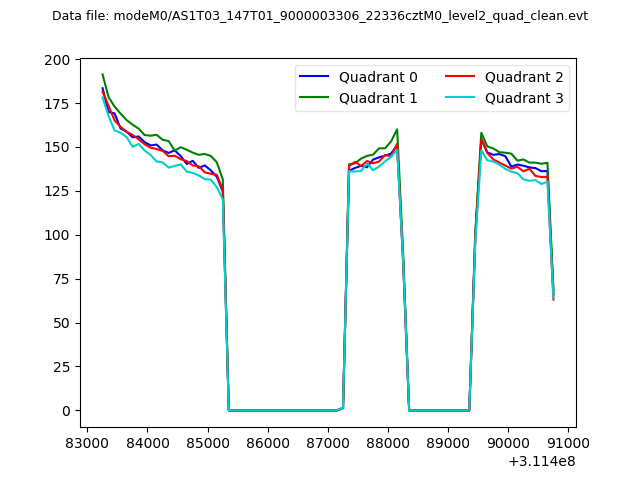
| Quadrant-wise count rates Data is divided into 100 sec bins |
 |
|
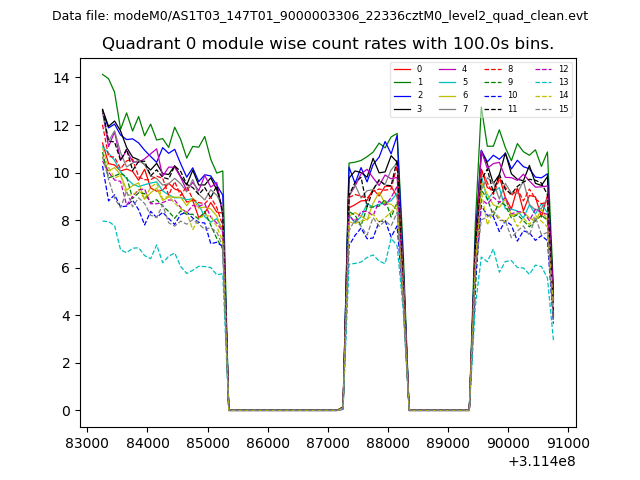
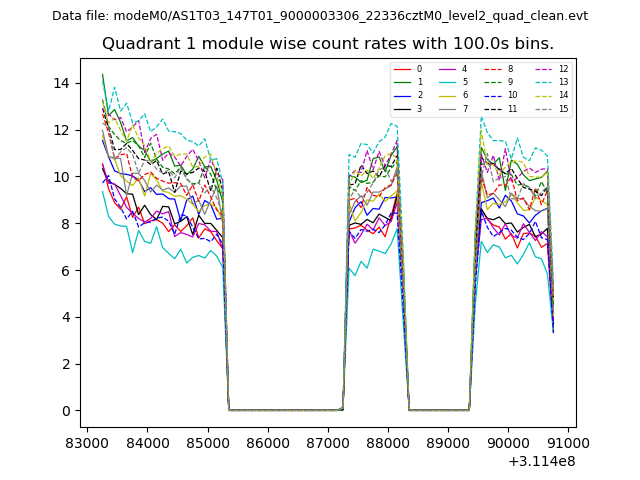
| Module-wise count rates for Quadrant A Data is divided into 100 sec bins |
 |
 |
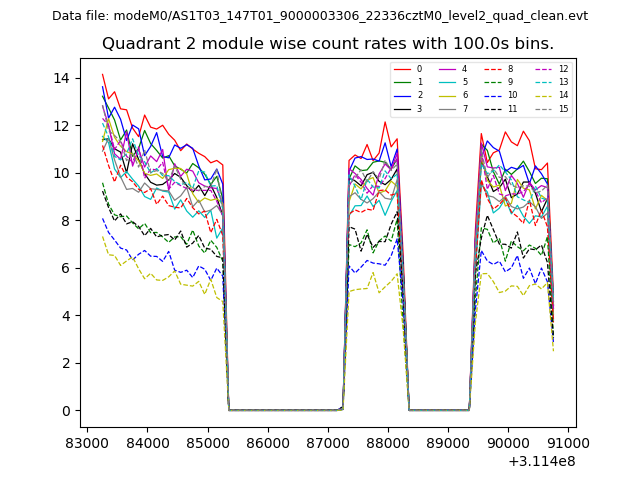
| Module-wise count rates for Quadrant B Data is divided into 100 sec bins |
 |
 |
| Module-wise count rates for Quadrant C Data is divided into 100 sec bins |
 |
 |
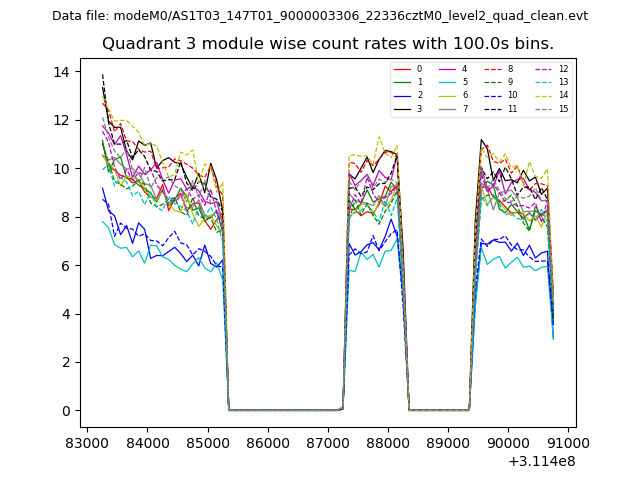
| Module-wise count rates for Quadrant D Data is divided into 100 sec bins |
 |
 |
| Parameter | Plot |
|---|---|
| CZT HV Monitor | 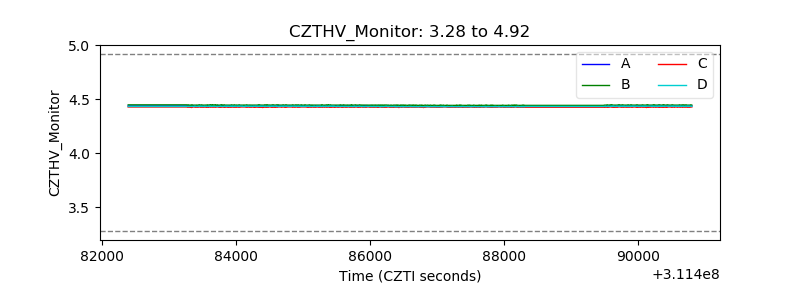 |
| D_VDD |  |
| Temperature 1 |  |
| Veto HV Monitor | 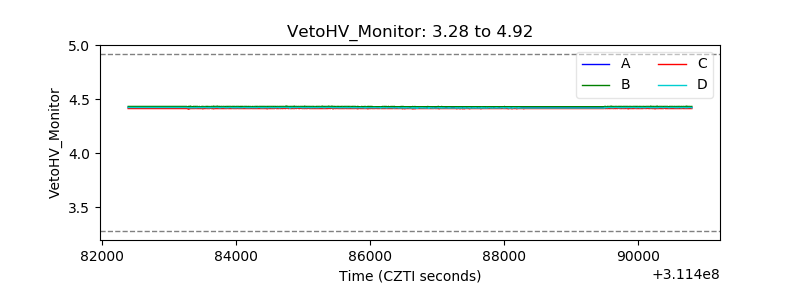 |
| Veto LLD | 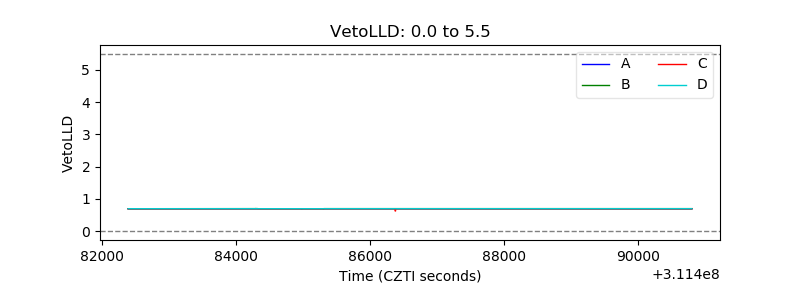 |
| Alpha Counter | 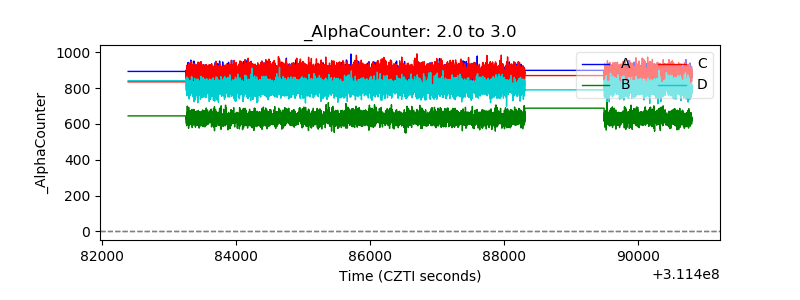 |
| _CPM_Rate | 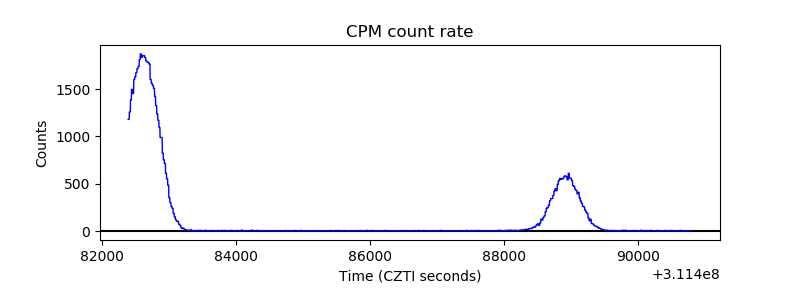 |
| CZT Counter | 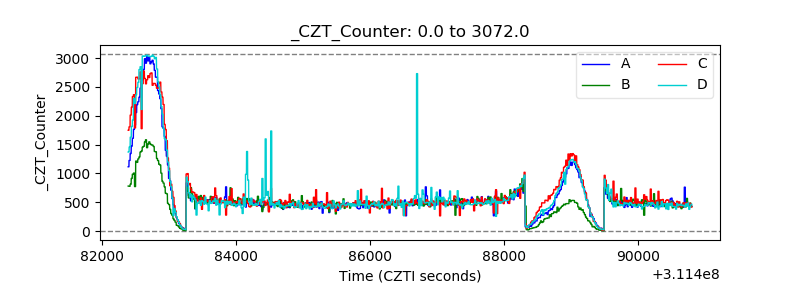 |
| +2.5 Volts monitor |  |
| +5 Volts monitor |  |
| _ROLL_ROT | 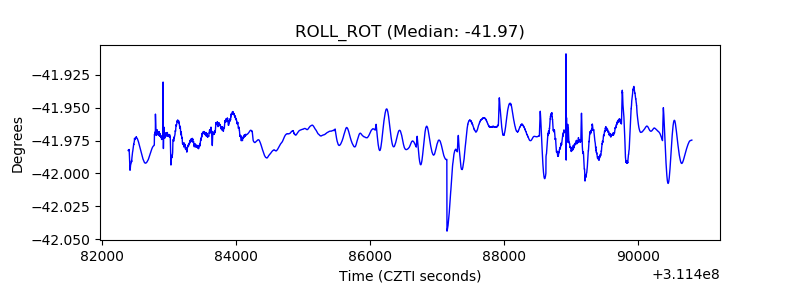 |
| _Roll_DEC | 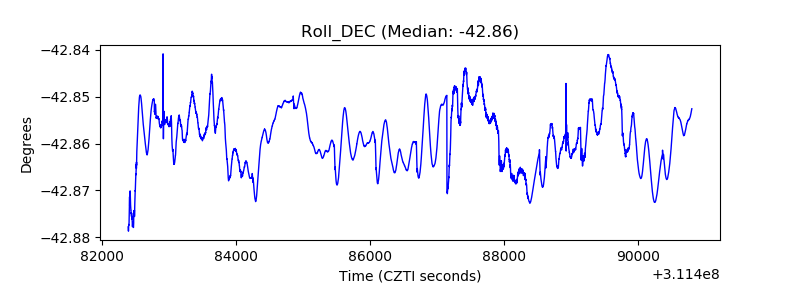 |
| _Roll_RA | 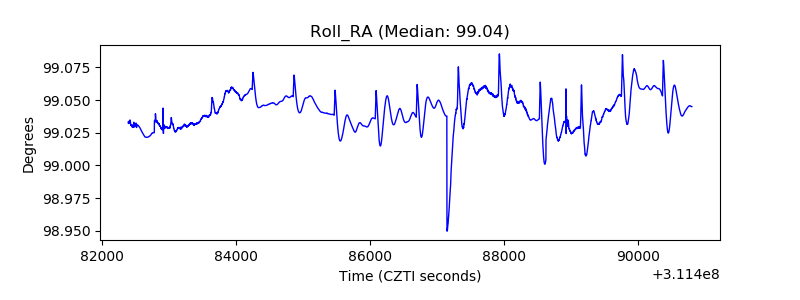 |
| Veto Counter | 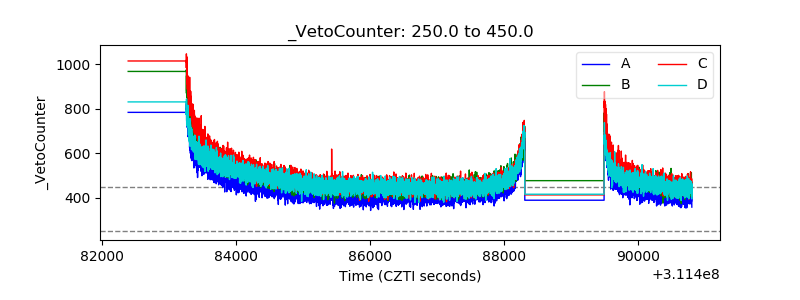 |