| Param | Original file | Final file |
|---|---|---|
| Filename | modeM0/AS1A07_056T01_9000003330_22452cztM0_level2.evt | modeM0/AS1A07_056T01_9000003330_22452cztM0_level2_quad_clean.evt |
| Size (bytes) | 461,980,800 | 132,909,120 |
| Size | 440.6 MB | 126.8 MB |
| Events in quadrant A | 3,137,877 | 896,781 |
| Events in quadrant B | 4,022,779 | 903,389 |
| Events in quadrant C | 3,319,166 | 886,089 |
| Events in quadrant D | 3,054,446 | 870,849 |
| Mode SS | |||
|---|---|---|---|
| Quadrant | BADHDUFLAG | Total packets | Discarded packets |
| A | 0 | 136 | 0 |
| B | 0 | 136 | 0 |
| C | 0 | 136 | 0 |
| D | 0 | 136 | 0 |
| Mode M9 | |||
|---|---|---|---|
| Quadrant | BADHDUFLAG | Total packets | Discarded packets |
| A | 0 | 15 | 0 |
| B | 0 | 16 | 0 |
| C | 0 | 16 | 0 |
| D | 0 | 16 | 0 |
| Mode M0 | |||
|---|---|---|---|
| Quadrant | BADHDUFLAG | Total packets | Discarded packets |
| A | 0 | 13862 | 2 |
| B | 0 | 16456 | 2 |
| C | 0 | 14209 | 2 |
| D | 0 | 13953 | 2 |
| Quadrant | Total seconds | Saturated seconds | Saturation percentage |
|---|---|---|---|
| A | 6721 | 59 | 0.877846% |
| B | 6721 | 311 | 4.627288% |
| C | 6721 | 107 | 1.592025% |
| D | 6721 | 42 | 0.624907% |
Noise dominated data is calculated using 1-second bins in cleaned event files. If a bin has >2000 counts, and if more than 50% of those come from <1% of pixels, then it is considered to be noise-dominated and hence unusable.
| Quadrant | # 1 sec bins | Bins with >0 counts | Bins with >2000 counts | High rate bins dominated by noise | Noise dominated (total time) | Noise dominated (detector-on time) | Marked lightcurve |
|---|---|---|---|---|---|---|---|
| A | 7836 | 6721 | 0 | 0 | 0.00% | 0.00% | 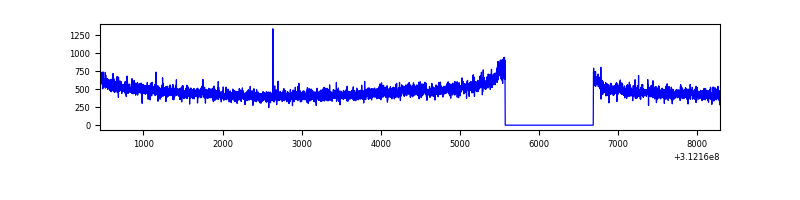 |
| B | 7836 | 6721 | 128 | 128 | 1.63% | 1.90% | 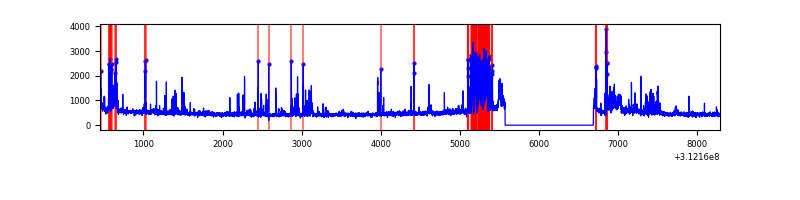 |
| C | 7836 | 6722 | 0 | 0 | 0.00% | 0.00% | 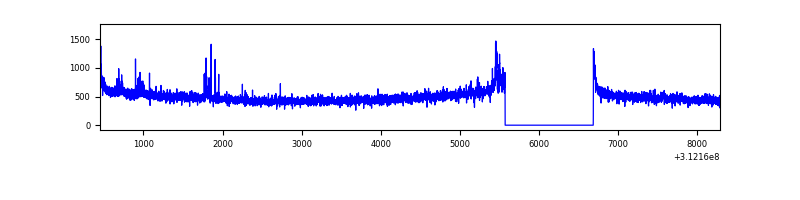 |
| D | 7836 | 6722 | 1 | 1 | 0.01% | 0.01% | 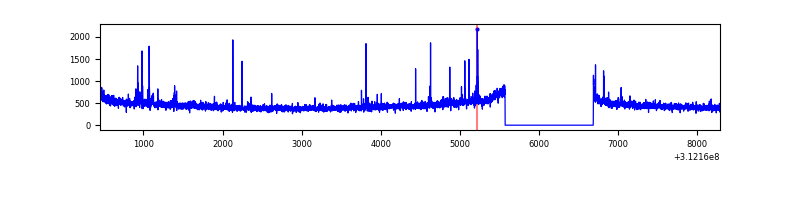 |
Top three noisy pixels from each quadrant. If the there are fewer than three noisy pixels in the level2.evt file, extra rows are filled as -1
| Pixel properties | Quadrant properties | ||||||
|---|---|---|---|---|---|---|---|
| Quadrant | DetID | PixID | Counts | Sigma | Mean | Median | Sigma |
| A | 6 | 240 | 31904 | 192.04 | 806 | 788 | 162.0 |
| A | 13 | 254 | 9870 | 56.05 | 806 | 788 | 162.0 |
| A | 0 | 226 | 6976 | 38.19 | 806 | 788 | 162.0 |
| B | 10 | 245 | 858550 | 5746.83 | 798 | 780 | 149.3 |
| B | 12 | 111 | 18095 | 116.01 | 798 | 780 | 149.3 |
| B | 11 | 111 | 15596 | 99.26 | 798 | 780 | 149.3 |
| C | 14 | 238 | 125803 | 693.82 | 783 | 787 | 180.2 |
| C | 3 | 9 | 47279 | 258.02 | 783 | 787 | 180.2 |
| C | 10 | 22 | 28092 | 151.54 | 783 | 787 | 180.2 |
| D | 2 | 234 | 29046 | 148.84 | 787 | 762 | 190.0 |
| D | 1 | 52 | 24257 | 123.64 | 787 | 762 | 190.0 |
| D | 9 | 85 | 20620 | 104.5 | 787 | 762 | 190.0 |
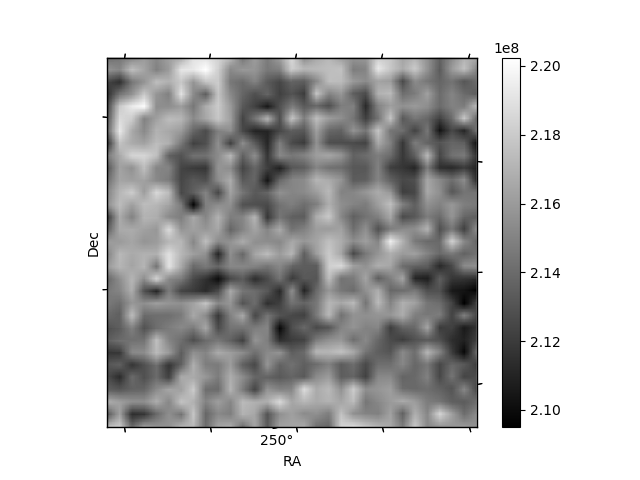
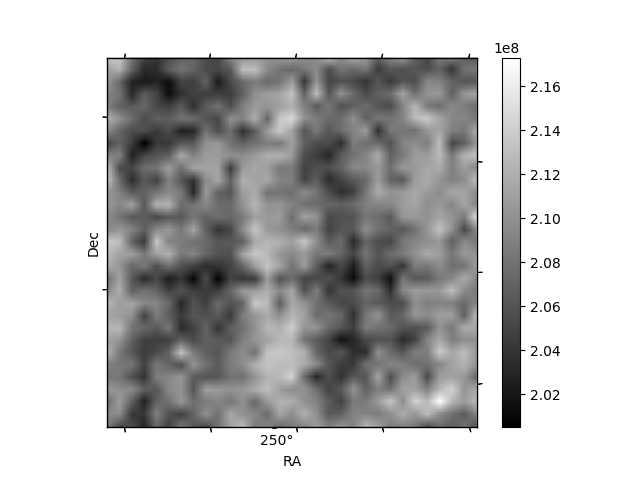
Histogram calculated using DETX and DETY for each event in the final _common_clean file
| Quadrant A | 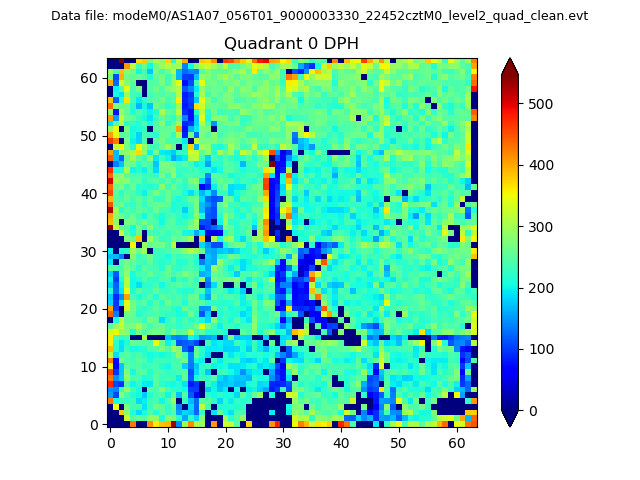 |
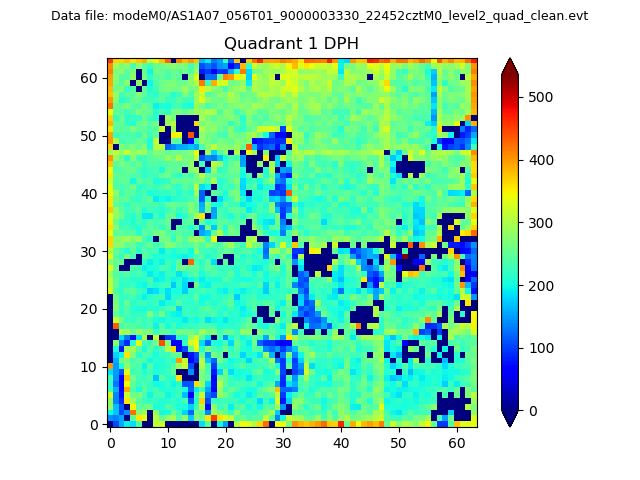 |
Quadrant B |
|---|---|---|---|
| Quadrant D |  |
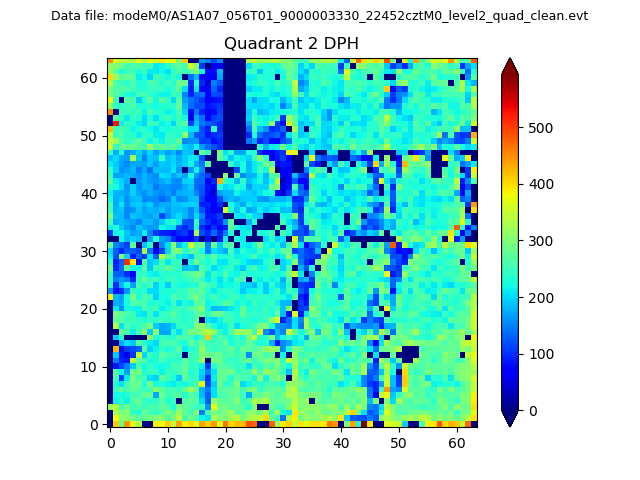 |
Quadrant C |
| Plot type | Count rate plots | Images |
|---|---|---|
| Comparison with Poisson distribution Blue bars denote a histogram of data divided into 1 sec bins. Red curve is a Poisson curve with rate = median count rate of data. |
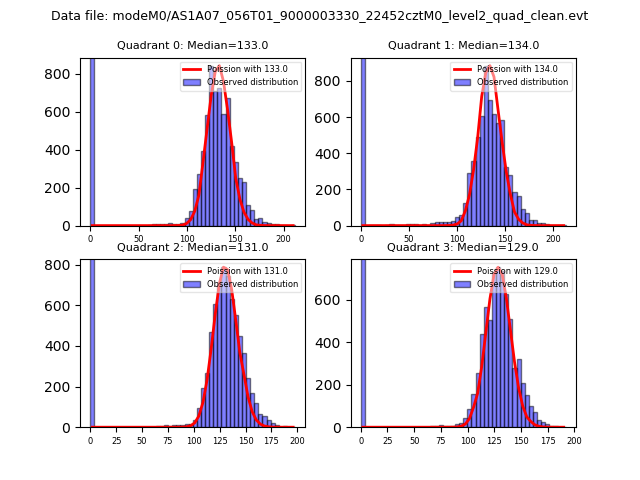 |
 |
| Quadrant-wise count rates Data is divided into 100 sec bins |
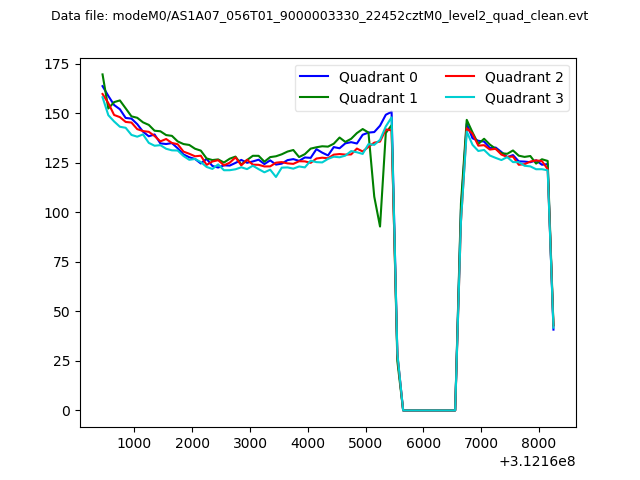 |
|
| Module-wise count rates for Quadrant A Data is divided into 100 sec bins |
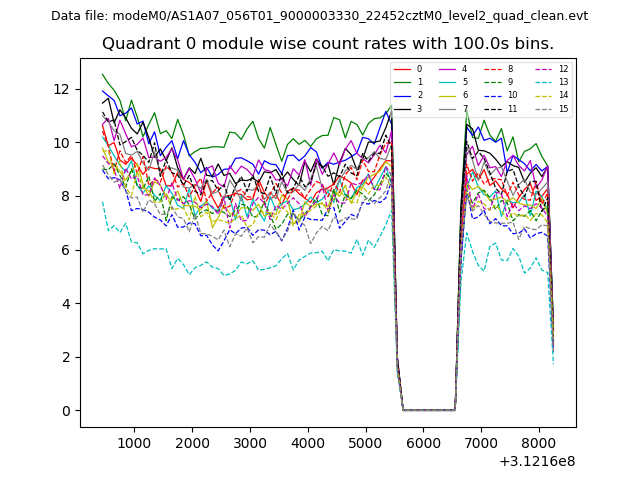 |
 |
| Module-wise count rates for Quadrant B Data is divided into 100 sec bins |
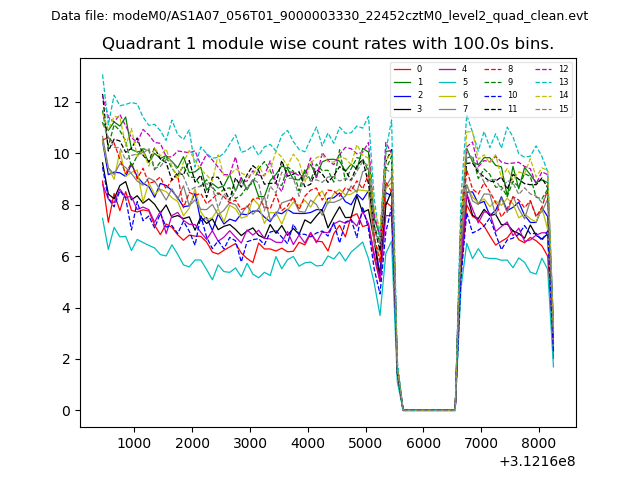 |
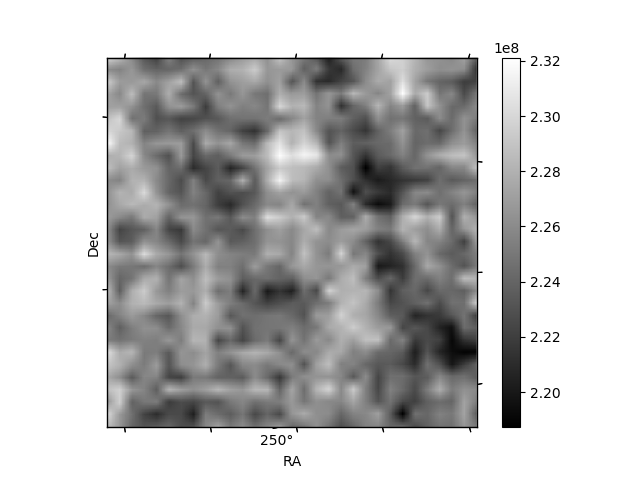 |
| Module-wise count rates for Quadrant C Data is divided into 100 sec bins |
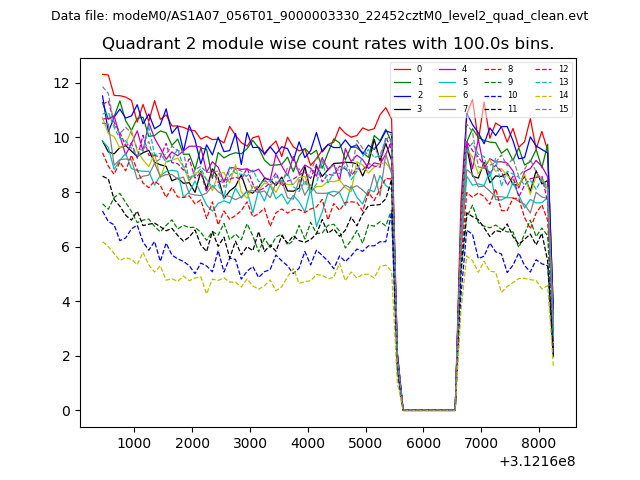 |
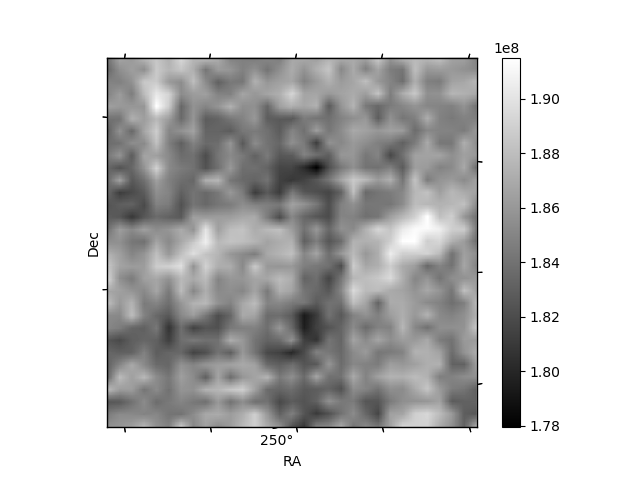 |
| Module-wise count rates for Quadrant D Data is divided into 100 sec bins |
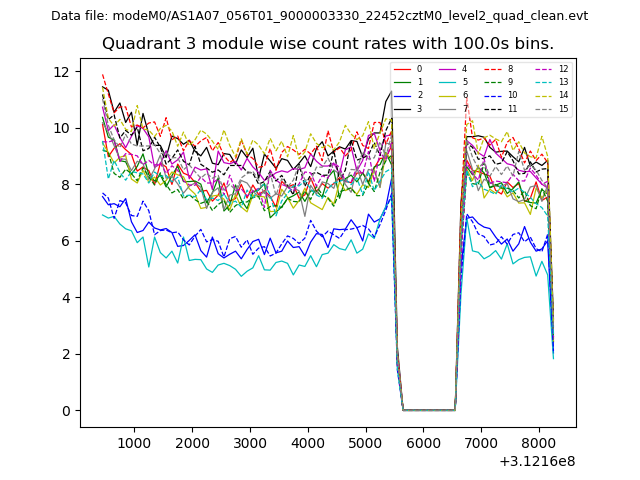 |
 |
| Parameter | Plot |
|---|---|
| CZT HV Monitor | 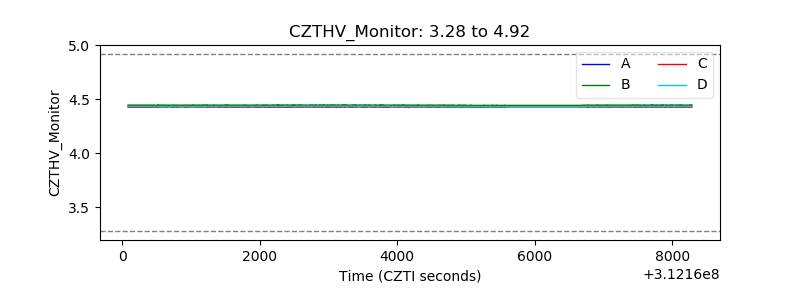 |
| D_VDD | 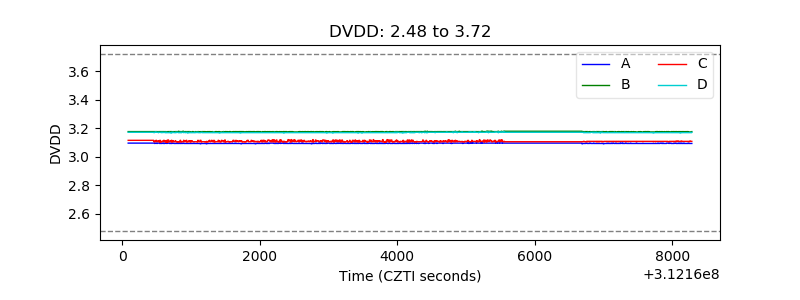 |
| Temperature 1 | 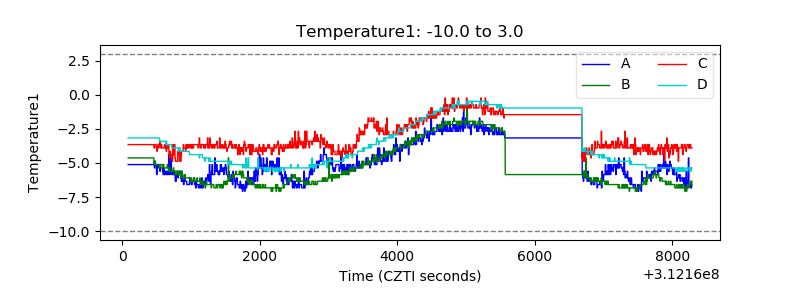 |
| Veto HV Monitor |  |
| Veto LLD | 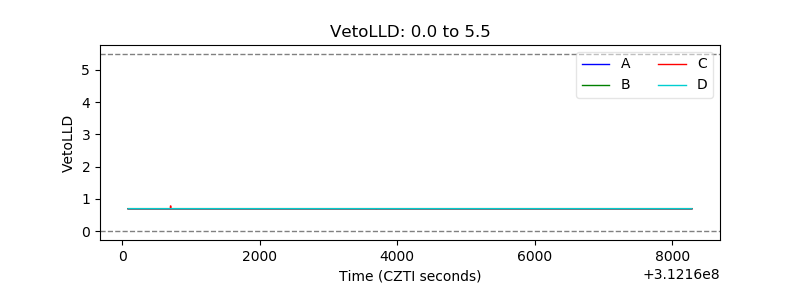 |
| Alpha Counter | 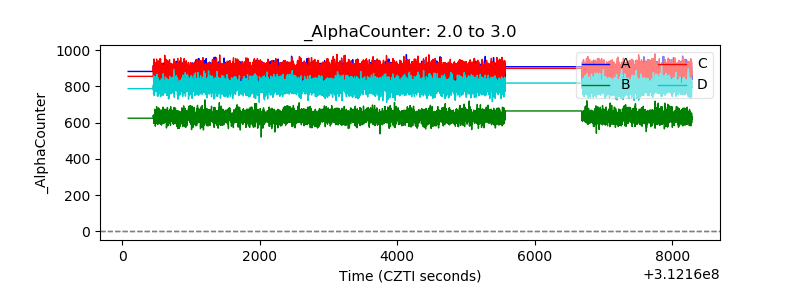 |
| _CPM_Rate |  |
| CZT Counter | 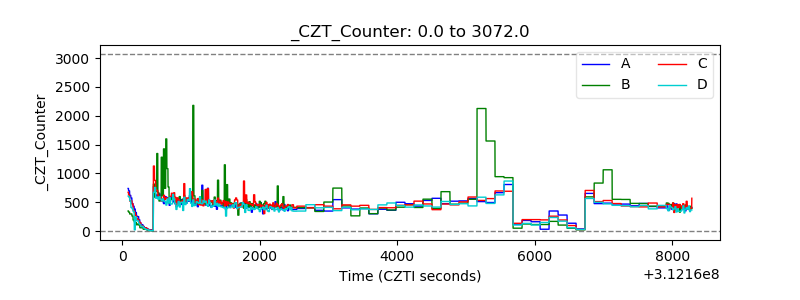 |
| +2.5 Volts monitor | 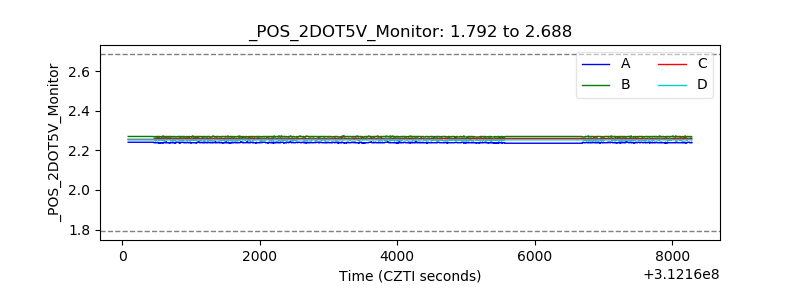 |
| +5 Volts monitor |  |
| _ROLL_ROT | 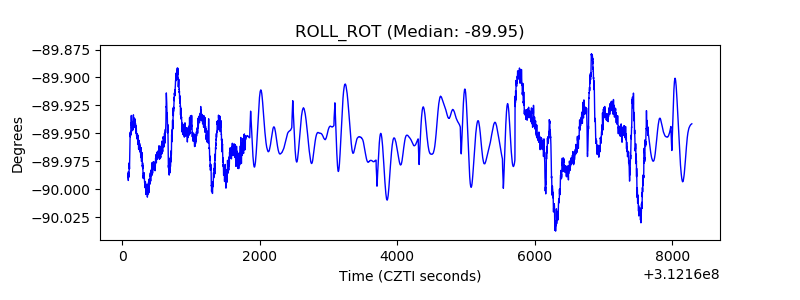 |
| _Roll_DEC | 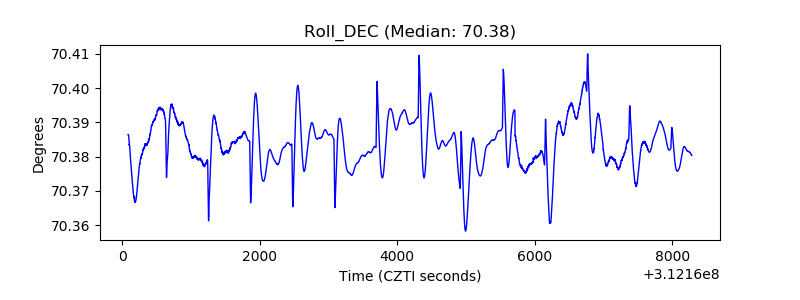 |
| _Roll_RA | 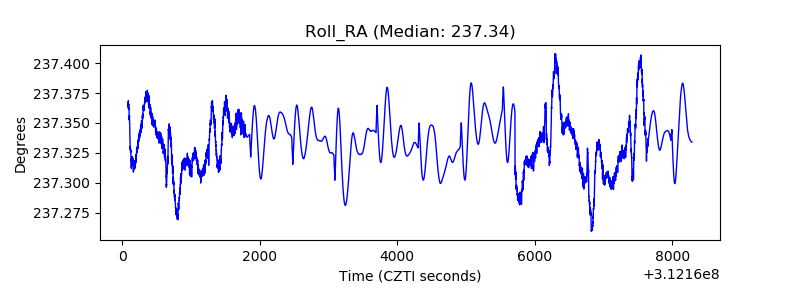 |
| Veto Counter | 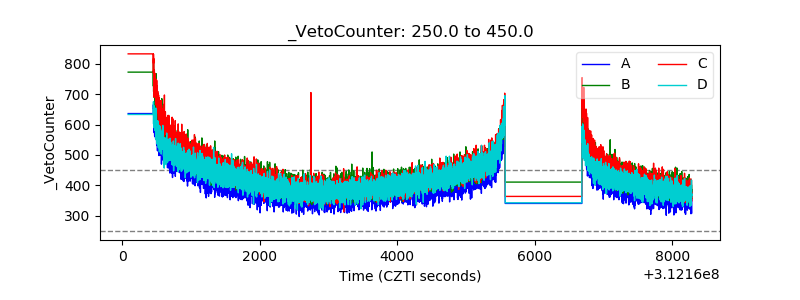 |