| Param | Original file | Final file |
|---|---|---|
| Filename | modeM0/AS1T03_149T06_9000003326cztM0_level2.fits | modeM0/AS1T03_149T06_9000003326cztM0_level2_quad_clean.evt |
| Size (bytes) | 51,370,560 | 36,449,280 |
| Size | 49.0 MB | 34.8 MB |
| Events in quadrant A | 309,276 | 187,042 |
| Events in quadrant B | 298,576 | 189,308 |
| Events in quadrant C | 302,660 | 179,350 |
| Events in quadrant D | 265,860 | 167,254 |
| Mode SS | |||
|---|---|---|---|
| Quadrant | BADHDUFLAG | Total packets | Discarded packets |
| A | 0 | 110 | 0 |
| B | 0 | 110 | 0 |
| C | 0 | 110 | 0 |
| D | 0 | 110 | 0 |
| Mode M0 | |||
|---|---|---|---|
| Quadrant | BADHDUFLAG | Total packets | Discarded packets |
| A | 0 | 11049 | 0 |
| B | 0 | 11192 | 0 |
| C | 0 | 11053 | 0 |
| D | 0 | 11528 | 0 |
| Mode M9 | |||
|---|---|---|---|
| Quadrant | BADHDUFLAG | Total packets | Discarded packets |
| A | 0 | 4 | 0 |
| B | 0 | 4 | 0 |
| C | 0 | 4 | 0 |
| D | 0 | 4 | 0 |
| Quadrant | Total seconds | Saturated seconds | Saturation percentage |
|---|---|---|---|
| A | 5424 | 40 | 0.737463% |
| B | 5424 | 57 | 1.050885% |
| C | 5424 | 84 | 1.548673% |
| D | 5424 | 38 | 0.700590% |
Noise dominated data is calculated using 1-second bins in cleaned event files. If a bin has >2000 counts, and if more than 50% of those come from <1% of pixels, then it is considered to be noise-dominated and hence unusable.
| Quadrant | # 1 sec bins | Bins with >0 counts | Bins with >2000 counts | High rate bins dominated by noise | Noise dominated (total time) | Noise dominated (detector-on time) | Marked lightcurve |
|---|---|---|---|---|---|---|---|
| A | 5809 | 5424 | 0 | 0 | 0.00% | 0.00% | 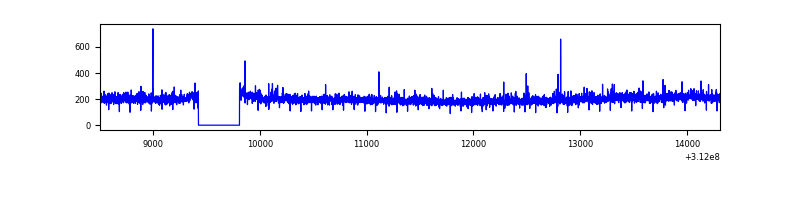 |
| B | 5809 | 5424 | 0 | 0 | 0.00% | 0.00% |  |
| C | 5809 | 5424 | 0 | 0 | 0.00% | 0.00% |  |
| D | 5809 | 5424 | 0 | 0 | 0.00% | 0.00% |  |
Top three noisy pixels from each quadrant. If the there are fewer than three noisy pixels in the level2.evt file, extra rows are filled as -1
| Pixel properties | Quadrant properties | ||||||
|---|---|---|---|---|---|---|---|
| Quadrant | DetID | PixID | Counts | Sigma | Mean | Median | Sigma |
| A | 0 | 29 | 314 | 10.76 | 80 | 76 | 22.1 |
| A | 0 | 30 | 263 | 8.46 | 80 | 76 | 22.1 |
| A | 7 | 110 | 241 | 7.46 | 80 | 76 | 22.1 |
| B | 2 | 9 | 228 | 8.38 | 78 | 75 | 18.2 |
| B | 2 | 8 | 209 | 7.34 | 78 | 75 | 18.2 |
| B | 3 | 17 | 208 | 7.29 | 78 | 75 | 18.2 |
| C | 12 | 241 | 225 | 6.72 | 79 | 74 | 22.5 |
| C | 1 | 80 | 222 | 6.59 | 79 | 74 | 22.5 |
| C | 3 | 202 | 216 | 6.32 | 79 | 74 | 22.5 |
| D | 4 | 246 | 219 | 6.86 | 75 | 68 | 22.0 |
| D | 3 | 14 | 202 | 6.09 | 75 | 68 | 22.0 |
| D | 6 | 62 | 201 | 6.05 | 75 | 68 | 22.0 |
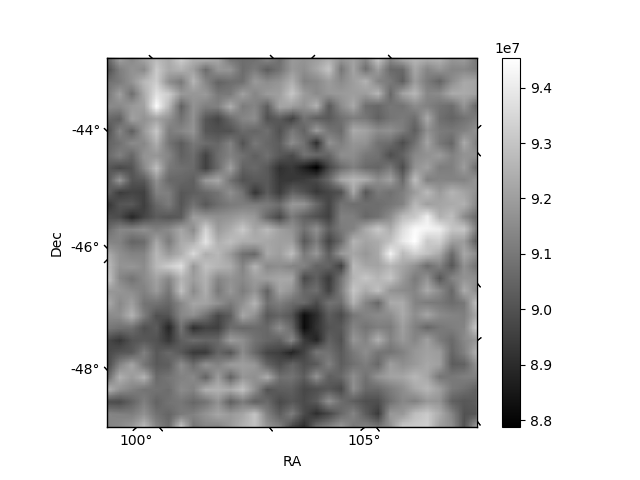
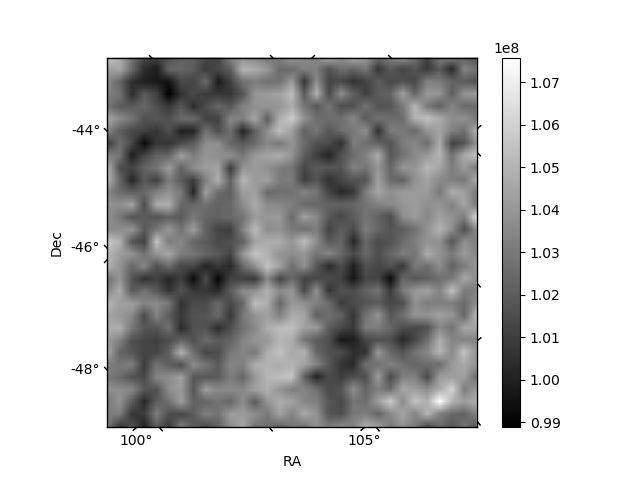
Histogram calculated using DETX and DETY for each event in the final _common_clean file
| Quadrant A | 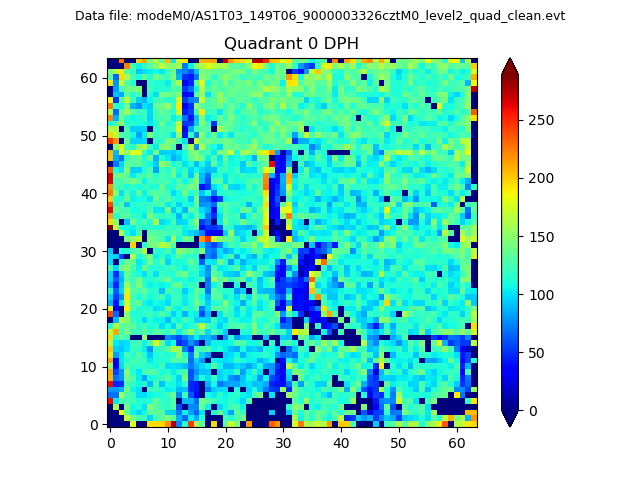 |
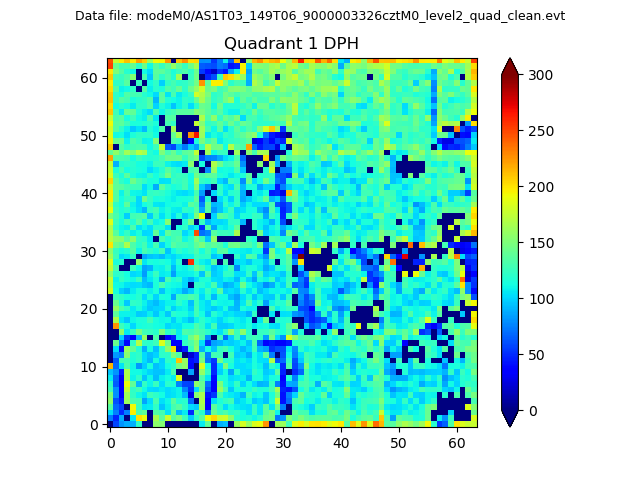 |
Quadrant B |
|---|---|---|---|
| Quadrant D | 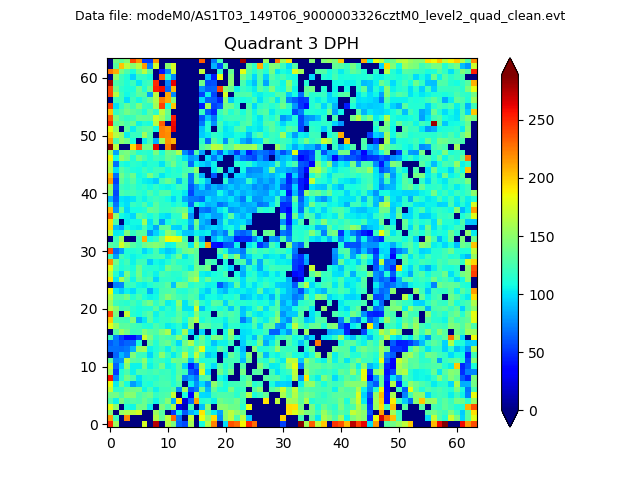 |
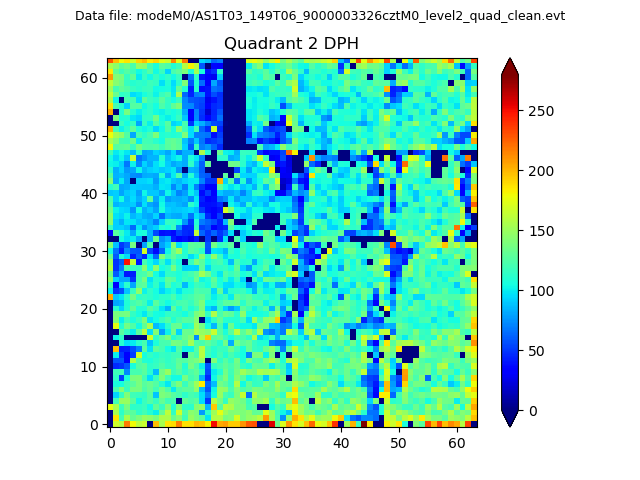 |
Quadrant C |
| Plot type | Count rate plots | Images |
|---|---|---|
| Comparison with Poisson distribution Blue bars denote a histogram of data divided into 1 sec bins. Red curve is a Poisson curve with rate = median count rate of data. |
 |
 |
| Quadrant-wise count rates Data is divided into 100 sec bins |
 |
|
| Module-wise count rates for Quadrant A Data is divided into 100 sec bins |
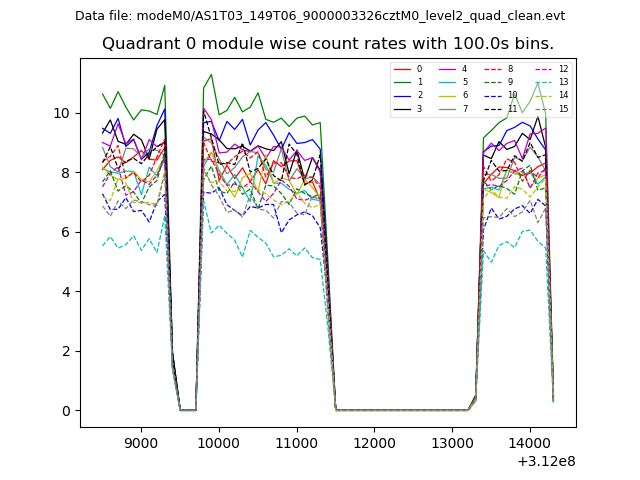 |
 |
| Module-wise count rates for Quadrant B Data is divided into 100 sec bins |
 |
 |
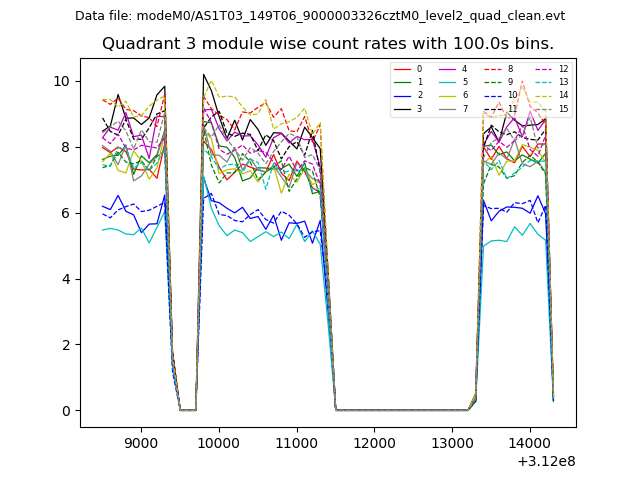
| Module-wise count rates for Quadrant C Data is divided into 100 sec bins |
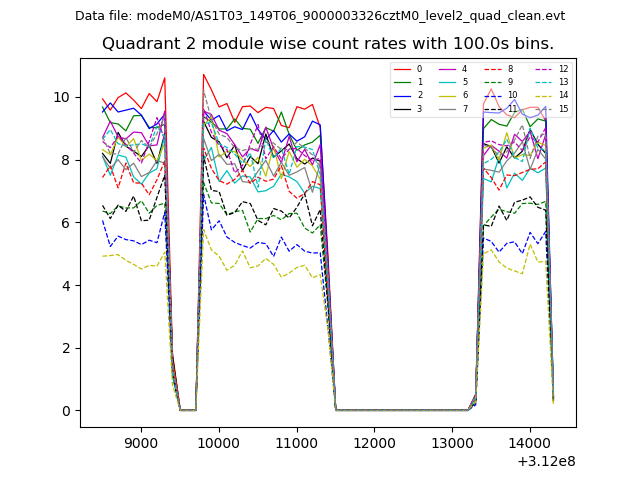 |
 |
| Module-wise count rates for Quadrant D Data is divided into 100 sec bins |
 |
 |
| Parameter | Plot |
|---|---|
| CZT HV Monitor | 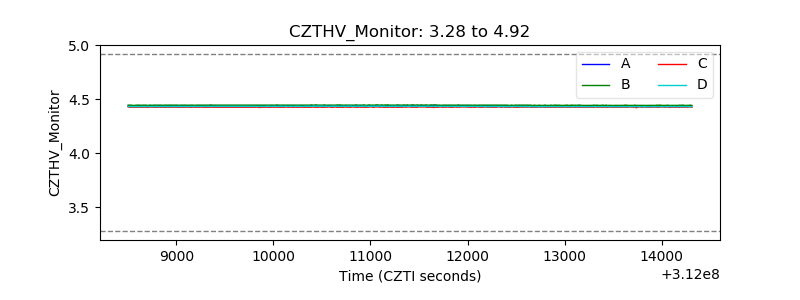 |
| D_VDD | 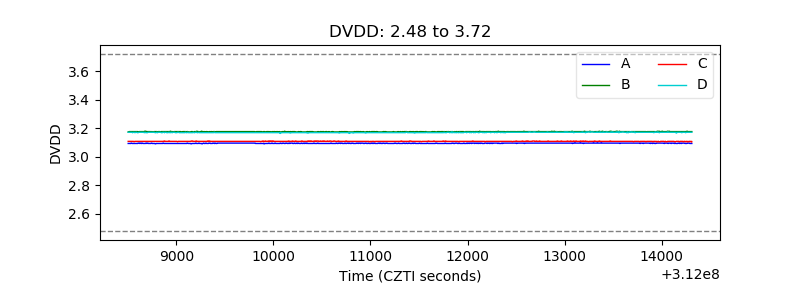 |
| Temperature 1 | 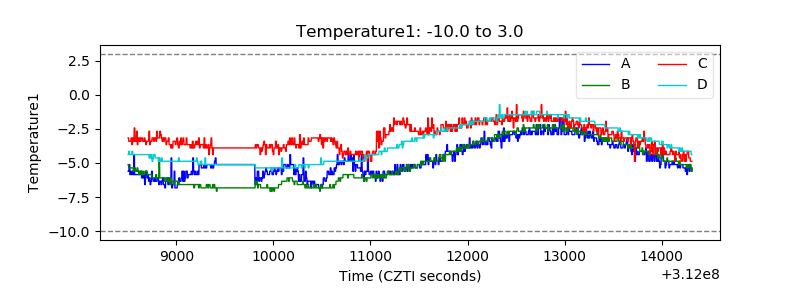 |
| Veto HV Monitor |  |
| Veto LLD | 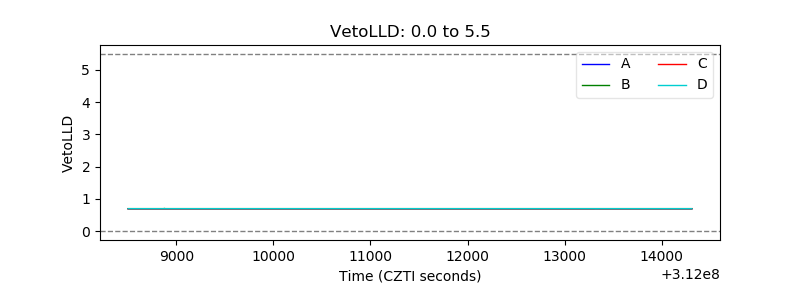 |
| Alpha Counter | 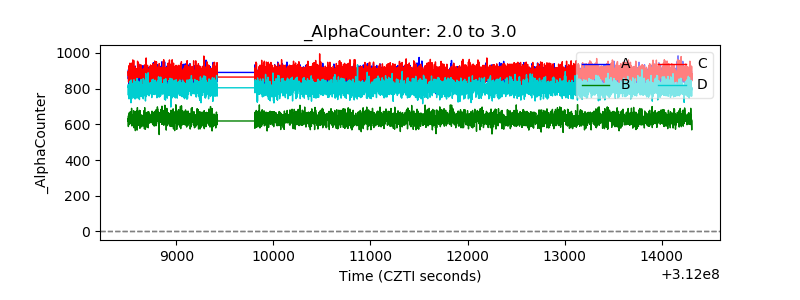 |
| _CPM_Rate | 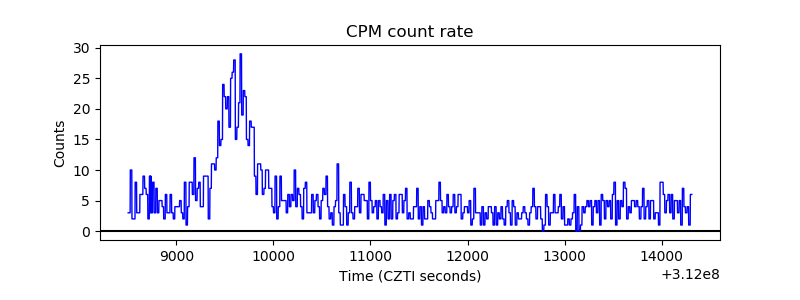 |
| CZT Counter | 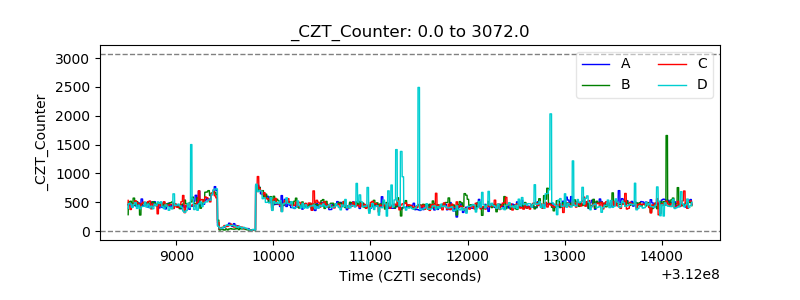 |
| +2.5 Volts monitor |  |
| +5 Volts monitor |  |
| _ROLL_ROT | 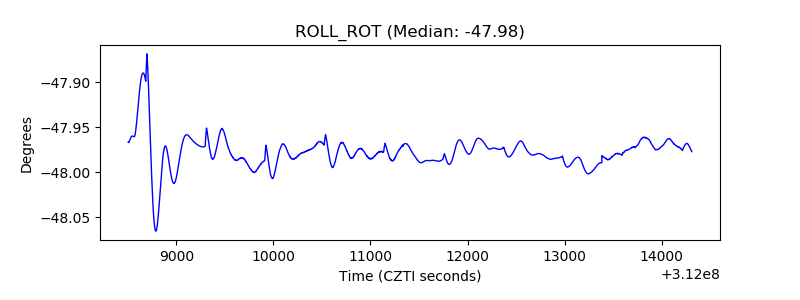 |
| _Roll_DEC | 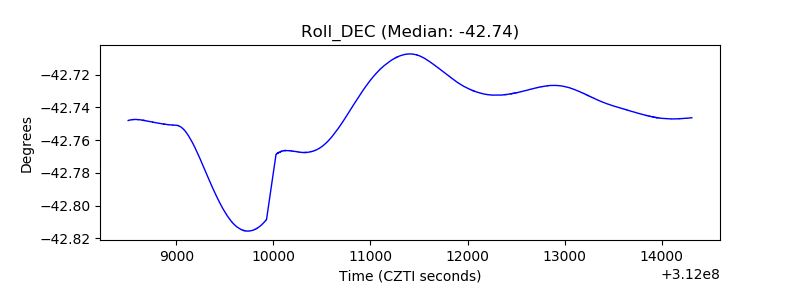 |
| _Roll_RA |  |
| Veto Counter | 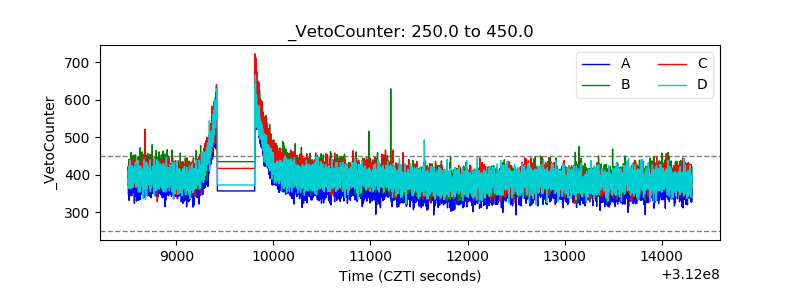 |